Nigerian Journal of Technology (NIJOTECH) Vol. 31, No. 3, November, 2012, pp. 248–260. Copyright©2012 Faculty of Engineering, University of Nigeria. ISSN 1115-8443
FAILURE INVESTIGATION OF REINFORCED CONCRETE
CANTILEVER RETAINING WALLS
I. Abubakara,H.B. Peterb
Department of Civil Engineering, Ahmadu Bello University, Zaria, Nigeria. Emails: a[email protected];bl [email protected]
Abstract
Failure investigation was carried out on a reinforced concrete cantilever retaining wall using First Order Reliability Method (FORM). Four failure modes of the retaining wall were considered namely: overturning; sliding; bearing capacity and bending moment failure modes. The results of the analysis generally showed that the bending moment mode of failure was the most critical, followed by the sliding, the overturning, and by the bearing capacity modes of failure. Also, as the magnitude of the design load was increased by 50kN/m2, the safety of the retaining wall increased
by about 5%, 6% and 25% considering overturning, sliding and bearing capacity failure modes respectively. However, the safety of the structure increased by about 18% when the magnitude of steel reinforcement ratio was increased by 0.1%. Again, when the width of backfill was increased by about 15%, the safety of the structure decreased by about 25% and 34% considering overturning and bearing capacity failure modes; and increased by about 33% and 4% considering sliding, and bending moment failure modes respectively.
Keywords: failure investigation, safety index, cantilever retaining walls
1. Introduction
The aim of a design is to produce structural mem-bers with good safety margin, so that the risk of failure is small. While deterministic design provides output that is precise and exact, it however ignores the certainties of the input design variables. These un-certainties must be taken into account to assess the safety and performance of the structure by the use of the concept of structural reliability [1].
Many sources of uncertainties are inherent in struc-tural design. Despite what designers often think, the parameters of the loadings and the load carrying ca-pacities of structural members are not deterministic quantities. They are random variables, and thus ab-solute safety or zero probability of failure cannot be achieved [2].
Engineering design decisions are surrounded by un-certainties that result from the random nature of load-ing and structural resistance as well as the load and resistance prediction models. The effect of such uncer-tainties is included in design through the use of safety factors that are based on engineering judgment and previous experience with similar structure. Under-estimation of these uncertainties sometimes leads to
adverse results of collapse such as those reported by Lew et al [3]. In general, because of uncertainties, the question of safety and performance has arisen [4]. Due to the fact that safety involves a consideration of random variables and the realization of the limita-tions in design by the deterministic method, it is now generally accepted that the rational approach to the analysis of safety is through the use of probabilistic models [4, 5].
The design of safe structures is generally conducted by checking the performance of individual structural elements, with regard to the actual role in preventing potential collapse of the entire structure [6]. It is in line with this that there is the need to evaluate the design criteria of reinforced cantilever retaining walls using reliability concepts.
The work presented in this paper therefore focused on the failure investigation of a reinforced concrete cantilever retaining wall designed to the requirements of BS8110 [7] and BS8004 [8]. This was achieved by the use of FORM. Four failure criteria for a safe design of the wall were considered, which include overturning, sliding, bearing capacity and bending moment failure criteria. Effect of the variations of basic decision vari-ables was also examined, and the corresponding safety
Failure of Reinforced Concrete Cantilever Retaining Walls 249
indices computed by the use of FORM.
2. First Order Reliability Method
In the evaluation of safety using probabilistic con-cepts it is often the practice to define a safety mar-gin Z on the basis of the performance function
g(x1, . . . , xn) which relates the resistance of the com-ponent to the applied loading. That is,
Z=g(x1, . . . , xn) (1)
In equation (1)g(x1, x2, . . . , xn) represent the design
variables in the design equations. Since the individual members of this function may be random quantities
Z also must be a random variable which must satisfy the condition that Z >0 at the internal points of the safe set, Z = 0 at the limit state, and Z <0 at the internal points of the failure set. A generalized simple safety index can be formed if the random variables collected in the vector X are normalized and collected in another vectorY using a linear mapping of the kind
X = L(Y) such that Y = L−1(X). Therefore the corresponding space of points is then defined by the transformation
x=L(y), y=L−1(x) (2)
The consequence of this transformation maps equa-tion (1) at the limit state into
h(y1, . . . , yn) = 0 (3)
in which
h(y) =g(L(y)) (4)
The mean value of Y occurs at the origin while the projection of Y on a straight line through the origin is a random variable with a unit standard deviation. The distance from the origin to the limit state surface in this normalized space becomes the geometric safety index. In other words,
β=m innpy0y|(y) = 0o (5)
where the minimum of the distance β from the ori-gin toyis obtained for varyingyover the entire limit state surface. A pointyon this limit surface that actu-ally corresponds properly to the globactu-ally most central limit-state point is the checkpoint corresponding to the sought probable failure point.
2.1. Performance functions
The calculation of the performance function is per-formed for discrete combination of basic variables into the failure modes of reinforced concrete cantilever retaining walls in accordance with BS8110 [7] and BS8004[8] given as follows:
2.1.1. Overturning mode of failure
The performance function considering overturning failure mode of the retaining wall is given by,
G(x) =
γconcHts
ts
2 +B−ts−ws
+ 0.5γconctbB2
+wsHγf ill
ws
2 +B−ws
+
α
ts
2 +B−ts−ws
−1.78
0.5Kaγf ill(H+tb)3
3 + 0.5Ka(H+tb)
2 qs
≤0
(6)
Where γconc, qs, and γf ill are the unit weights of concrete, surcharge and backfill respectively. ts and
tb are the thicknesses of stem and base of the wall,B andwsare widths of base and backfill respectively,H is the height of stem,αis the beam estimated loading andKa is active earth pressure on the wall.
2.1.2. Sliding mode of failure
The performance function considering sliding fail-ure mode of the retaining wall is given by,
G(x) ={[γconcHts+γconctbB+wsHγf ill+α]
−3.560.5Kaγconc(H+tb)2+Ka(H+tb)qs ≤0 (7)
All the terms in equation (7) are as defined in section 2.1.1
2.1.3. Bearing capacity mode of failure
Also, the performance function considering base failure mode of the retaining wall is given by,
Gx=
N
B −
6M B2
−((scdciccNc) + (sqdqiqqoNq)
+
s
γdγiγBγNγ 2
≤0
(8)
The following general bearing capacity equation for a strip foundation as attributed to Vesic [9] bearing capacity considerations, though Terzaghi [10], Meyer-hof [11] and Hansen [12] also have some considerations as regards bearing capacity determination but for the purpose of this work all factor of bearing capacity con-siderations are all based on Vesic’s equation given as follows:
Q
B =qu= (scdciccNc)+(sqdqiqqoNq)+
s
γdγiγBγNγ 2
(9) Where in equations (8) and (9),N andM are applied axial loading and moment, qu is the ultimate bear-ing capacity,γ is the density of soil below foundation level, Po is the effective overburden soil pressure at foundation level, Q is the normal component of the ultimate bearing capacity of the foundation,B is the
250 I. ABUBAKAR & H.B. PETER
!
"#
$% &#'%!('
)
*
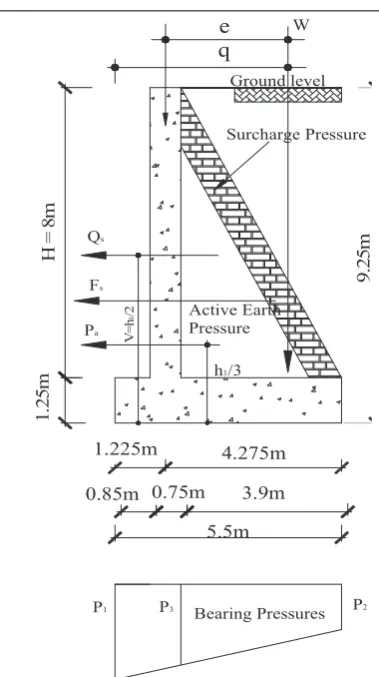
Figure 1: A cantilever retaining wall.
effective width of the base, c is the cohesion of the retained soil, sγ, sq and sc are shape factors; dγ, dq anddcare the depth factors;iγ,iq andic are the load inclination factors; and Nq, Nc, Nγ are the bearing capacity factors under vertical load.
2.1.4. Bending moment mode of failure
The performance function considering the bending failure of the base of the retaining wall is given by,
G(x) =h1.35 (γf illwsH)
ws
2
+ 1.35 (γconctbB)
ws
2
−1
2(P3+P2)ws(x)
−fyρbd
2
1.15
1− 0.45fyρ
0.4623fcu
(10)
In equation (10), the termsP1,P2andP3 are bearing
pressures as shown on the figure 1,fyandfcu are the characteristic strength of steel and concrete respec-tively, b and d are the width and effective depth of the section respectively, ρ is the reinforcement ratio of steel, while other terms are as defined earlier.
3. Results and Discussion
3.1. Example of a cantilever retaining wall
The cantilever retaining wall shown in Fig. 1 was designed as a retaining structure with load acting
on the vertical wall as uniformly distributed. The back face of the abutment wall is subjected to hy-drostatic force from ground water. The backfill ma-terial is a granular mama-terial of saturated density of 1960kg/m3, and of cohesion and angle of internal
fric-tion of 15kN/m2 and 30◦ respectively. The stem wall
is cantilever wall of height, H of 8m, a base width,
B of 5.5m, of stem thickness of wall, t is 750mm, of thickness of the base, tb is 1.25m and the width of the granular material is 3.9m. The surcharge loads,
qs is equal to 10kN/m2, the effective overburden soil pressure at foundation level,Po is 10kN/m2.
The characteristic strengths of steel and concrete are 410 N/mm2 and 30N/mm2 respectively. The re-taining wall was designed in accordance with the de-sign requirements of BS8110 [7] and BS8004 [8], by satisfying the failure modes stated in section (2.1). The design details were as tabulated in Table 1.
3.2. Stochastic models
The stochastic models consisting of the limit state functions given in the previous section were prepared in accordance with FORM [13].
3.3. Results
Reliability analyses of the wall designed in section (3.1) was achieved by the use of FORM [7] by esti-mating the reliability levels at varying heights of wall, widths of backfill, thicknesses of stem of wall, unit weights of soil, the bearing capacity factors, base slab thicknesses, reinforcement ratios; at varying values of applied loading.
Safety indices were obtained from the programs con-sidering the failure modes of the walls as described in section (2.1). Plots of the safety indices versus the var-ied design variables were as shown in figures 2 to 22. The results generally showed that bending moment mode of failure is more sensitive than other modes considering variations in the design variables consid-ered. This is followed by sliding mode of failure, by overturning mode of failure, and by bearing capacity mode of failure which has the highest range of relia-bility indices. This implies that the structure is safer considering the bearing capacity of the soil.
The results are further discussed against each failure mode.
3.3.1. Overturning mode of failure
The structure was checked for overturning moment and reliability results were estimated for different vari-ables ranging from the height of wall, base slab thick-ness and width, width of backfill, stem thickthick-ness, and unit weight of soil. The results are as presented graph-ically in figures 2 to 7.
It was found out from the study that as the mag-nitude of the design load was increased by 50kN/m2
Failure of Reinforced Concrete Cantilever Retaining Walls 251
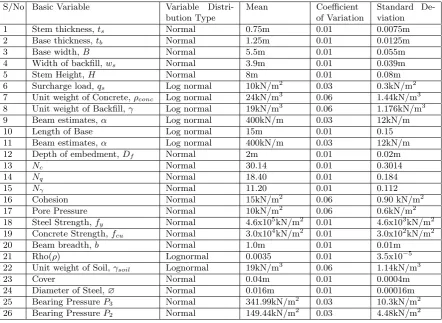
Table 1: Experimental results.
S/No Basic Variable Variable Distri-bution Type
Mean Coefficient of Variation
Standard De-viation
1 Stem thickness,ts Normal 0.75m 0.01 0.0075m
2 Base thickness,tb Normal 1.25m 0.01 0.0125m
3 Base width,B Normal 5.5m 0.01 0.055m
4 Width of backfill,ws Normal 3.9m 0.01 0.039m
5 Stem Height,H Normal 8m 0.01 0.08m
6 Surcharge load,qs Log normal 10kN/m2 0.03 0.3kN/m2 7 Unit weight of Concrete,ρconc Log normal 24kN/m3 0.06 1.44kN/m3 8 Unit weight of Backfill,γ Log normal 19kN/m3 0.06 1.176kN/m3 9 Beam estimates,α Log normal 400kN/m 0.03 12kN/m
10 Length of Base Log normal 15m 0.01 0.15
11 Beam estimates,α Log normal 400kN/m 0.03 12kN/m
12 Depth of embedment,Df Normal 2m 0.01 0.02m
13 Nc Normal 30.14 0.01 0.3014
14 Nq Normal 18.40 0.01 0.184
15 Nγ Normal 11.20 0.01 0.112
16 Cohesion Normal 15kN/m2 0.06 0.90 kN/m2
17 Pore Pressure Normal 10kN/m2 0.06 0.6kN/m2
18 Steel Strength,fy Normal 4.6x10⁵kN/m2 0.01 4.6x10³kN/m2 19 Concrete Strength,fcu Normal 3.0x10⁴kN/m2 0.01 3.0x10²kN/m2
20 Beam breadth,b Normal 1.0m 0.01 0.01m
21 Rho(ρ) Lognormal 0.0035 0.01 3.5x10⁻⁵
22 Unit weight of Soil,γsoil Lognormal 19kN/m3 0.06 1.14kN/m3
23 Cover Normal 0.04m 0.01 0.0004m
24 Diameter of Steel,∅ Normal 0.016m 0.01 0.00016m 25 Bearing PressureP3 Normal 341.99kN/m2 0.03 10.3kN/m2
26 Bearing PressureP2 Normal 149.44kN/m2 0.03 4.48kN/m2
+
+
Figure 2: Reliability index versus height of retaining wall.
252 I. ABUBAKAR & H.B. PETER
+
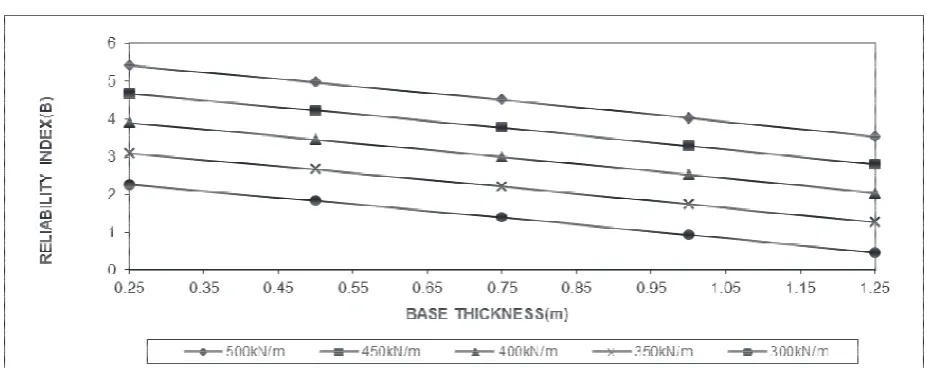
Figure 3: Reliability index versus base thickness of retaining wall.
+
# !"
+
Figure 4: Reliability index versus width of backfill of retaining wall.
+
+
+
+
+
+
++
+
+
+
Figure 5: Reliability index versus thickness of stem of retaining wall.
Failure of Reinforced Concrete Cantilever Retaining Walls 253
+
' (%&
Figure 6: Reliability index versus unit weight of soil of stem of retaining wall.
+
Figure 7: Reliability index versus width of base of retaining wall.
+
+(,*+72)5(7$,1,1*P
5
(
/
,$
%
,/
,7
<
,
1
'
(
;
%
N1P N1P N1P N1P N1P
Figure 8: Reliability index versus height of retaining wall.
254 I. ABUBAKAR & H.B. PETER
+
+
Figure 9: Reliability index versus base thickness of retaining wall.
(20%), the safety of the wall increased by 5.32%. It was observed from figure 2 as the height of the wall was increased by 0.50m (6.25%), the safety of the structure decreased by 32.40%. Similarly from fig-ures 3 and 4, when the base thickness was increased by 0.50m (40%) and the backfill width increased by 0.50m (15.38%), it was observed that the safety de-creased by 17.33% and 25.03% respectively.
Also from figure 5, increasing the retaining wall stem thickness by 0.75m (100%) the structural safety decreased by 10.65%. The results from figure 4 indi-cate that at a width of backfill of 5m the safety level was at its optimum value [14–17], and the convergence means that all the design variables used for the deter-ministic design are to have the same reliability index. Again from figure 6, by increasing the magnitude of the unit weight of backfill by 1kN/m3 (5.56%), the safety of the structure increased by 7.29%, while decreasing the unit weight of backfill by 2kN/m3 (11.11%), the safety of the structure decreased by 15.57%. And from figure 7, it was observed that by increasing the base width by 0.5m, the safety of the structure increased by 52.88%.
3.3.2. Sliding mode of failure
The structure was checked for sliding failure mode and reliability results were estimated for different vari-ables ranging from the height, base slab thickness, width of backfill, stem thickness, weight of soil, and base slab width. The results are as presented graphi-cally in figures 8 to 13.
It was found out that as the magnitude of the de-sign load was increased by 50kN/m2(20%), the safety
of the structure increased by 6.13%. It was observed from figure 8 that as the height of the wall thickness was increased by 0.50m (6.25%) the safety of the struc-ture decreased by 44.51%. From figure 9, when the base thickness was increased by 0.50m (40%) it was
observed that the safety of the structure decreased by 12.41%.
Also from figure 10, when the magnitude of the width of backfill was increased by 0.50m (15.38%) the structural safety increased by 33.43%. It was also observed from figure 11 that when the magni-tude of the retaining wall thickness was increased by 0.25m (33.33%), the safety of the structure increased by 24.65%. From figures 12 and 13, as the unit weight of soil and base width of the wall were increased by 2kN/m3 (10.53%) and 1.00m (18.18%) respectively,
the safety of the structure correspondingly increased by 25% and 29%.
3.3.3. Bearing capacity mode of failure
The structure was checked for bearing capacity fail-ure mode and reliability results were estimated for different variables ranging from the height, base slab thickness, width of backfill, stem thickness, weight of soil, and base slab width. The results are as presented graphically in figures 14 to 18.
It was found out that when the magnitude of the design loads on the retaining wall was increased by 50kN/m2 (20%) the safety of the structure increased
by 25.53%. It was observed from figure 14 that as the height of the wall was increased by 0.01m (0.16%), the safety of the structure increased by 0.83%. Again from figure 15, when the width of back fill was increased by 0.5m (15.38%) it was observed that the safety of the structure decreased by 34.32%.
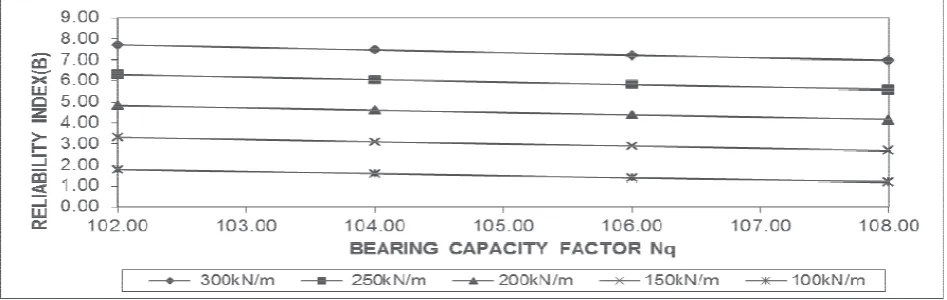
It was also observed from figure 16 that by increas-ing the value of the bearincreas-ing capacity factor Nq by 2 (1.96%) the safety of the structure increased by 3.49%. However from figure 17, increasing the value of the bearing capacity factor Nc by 5 (4.54%) the safety of the structure increased by 7.46%. And from figure 18, by increasing the value ofNγ by 1 (2.22%) the safety of the structure increased by 4.05%.
Failure of Reinforced Concrete Cantilever Retaining Walls 255
+
, !"
Figure 10: Reliability index versus width of backfill of retaining wall.
+
+
Figure 11: Reliability index versus thickness of stem of retaining wall.
+
+
+
+
+
+
++
+
+
+
Figure 12: Reliability index versus unit weight of soil of stem of retaining wall.
256 I. ABUBAKAR & H.B. PETER
+
+
Figure 13: Reliability index versus base width of retaining wall.
+
#
Figure 14: Reliability index versus height of retaining wall.
+
+
Figure 15: Reliability index versus width of backfill of retaining wall.
Failure of Reinforced Concrete Cantilever Retaining Walls 257
+
Figure 16: Reliability index versus bearing capacity factor,Nq.
+
+
Figure 17: Reliability index versus bearing capacity factor,Nc.
+
+
+
+
Figure 18: Reliability index versus bearing capacity factor,Nγ.
258 I. ABUBAKAR & H.B. PETER
* !/!!01
3+
+
+
++
+
+
+(,*+72)5(7$,1,1*:$//P
5
(
/
,$
%
,/
,7
<
,
1
'
(
;
%
+
+
Figure 19: Reliability index versus height of retaining wall.
3.3.4. Bending moment failure mode
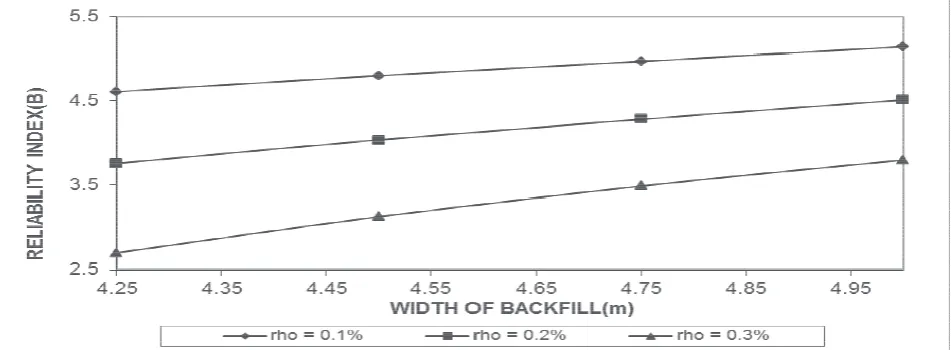
The structure was checked for bending moment fail-ure mode and reliability results were estimated for different variables ranging from the height, base slab thickness, width of backfill, stem thickness, weight of soil, and base slab width. The results are as presented graphically in figures 19 to 22.
It was found out that when the magnitude of the reinforcement ratio of steel was increased by 0.10%, the safety of the structure increased by 18.43%. From figure 19 when the height of the wall was increased by 2m (25%) the safety of the structure increased by 13.16%. Also, from figure 20, by increasing the width of backfill by 0.5m (15.38%) it was observed that the structural safety increased by 4.12%. From figure 21, increasing the base slab thickness by 0.10m (12.5%) the safety decreased by 0.87%, and by increasing the width of the base slab (from figure 22) by 1m (10%) the safety of the structure increased by 2.26%.
4. Conclusion
Failure investigation of a cantilever retaining wall considering the design requirements of BS8110 [7] and BS8004 [8] was presented. The failure criteria of over-turning, sliding, bearing capacity and bending were examined using FORM in estimating the reliability indices when all the variables regarding loading, geom-etry and material properties were considered as ran-dom.
It was shown that as the magnitude of the design load was increased by 50kN/m2, the safety of the
re-taining wall increased by about 5%, 6% and 25% con-sidering overturning, sliding and bearing capacity fail-ure modes respectively. It was also observed that as the magnitude of reinforcement ratio was increased by 0.1%, the safety of the structure increased by about 18%. Also, at a width of backfill of 5m the safety level
was at its optimum value considering overturning fail-ure mode and is in agreement with JCSS [14].
Again, when the width of backfill was increased by about 15%, the safety of the structure decreased by about 25% and 34% considering overturning and bear-ing capacity failure modes; and increased by about 33% and 4% considering sliding, and bending moment failure modes respectively.
Based on the reliability indices obtained, the bend-ing moment mode of failure was the most critical, followed by the sliding, the overturning, and by the bearing capacity modes of failure.
References
1. Yang, J. and Dewolf, J. Reliability Assessment of Highway Truss Sign Supports. Journal of Structural Engineering, Vol. 128, No 11, 2002, pp. 1429–1438.
2. Andrzej, S. N. and Kevin, R.C.Reliability of Struc-tures. 1st Ed. McGraw-Hill Professional, India, 2000.
3. Lew, H.S., Carino, N.J. and Fattal, S.G. Cause of Condominium Collapse in Cocoa Beach, Florida. Journal of Concrete International, 1982, pp. 64-67. 4. Melchers, R.E. Structural Reliability Analysis and
Prediction. John Wiley and Sons, New York, 1999. 5. Ang, A.H.-S. and Tang, W.H.Probability Concepts in
Engineering Planning and Design. Vols I & II, Wiley, New York, 1984.
6. Lin T. S. and Corotis R. B. Reliability of Ductile Sys-tems with Random Strengths. Journal of Structural Engineering, Vol. 3, No 6, 1985, pp. 1306–1325.
7. BS8110. The Structural Use of Concrete: Parts 1-3. British Standards Institution, London, United King-dom, 1997.
8. BS8004. Code of Practice for Foundations. British Standards Institution, London, United Kingdom, 1986.
9. Vesic, A.S. Analysis of Ultimate Loads of Shallow Foundations. Journal of Geotechnical Engineering, Vol. 99 No. 1, 1973, pp. 43-73.
Failure of Reinforced Concrete Cantilever Retaining Walls 259
+
Figure 20: Reliability index versus width of backfill of retaining wall.
Figure 21: Reliability index versus base slab thickness of retaining wall.
:,'7+2)%$6(6/$%P
5
(
/
,$
%
,/
,7
<
,
1
'
(
;
%
Figure 22: Reliability index versus width of base slab of retaining wall.
260 I. ABUBAKAR & H.B. PETER
10. Terzaghi, K.Theoretical Soil Mechanics. Wiley, New York, 1943.
11. Meyerhof, G.C. Some Recent Research on the Bear-ing Capacity of Foundations. Canadian Geotechnical Journal, Vol. 1, No. 1, 1963, pp. 16-26.
12. Hansen, J. B.A Revised and Extended Formula for Bearing Capacity. Danish Geotechnical Institute, Bulletin 28, Copenhagen, 1970.
13. Gollwitzer, S., Abdo, T. and Rackwiz, K.First Order Reliability Method (FORM): Users Manual. RCP-GMBH, Munich, West Germany, 1988.
14. JCSS.Probabilistic Model Code. Publication of Joint Committee on Structural Safety, 12th Draft, 2001.
15. Abubakar, I. Reliability Analysis of Structural Design Parameters of Fixed Column Strip Footings. Journal of Engineering Technology, Vol. 3, No. 1, 2008, pp. 12–19.
16. Sule, S. Probabilistic approach to structural Ap-praisal of a building during Construction. Nigerian Journal of Technology, Vol. 30, No. 2, 2011, pp. 149–153.
17. Shema, M.A. and Abejide, O.S. Safety of premature loading on reinforced concrete Slabs. Nigerian Jour-nal of Technology, 2009, Vol. 28, No. 1, pp. 5–15.