Vol. 4, No. 6 (2014): 773-779 Research Article
Open Access
I
ISSSSNN:: 22332200--66881100
Novel Sensitive spectrophotometric methods for
determination of Retigabine in Bulk and
Pharmaceutical Formulations
Ravisankar Panchumarthy*, Lokapavani CH, Devadasu CH and Srinivasa Babu P.
Department of Pharmaceutical Analysis and Quality Assurance, Vignan Pharmacy College, Vadlamudi, Guntur - 522213, Andhra Pradesh, India.
* Corresponding author: Ravisankar P; e-mail: [email protected]
ABSTRACT
For the first time two simple and selective, sensitive, cost effective spectrophotometric methods have been developed for the estimation of Retigabine in pure and pharmaceutical formulations. Of two methods, method M1 is based on
the diazotization of primary aromatic amine of Retigabine with nitrous acid followed by coupling with Bratton-Marshal reagent to give pink colored azo dye, which showed maximum absorbance at 515 nm at reagent blank, and in method M2 is based on the formation of yellow colored schiff’s base of Retigabine with p-dimethyl
aminobenzaldehyde which shows the absorbance maximum at 424.8 nm under the optimized experimental conditions. The developed method obeyed Beer’s law over the concentration ranges of 5-25 µg/mL for methods M1
and M2 respectively. In both cases the R2 is more than 0.9997. These methods were validated in pursuance of ICH Q2
(R1) guidelines. The % recovery was found to be in the range of 99.05 to 99.98% for M1 and 99.06 to 99.86% for
method M2. With regard to precision, the intraday and interday precision for methods M1 and M2 were found to be
0.105 µg/mL, 0.115µg/mL and 0.197 µg/mL, 0.182 µg/mL, respectively. The results relating to LOD and LOQ for methods M1 and M2 were found to be 0.703 µg/mL, 2.131µg/mL and 0.446 µg/mL, 1.353 µg/mL respectively. The
molar absorptivity, Sandell’s sensitivity, for both methods were also reported. No interference due to the commonly used excipients, the method is specific for detecting Retigabine. Hence, the developed methods can be applied successfully to the determination of Retigabine in bulk and pharmaceutical formulations.
Keywords:
Retigabine, Spectrophotometric methods, Bratton-Marshal reagent, PDAB, Schiff’s base.INTRODUCTION
Retigabine (Ezoganine) is a novel anticonvulsant drug utilized for the treatment of partial epilepsies [1-3]. It is chemically N-[2-Amino-4-(4-fluorophenylmethylamino )-phenyl] carbamic acid ethyl ester. Retigabine works as a potassium channel opener [4-10] that is to say by activating a definite family of voltage-gated potassium channels in the brain. Retigabine pharmacokinetics is primarily linear over the single dosage range of 25 mg to 600 mg in healthy human volunteers [11]. This mechanism of action is unique among anti-epileptic drugs, and may hold promise for the treatment of other neurological conditions such as migraine, neuropathic pain and tinnitus. For the synthesis of Retigabine [12] starting materials 2-nitro-1,4-phynylene diamine is reacted with 4-fluoro benzaldehyde. It is easily
synthesized in 3 step procedure. Retigabine is rapidly absorbed and distributed in the man with oral bioavailability [13] of 60% and plasma binding of the drug is approximately 80%. It is purple coloured compound with molecular weight of 376.23, log p of 2.0 and pKa of 10.8. The chemical structure of Retigabine is shown in the following Fig.1.
N H F
H
N O
NH2
O
Figure 1. Chemical structure of Retigabine.
A detailed literature survey reveals that only one RP-HPLC [14] method has been reported for the determination of Retigabine in pharmaceutical dosage forms. Infact no spectrophotometric methods have been reported for the estimation of Retigabine previously in pharmaceutical dosage forms. Keeping in view of this an attempt has been made to develop simple, precise, accurate, and reliable two spectrophotometric methods with two chromogenic reagents namely BM reagent and PDAB reagents for the estimation of Retigabine in bulk and its pharmaceutical formulations. Retigabine consists of different functional moieties of varied reactivity such as primary aromatic amine, cyclic tertiary amine and carbonyl functional groups. Two methods were developed based on the reactivity of primary aromatic amine and other functional groups of the drug. Even though the structures of the colored species have not been established experimentally, an attempt has been made to indicate the nature of the colored species in each proposed method tentatively based on analogy.
The core aim of the present study was to explore the possibility of utilizing feasible simple colorimetric method for estimating Retigabine in formulations. The main advantages of these developed methods are quick, trouble-free, cost effective, convenient technique.
Method M1 is based on the diazotization of primary
aromatic amine of Retigabine with nitrous acid followed by coupling with Bratton-Marshal reagent to give a pink colored azo dye. In method M2 when
Retigabine is treated with PDAB it undergoes a formation of yellow colored Schiff’s base of Retigabine with p-dimethyl amino benzaldehyde. In actual, fact studies were carried out to establish the most positive conditions for the development of colored species in both methods and were validated in pursuance of ICH guidelines [15]. As a matter of fact both developed methods are rapid, easy, sensitive and without difficulty feasible in regular quality control analysis of pharmaceutical formulations.
MATERIALS AND METHODS
Chemicals and reagents:All the chemicals and reagents employed in the present study were of analytical grade. Retigabine pure gift sample was supplied by Hetero Drugs Ltd., Hyderabad, Andhra Pradesh, India. TROBALT tablets containing Retigabine with labeled amount of 50 mg, 100 mg, 200 mg are manufactured by GlaxoSmithKline pvt Ltd., Reagents such as BM of Merck company, AS from Loba company, NaNO2 from Loba company, PDAB of Loba
company, and eventually triple distilled water manufactured from Vignan Pharmacy College.
Instruments used:
A Systronics Double beam Ultra violet visible spectrophotometer 2203 with properly matched quartz cells (1 cm path length) were utilized for all present investigation.
Preparation of Reagents and standards:
For method M1:
Bratton-Marshal reagent (0.1% w/v): Prepared by
dissolving 50 mg of N-(1-napthyl) ethylene diamine dihydrochloride in 50 mL of distilled water.
Ammonium sulfamate solution (0.5% w/v):
Prepared by dissolving 250 mg of ammonium sulfamate in 50 mL of distilled water.
NaNO2 solution (0.1% w/v): Prepared by dissolving
50 mg of sodium nitrite in 50 mL of distilled water.
5N HCl solution: Prepared by diluting 2.225 mL of
concentrated hydrochloric acid to 50 mL with distilled water.
For method M2:
PDAB solution (0.2% w/v): Prepared by dissolving 50
mg of p-dimethyl amino benzaldehyde in 25 mL of methanol.
H2SO4 solution (10% v/v): 1mL of sulfuric acid was
added to about 10 mL of ice cooled methanol solvent and finally volume was made upto 100 mL of methanol.
Preparation of standard stock solutions: For methods M1 and M2:
The stock solution 1000µg/mL of Retigabine was prepared by dissolving 10 mg of the Retigabine in 10 mL of methanol. This stock solution was suitably diluted with methanol to get working standard solution having a concentration of 100 µg/mL.
Selection of detection wavelength:
In the present study drug solutions of 10µg/mL concentration solution of Retigabine were separately prepared with diluents. Drug with both reagents were scanned over the range 400-800 nm in spectrum mode by using spectrophotometer. It was observed that optimum absorbances of Retigabine with BM solution and PDAB solution were found to be 515 nm and 424.8 nm respectively.
Recommended procedures: For bulk samples
Method M1:
Into a series of 10 mL volumetric flasks, standard solution 100 µg/mL of Retigabine in the concentration range of 5-25 µg i.e., 0.5 – 2.5 mL was transferred. The volumes in all flasks were adjusted with methanol to 0.5mL. Then 1.0 mL of NaNO2, 1.0 mL of 5N HCl were
added and kept aside for 10 minutes. To these flasks 1mL of AS solution and 1 mL of NED solution was added and final volume was made up mark with 10 mL distilled water. The absorbance was measured at 515 nm against reagent blank. The amount of Retigabine was deduced from its Beer-Lambert’s plot.
Method M2:
range of 5-25 µg i.e., 0.5 – 2.5 mL was transferred and 1.0 mL of PDAB followed by 0.1 mL of 10% H2SO4 was
added. The final volume was adjusted to 10 mL with methanol. The absorbance was measured at 424.8 nm against the reagent blank. The amount of Retigabine was computed from its calibration curve.
For pharmaceutical formulations:
Twenty tablets of Retigabine were accurately weighed and average weight was calculated and powdered well. A quantity of tablet powder equivalent to 50 mg of Retigabine was correctly weighed and transferred into a 50 mL of volumetric flask containing sufficient amount of methanol. The content of flask was sonicated for 20 minutes by occasional shaking to dissolve Retigabine and made up the volume with the same and the resulting mixture was filtered through 0.45 µm filter into 50 mL calibrated standard volumetric flask, then it was appropriately made up to the volume with the methanol and used for method M1 and method M2.
After words subsequent dilution of this solution was
made to get working standard solutions as described under the procedure for bulk samples.
RESULTS AND DISCUSSION
Spectral Characteristics:In order to obtain the optimum wavelength of
maximum absorption (λmax), of the colored species
formed in method M1 and M2, specified amounts of
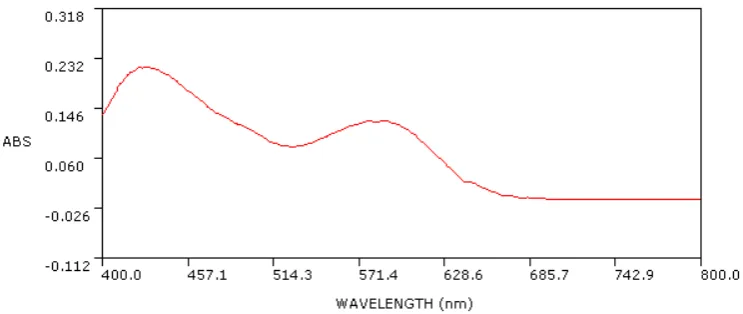
Retigabine was taken and the colors were developed separately following the above said procedures individually. The absorption spectra were scanned in the spectrophotometer in the wavelength region of 400-800 nm against a corresponding reagent blank. Retigabine shows the absorption maxima at 515 nm for method M1 and 424.8 nm for method M2. The spectra of
both methods are graphically presented in the Fig. 2 and 3. The absorption curves of colored species formed in each method shows characteristic absorption maximum whereas the blank (without drug) in each method has low or no absorption in this region.
Figure2.Absorption spectra of Retigabine with NED system and its reagent blank
Figure 3. Absorption spectra of Retigabine with PDAB system and its reagent blank
Optimum conditions fixation in the procedures:
In developing these methods, a systematic study of the effects of different relevant parameters in the methods concerned were under taken by changing one parameter at a time and controlling all other parameters to get utmost color development, minimum blank color, reproducibility and the reasonable period
of stability of eventual colored species formed. The subsequent studies were conducted for this purpose.
Method M1:
concentration and volume of 5M HCl, concentration of NaNO2, NED and AS effect of order of addition of
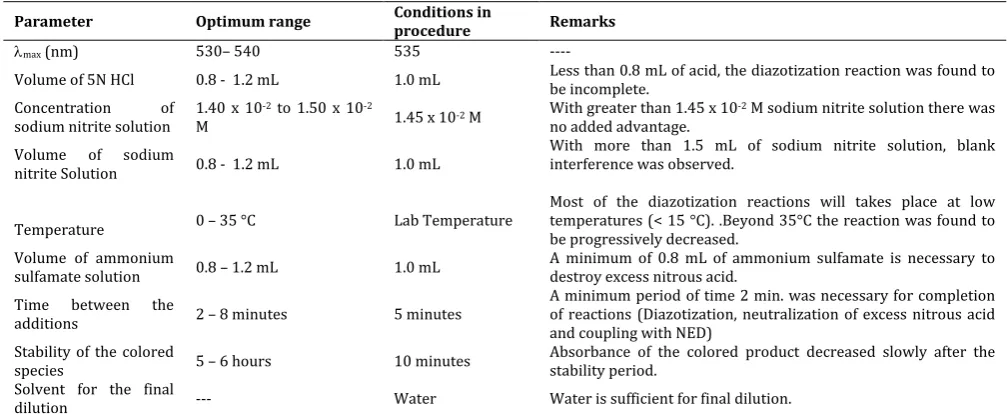
reagents and solvent for eventual dilution. The results are presented in Table 1.
Method M2:
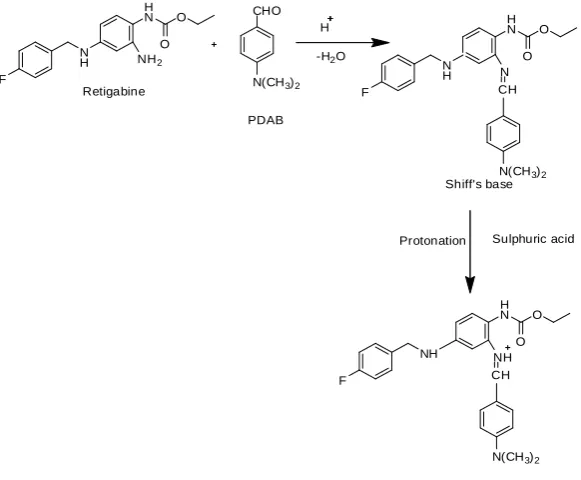
This method is based on the Schiff’s base formation of Retigabine with PDAB. The author studied the effect of concentration of PDAB, concentration of acid, effect of temperature and reaction time to achieve the maximum color development. The optimum conditions observed and results obtained are tabulated in Table 2.
Table 1. Optimum conditions established for method M1 Parameter Optimum range Conditions in procedure Remarks
λmax (nm) 530– 540 535 ----
Volume of 5N HCl 0.8 - 1.2 mL 1.0 mL Less than 0.8 mL of acid, the diazotization reaction was found to be incomplete. Concentration of
sodium nitrite solution 1.40 x 10
-2 to 1.50 x 10⁻²
M 1.45 x 10⁻² M With greater than 1.45 x 10
-2 M sodium nitrite solution there was no added advantage.
Volume of sodium
nitrite Solution 0.8 - 1.2 mL 1.0 mL
With more than 1.5 mL of sodium nitrite solution, blank interference was observed.
Temperature 0 – 35 °C Lab Temperature
Most of the diazotization reactions will takes place at low temperatures (< 15 °C). .Beyond 35°C the reaction was found to be progressively decreased.
Volume of ammonium
sulfamate solution 0.8 – 1.2 mL 1.0 mL A minimum of 0.8 mL of ammonium sulfamate is necessary to destroy excess nitrous acid. Time between the
additions 2 – 8 minutes 5 minutes
A minimum period of time 2 min. was necessary for completion of reactions (Diazotization, neutralization of excess nitrous acid and coupling with NED)
Stability of the colored
species 5 – 6 hours 10 minutes Absorbance of the colored product decreased slowly after the stability period. Solvent for the final
dilution --- Water Water is sufficient for final dilution.
Table 2. Optimum conditions established for method M2
Parameter Optimum range Conditions in procedure Remarks
λmax (nm) 420 – 540 530 ----
Volume of PDAB
solution. 0.8 – 1.2 mL 1.0 mL. 1.0 mL of PDAB solution is required for optimum color development. Volume of 10% H2SO4
solution. 0.05 – 0.15 mL 0.1 mL With more than 0.15 mL of 10% H2SO4, the color was destroyed. Sequence of addition of
reagents --- Retigabine, PDAB and H2SO4 Changing of addition of reagent sequence resulted in low absorbance values. Temperature Room temperature Room temperature Increasing temperature has no added advantage. Solvent for final dilution --- Methanol Methanol was found to be the best solvent. Stability of the colored
species 10 – 50 minutes 10 minutes Absorbance of the colored product decreased slowly after the stability period.
Table 3. Optical characteristics, regression data, of the proposed methods for Retigabine
Parameter M1 M2
λmax (nm) 515 424.8
Beer’s law limits ( μg / mL) 5-25 5-25
Molar absorptivity (L. mole-1 cm-1) 534 423 Sandell’s sensitivity
(μg /cm 2/0.001 absorbance unit) 0.018726592 0.023640662
Regression equation (Y = a+ bc):Slope (b)
0.05043429 0.04212571 Standard deviation of slope (Sb) 0.00071026 0.00037677
Intercept (a) 0.015905 0.005762
Standard deviation of intercept (Sa) 0.010752 0.005704 Standard error of estimation(Se) 0.014856 0.007881 Correlation coefficient (R2) 0.99920732 0.99968013 % Range of Error
(Confidence limits)*
0.05 level 0.015241 0.014131
0.01 level 0.020029 0.020110
% Error in bulk samples** 0.22 0.43
Validation of the Developed Method: Optical characteristics:
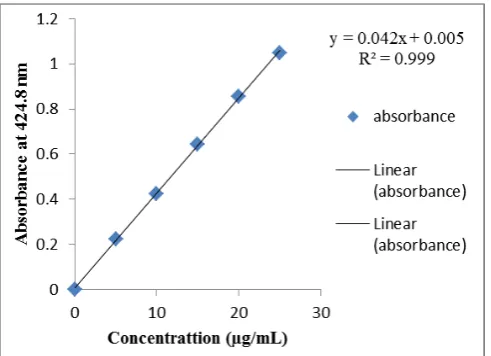
In order to check whether the coloured species formed in the developed methods adhered to beer’s law, the absorbance at suitable wavelengths of a set of solutions containing different amounts of Retigabine and specified amounts of reagents as described in the procedures for each method were noted against appropriate reagent blanks. The Beer’s law plots of these methods are recorded graphically in Fig. 4 and Fig. 5. Beer’s law limits, molar absorptivity, sandell’s sensitivity for Retigabine in each method developed with mentioned reagents. Least square regression analysis was carried out for getting the slope, intercept and correlation coefficient and the percent relative standard deviation and percent range of errors at 0.05 and 0.01 confidence limits were calculated for the proposed methods and are presented in Table 3.
Figure 3. Beer's law plot of Retigabine with NED
method M1
Figure 4. Beer's law plot of Retigabine with PDAB method M2
Accuracy (Recovery studies):
To determine the accuracy of the proposed methods, different amounts of bulk samples of Retigabine within the Beer’s law limits were taken and analyzed by the proposed methods. Recovery studies were conducted by analyzing each pharmaceutical formulation in the first instance for the active ingredient by the proposed methods. Three different amounts of pure drug was added to the previously analyzed formulations and the total amount of the drug was once again determined by all the proposed methods after bringing the active ingredient concentration within the Beer’s law limits. The results are presented in Table 4.
Table 4. Assay and recovery of Retigabine in dosage forms
Method Pharmaceutical Formulation Labelled Amount (mg)
Amount found* (mg) ±
S.D %recovery by proposed methods** ± S.D
Trobalt-I 50 49.99 ± 0.011 99.98 ±0.005 M1 Trobalt –II 100 99.05±0.005 99.05 ±0.010 Trobalt –III 200 199.98± 0.005 99.99 ± 0.012 Trobalt –I 50 49.98 ± 0.020 99.06 ± 0.013 M2 Trobalt –II 100 99.06 ± 0.006 99.08 ± 0.024 Trobalt –III 200 199.95 ± 0.021 99.86 ± 0.015 * Average ± standard deviation of six determinations. ** Average of six determinations
Table 5. Precision of Retigabine
Method Concentration (µg/mL) Intraday (% RSD) Interday (%RSD)
M1 15 0.105 0.115
M2 15 0.197 0.182
** Average of Six determinations
Precision:
The precision of each proposed visible spectrophotometric methods was ascertained separately from the absorbance values obtained by actual determination of six replicates of a fixed amount of Retigabine in total solution for methods M1, M2 are
presented in Table 5 respectively.
LOD and LOQ:
Table 6. LOD and LOQ values of Retigabine
Parameter M1 M2
Detection Limit (LOD) 0.703 µg/mL 0.446 µg/mL Quantitation Limit (LOQ) 2.131 µg/mL 1.353 µg/mL
Interference studies:
The effect of wide range of excipients and other additives which are generally present in the formulations for the assay of Retigabine in the estimation under optimum conditions were investigated separately. The commonly used excipients and other additives in the preparation of Retigabine tablet formulations were did not interfere with the determination of Retigabine by the proposed methods.
Analysis of formulations:
Eventually the developed methods applied for the determination of Retigabine in different pharmaceutical formulations to establish the
usefulness of the methods for checking the labeled amounts. Satisfactory results were obtained that the mean % found for Retigabine was in good agreement with the label claim.
Chemistry of the colored species: Method M1:
The chemistry involved in the formation of colored species is shown in Scheme 1.
Method M2:
The chemistry involved in the formation of colored species is shown in Scheme 2.
1) HCl
2) NaNO2
1) NH2SO3NH4
2) NED Reagent N
H F
H
N O
NH2
O N
H F
H
N O
N2Cl
O
N H F
H
N O
N2Cl O
N H F
H
N O
N N
NH NH2
O
Retigabine Diazonium salt of retigabine
Diazonium salt of retigabine
Azo dye complex Scheme 1: Reaction of Retigabine with BM reagent.
N(CH3)2
CHO H
-H2O
H
N O
N O
CH
N(CH3)2
H
N O
NH O
CH
N(CH3)2
N H F
H
N O
NH2
O
Retigabine
N H F
NH
F PDAB
Shiff's base
Sulphuric acid Protonation
Colored shiff's base (protonated hydrazone).
CONCLUSION
The current study described, for the first time, the successful determination of Retigabine in its dosage forms by N-(1-napthyl) ethylene diamine dihydrochloride (NED), p-dimethyl amino benzaldehyde (PDAB), as analytical reagents for the development of rapid, simple, precise colorimetric method. The developed method has many advantages such as time taken for preparation of standard and sample solutions is less; it does not need expense and sophisticated instruments. The developed method is specific when estimating the tablet dosage forms without interference of additives and other excipients. Finally, it can be concluded that the developed method for Retigabine was found to be simple, precise, accurate, cost effective and reliable and it can be effectively applied for routine analysis in quality control laboratories for determination of Retigabine in bulk and pharmaceutical formulations.
Acknowledgements
The authors would like to thank Hetero Labs for providing the gift sample of Retigabine. We are highly grateful to Dr. L. Rathaiah, Honorable Chairman, Vignan group of institutions, Vadlamudi, Guntur and also Dr. P. Srinivasa Babu, Principal, Vignan Pharmacy College, Vadlamudi, Guntur for providing the necessary facilities to carry out this research work.
REFERENCES
1. Plosker GL, Scott LJ. (2006). Retigabine: in partial seizures. CNS Drugs. 20:601-608.
2. Porter RJ, Partiot A, Sachdeo R, et al (2007). Randomized multicenter dose-ranging trial of Retigabine for partial-onset seizures, Journal of Neurology. 68:1197-204.
3. Weisenberg JL, and Wong M. (2011). Profile of ezogabine (retigabine) and its potential as an adjunctive treatment for patients with partial-onset seizures. Neuropsychiatric Disease and Treatment. 7:409-414.
4. Luszczki JJ. (2009). Third-generation antiepileptic drugs: mechanisms of action, pharmacokinetics and interactions. Pharmacology Reports. 61:197–216.
5. Brown DA, Passmore GM. (2009). Neural KCNQ (Kv7) channels. British Journal of Pharmacology. 156:1185-1195. 6. Rogawski MA, Bazil CW. (2008). New Molecular Targets for
Antiepileptic Drugs: α2δ, SV2A, and Kv7/KCNQ/M Potassium
Channels. Current Neurology and Neuroscience Reports. 8:345-52.
7. Main MJ, Cryan JE, Dupere JR, et al (2000). Modulation of KCNQ2/3 potassium channels by the novel anticonvulsant Retigabine, Journal of Molecular Pharmacology. 58:253-262. 8. Rundfeldt C. (1997). The new anticonvulsant retigabine
(D-23129) acts as an opener of K+ channels in neuronal cells, European Journal of Pharmacology, 336:243–249.
9. Martin Gunthorpe J, Charles Large H, and Raman Sankar. (2012). The mechanism of action of retigabine (ezogabine) a first in -class K+ channel opener for the treatment of epilepsy. Journal of Epilepsia. 53:412-424.
10. Rogawski MA. (2008). Diverse Mechanisms of Antiepileptic Drugs in the Development Pipeline. Epilepsy Research. 69:273–94.
11. Ferron GM, Paul J, and Fruncillo R. (2002). Multiple-dose linear dose-proportional pharmacokinetics of retigabine in healthy volunteers. Journal of Clinical Pharmacology. 42:175-82.
12. Blackburn-Munro G, Dalby-Brown W, Mirza NR, et al (2005). Retigabine: chemical synthesis to clinical application. CNS Drug Rev. 11:1-20.
13. Hempel R, Schupke H, McNeilly PJ, et al, Metabolism of retigabine (D-23129). (1999). a novel anticonvulsant. Drug Metab Dispos. 27:613-622.
14. Lakshmi B, Saraswathi K, Reddy TV. (2012). RP-HPLC method development and validation for the analysis of Ezogabine in pharmaceutical dosage forms. 1:7-14.
15. ICH Q2 (R1). (2005). Validation of analytical procedures, Text and methodology, International Conference on Harmonization, Geneva. pp. 1-17.
*****
© 2014; AIZEON Publishers; All Rights Reserved