Correlations of Biomechanical Characteristics with Ball Speed in Penalty Corner Push-In
Effect of Strength, Endurance and Concurrent Training on Left Hand Grip Strength and Right
Hand Grip Strength of College Students
Dr.M. Elayaraja
Associate Professor, Department of Physical Education and Sports, Pondicherry University, Puducherry, India.
Received 12th October 2016, Accepted 12th November 2016
Abstract
The purpose of this study was to analyze the effect of strength, endurance and concurrent training on left hand grip strength and right hand grip strength of college students. Sixty (N=60) male students were randomly selected from Indira Gandhi college of arts and science, Puducherry. Their age ranged from 18 to 25 years. The subjects were divided into four equal groups; first experimental group (A) second experimental group (B) third experimental group (C)and forth control group (D) each consisting of 15 subjects. The experimental group underwent strength, endurance and concurrent training for the duration of twelve weeks and control group did not participated in any training. The data collected before and after the training programme. Analysis of Co-variance (ANCOVA) was applied to find out the significance difference between the groups.
Keywords: Strength, Endurance, concurrent, Left hand grip strength, Right hand grip strength.
© Copy Right, IJRRAS, 2016. All Rights Reserved.
Introduction
The World Health Organization laments that the major health problem in India is obesity. Besides, lack of physical activity latently contributes to serious health problems in the world. Moreover, the food culture and way of living affect the health conditions of the people at large in the world. As a result, there is a need for health precautions and fitness in Indian society. Apart from that, there are various health issues that are on the rise in India as well as in the other parts of the world. Research in the field of health-related variables will be highly useful for the society. Therefore, I have selected the health-related physical variables of Left hand grip strength and Right hand grip strength. Regular physical activity is necessary for maintaining normal muscle strength along with joint structure and function. Physical activity, within the recommended range, is not associated with joint damage or osteoarthritis and has been found to be beneficial for many people with arthritis by helping in reducing pain and stiffness and hence promoting greater mobility. Joint swelling caused by arthritis may be controlled by regular exercise (Hughes et al., 2004).
Weight-bearing physical activity is essential for normal skeletal development during childhood and adolescence and for achieving and maintaining peak bone mass in young adults. Strength training and other exercises in older adults have been found to preserve the
Correspondence Dr.M.Elayaraja
E-mail: elaya.cricket@gmail.com, Ph. +9194889 79000
abilities to maintain independent living and reduce the risk of falling. Increase in bone mineral content has been found to increase with moderate exercise, particularly if the diet is supplemented with calcium (Beck and Snow, 2003). Sports training are a systematic process extending over a long period. For best results, the system of training has to be based and conducted on scientific facts and lines. Where it is not possible to do that, the training has to be based on the results of effective practice that has withstood the test of time. Sports science has still not been able to provide a systematic base for all the aspects and basics of training. Numerous things are still based on the effects of successful practice, which on deeper analysis is also a method of science to prove or disprove a philosophy. Furthermore, the principal characteristic of a science is the existence of a systematized body of knowledge. The science of sports training has its own systematized body of knowledge and hence is a science in itself (Hardayal Singh, 1991).
Strength training is the use of resistance to muscular contraction to shape the strength, anaerobic endurance and bulk of skeletal muscles. There are several methods of strength training, the most common being the use of gravity or elastic/hydraulic forces to oppose muscle contraction. The terms “strength training” and “resistance training” are frequently used interchangeably. Endurance activities have been found to be of high value for maintenance of organic health for increasing the general resistance against infections and for use of treatment of various diseases and metabolic disorders. No other motor activity depends so much on the working capacity of the complete psychophysical
International
apparatus of humans as endurance. In sports, endurance ensures optimum speed of motor actions. Upright endurance create high quality of skill movement execution which finds expression in accuracy, precision, rhythm, consistency, etc.
Working on strength and endurance at the same time, whether it be in the same session, other days, alternate sessions, etc., countless numbers of recreation workout enthusiasts complete their strength and endurance training workouts during the same training session or within hours of one another. Many people, athletes and non-athletes, participate in a combination of resistance and endurance training. These people are expecting to experience the benefits that these two different types of training have to offer. A number of studies have exposed that performance of these two types of training simultaneously can be detrimental to the gains that might be made in performing one type of training alone (Bell et al., 2000).
Results
Selection of subjects
The universe of the study was 322 men from Indira Gandhi College of Arts and Science, Puducherry. Of these, 150 male students were drawn as samples for the present study using a simple random sampling method. They underwent a screening for BMI, and from them, 60 samples in the age group of 18–25 years were selected.
Sample Design
The selected 60 subjects were randomly divided into four groups: Experimental group I underwent strength training, Experimental group II underwent endurance training and Experimental group III underwent concurrent training. Group IV acted as the control group, who did not participate in any specific training programme. The duration of the training programme was 12 weeks.
Table I. Analysis of covariance for left hand grip strength of the strength training, endurance training, concurrent training and control groups
*Significant at 0.05 level.
The required table value at 0.05 level of significance for 3 & 56, 3 & 55 degrees of freedom is 2.77.
It is observed from Table I that the pre-test means of left hand grip strength of the strength training, endurance training, concurrent training and control groups are 17.20, 17.40, 17.27 and 17.07, respectively. The obtained “F” ratio 0.18 for the pre-test means is
lesser than the required table value 2.77 for 3 & 56 degrees of freedom at 0.05 level of significance. The post-test means of left hand grip strength of the strength training, endurance training, concurrent training and control groups are 23.60, 18.13, 21.13 and 17.00, respectively. The obtained “F” ratio 102.41 for the
post-test data is greater than the required table value at 0.05 level of significance. The adjusted post-test means of left hand grip strength of the strength training, endurance training, concurrent training and control groups are 23.61, 18.07, 21.12 and 17.06, respectively. The obtained “F” ratio 123.09 for the post-test data is greater than the
required table value 2.77 for 3 & 56 degrees of freedom at 0.05 level of significance. It reveals that there is a significant change in left hand grip strength as a result of experimental training.
Strength Training Group
Endurance Training
Group
Concurrent Training
Group
Control Group
Source of Variance
Sum of Squares
Df Mean
Square
“F”
Ratio
Pre-test
Mean 17.20 17.40 17.27 17.07 B 0.87 3 0.29 0.18
SD 1.21 1.12 1.22 1.49 W 89.87 56 1.60
Post-test Mean
SD
23.60 18.13 21.13 17.00 B 400.87 3 133.62 102.41*
1.121 1.060 1.245 1.133 W 73.067 56 1.305
Adjusted Post-test Mean
23.61 18.07 21.12 17.06 B 399.74 3 133.25 123.09*
Table II. Scheffe’s post hoc test to measure ordered adjusted left hand grip strength means between experimental and control groups
Strength Training Group
Endurance Training
Group
Concurrent Training
Group
Control Group Mean
Difference CV
23.61 18.07 5.54*
1.09
23.61 21.01 2.60*
23.61 17.06 6.54*
18.07 21.01 2.94*
18.07 17.06 1.01
21.01 17.06 3.95*
Table II shows Scheffe’s post hoc method for testing the significance of the differences between the paired means following analysis of covariance for the strength training, endurance training, concurrent training and control groups. The strength training group (adj. mean = 23.61) significantly outperformed the endurance training group (adj. mean = 18.07) and the concurrent training group (adj. mean = 21.01) in left hand grip strength with adjusted mean differences of 5.54 and 2.60 (CV = 1.09), respectively. The concurrent training group (adj. mean = 21.01) significantly outperformed the
endurance training group (adj. mean = 18.07) in left hand grip strength with an adjusted mean difference of 2.94 (CV = 1.09). Also, the experimental groups namely the strength and concurrent training groups significantly outperformed the control group (adj. mean = 17.06) in left hand grip strength with adjusted mean differences of 6.54 and 3.95 (CV = 1.09), respectively. However, there was no significant difference in left hand grip strength between the endurance training and control groups with an adjusted mean difference of 1.01 (CV = 1.09).
Figure I. Line diagram showing the mean values of left hand grip strength of the strength training, endurance training, concurrent training and control groups
16 17 18 19 20 21 22 23 24 25
Pre Test Post Test Adj. Post Test
Units - Kilograms
Strength Training Group Endurance Training Group
Table III. Analysis of covariance for right hand grip strength of the strength training, endurance training, concurrent training and control groups
*Significant at 0.05 level.
The required table value at 0.05 level of significance for 3 & 56, 3 & 55 degrees of freedom is 2.77.
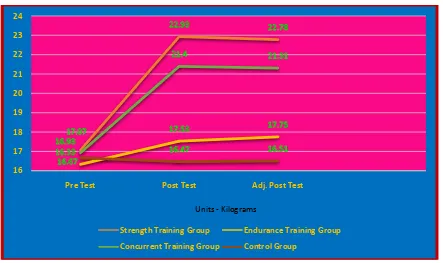
It is observed from Table III that the pre-test means of right hand grip strength of the strength training, endurance training, concurrent training and control groups are 17.07, 16.33, 16.93 and 16.67, respectively. The obtained “F” ratio 1.32 for the pre-test means is
lesser than the required table value 2.77 for 3 & 56 degrees of freedom at 0.05 level of significance. The post-test means of right hand grip strength of the strength training, endurance training, concurrent training and control groups are 22.93, 17.53, 21.40 and 16.47, respectively. The obtained “F” ratio 78.07 for the
post-test data is greater than the required table value at 0.05 level of significance. The adjusted post-test means of right hand grip strength of the strength training, endurance training, concurrent training and control groups are 22.78, 17.75, 21.31 and 16.51, respectively. The obtained “F” ratio 80.67 for the post-test data is
greater than the required table value 2.77 for 3 & 56 degrees of freedom at 0.05 level of significance. It reveals that there is a significant change in right hand grip strength as a result of experimental training.
Table IV. Scheffe’s post hoc test to measure ordered adjusted right hand grip strength means between the experimental and control groups
Strength Training Group
Endurance Training Group
Concurrent Training
Group
Control Group
Mean
Difference CV
22.78 17.75 -- -- 5.03*
1.41
22.78 -- 21.31 -- 1.47*
22.78 -- -- 16.51 6.27*
-- 17.75 21.31 -- 3.56*
-- 17.75 -- 16.51 1.23
-- -- 21.31 16.51 4.80*
Table IV shows Scheffe’s post hoc method for testing the significance of the differences between the paired means following analysis of covariance for the strength training, endurance training, concurrent training and control groups. The strength training group (adj. mean = 22.78) significantly outperformed the endurance training group (adj. mean = 17.75) and the concurrent
training group (adj. mean = 21.31) in right hand grip strength with adjusted mean differences of 5.03 and 1.47 (CV = 1.41), respectively. The concurrent training group (adj. mean = 21.31) significantly outperformed the endurance training group (adj. mean = 17.75) in right hand grip strength with an adjusted mean difference of 3.56 (CV = 1.41). Also, the experimental groups namely Strength
Training Group
Endurance Training
Group
Concurrent Training
Group
Control Group
Source of Variance
Sum of Squares
Df Mean
Square “F”
Ratio
Pre-test
Mean 17.07 16.33 16.93 16.67 B 4.72 3 1.57 1.32
SD 1.10 1.11 1.03 1.11 W 66.53 56 1.19
Post-test
Mean 22.93 17.53 21.40 16.47 B 426.58 3 142.19 78.07*
SD 1.33 1.35 1.35 1.35 W 102.00 56 1.82
Adjusted Post-test
Mean 22.78 17.75 21.31 16.51
B 371.84 3 123.94
80.67*
the strength and concurrent training groups significantly outperformed the control group (adj. mean = 16.51) in right hand grip strength with adjusted mean differences of 6.27 and 4.80 (CV = 1.41), respectively. However,
there was no significant difference in right hand grip strength between the endurance training and control groups with an adjusted mean difference of 1.23 (CV = 1.41).
Figure II. Line diagram showing the mean values of right hand grip strength of the strength training, endurance training, concurrent training and control groups
The findings of this study bring to light hand grip strength significantly improved in the strength and concurrent training groups than in the control group. The strength training group showed better improvement in hand grip strength and the next highest score was for the concurrent training group after the 12 weeks of training. There was no significant difference in hand grip strength between the endurance and control groups (Glowacki et al., 2004; Leveritt et al., 2003; Bell et al., 1991; Hakkinen et al., 2003).
Conclusions
From the results obtained from the analyses and interpretations of the data, the following conclusions were drawn.
1. Strength training resulted in a significant improvement in the participants’ hand grip strength than endurance training, concurrent training and control group.
2. The concurrent training group have significant improvement in hand grip strength than endurance training and control group.
3. There is no significant difference between endurance training andcontrol group in hand grip strength.
References
1. Beck, B. R., & Snow, C. M. (2003). Bone Health across the Life Span: Exercising Our Options.
Exercise Sport Science Review,31(3), 117-112. 2. Bell G. J., Petersen S. R., Wessel J., Bagnal K.,
&Quinney H. A. (1991). Physiological Adaptations to Concurrent Endurance Training and Low Velocity Resistance Training. International Journal of Sports Medicine,12(4), 384-90.
3. Bell, G. J., Syrotuik, D., Martin, T. P., Burnham, R., &Quinney, H. A. (2000). Effect of Concurrent Strength and Endurance Training on Skeletal Muscle Properties and Hormone Concentrations in Humans. European Journal of Applied Physiology,81(5), 418-427.
4. Glowacki, S. P., Martin, S. E., Maurer, A., Baek, W., Green, J. S, & Crouse, S. F. (2004). Effects of Resistance, Endurance, and Concurrent Exercise on Training Outcomes in Men. Medicine and Science in Sports and Exercise, 36(12), 2119-2127.
5. Hakkinen, K., Alen, M., Kraemer, W. J., Gorostiaga, E., Izquierdo, M., Rusko, H., Mikkola, J., Häkkinen, A., Valkeinen, H., Kaarakainen, E., Romu, S., Erola, V., Ahtiainen, J., &Paavolainen, L. (2003). Neuromuscular Adaptations during Concurrent Strength and Endurance Training 16
17 18 19 20 21 22 23 24
Pre Test Post Test Adj. Post Test
Units - Kilograms
Strength Training Group Endurance Training Group
Versus Strength Training. European Journal of Applied Physiology, 1, 42-52.
6. Hardayal, Singh. (1991). Science of Sports Training. New Delhi, India: D.V.S. Publication, pp.13.
7. Hughes, S. L., Seymour, R. B., Campbell, R., Pollak, N., Huber, G., & Sharma, L. (2004). Impact
of the Fit and Strong Intervention on Older Adults with Osteoarthritis. Gerontologist,44(2), 217-228. 8. Leveritt, M., Abernethy, P. J., Barry B. K., &