ISSN: 2334-2986 (Print), 2334-2994 (Online) Copyright © The Author(s). All Rights Reserved. Published by American Research Institute for Policy Development DOI: 10.15640/jea.v3n1a7 URL: http://dx.doi.org/10.15640/jea.v3n1a7
On the Impact of Simplificationson Building Energy Simulation for Early Stage
Building Design
Marco Picco
1& Marco Marengo
2Abstract
The present paper stems from the benefits of the application of energy analysis in the early-stage building design combined with the difficulties that prevent this integration. The most common solution is to simplify the building energy model, although not enough attention is paid to understand the consequences of this action. The paper focuses on evaluating the impact of various building model simplifications on the outputs of the dynamic energy simulations. Three different case studies, featuring large non-residential buildings, are discussed in this paper. Differences in results are discussed in term of total heating and cooling energy loads for each simplification. Lastly the total differences between a fully simplified model and the corresponding detailed models are discussed more in detail.
Keywords: Energy performance simulation; Early stage design; Simplified model; Energy Plus
Introduction
The building energy problem concerns all the advanced countries in different ways, not only in terms of air pollution or emissions but also in regards to the preservation of energy sources and the rational use of energy itself. According to reports from the U.S. Department of Energy, buildings are responsible for a relevant portion of total yearly energy consumptions and greenhouse gas emissions, ranging from 40% to 50% (Chen, 2009), and Europe shows similar results (Economidou, 2011). As a result, various national and supranational initiatives and regulations, and various programs are flourishing in the private sector, such as LEED, CASBEE and others; defining standards and parameters to evaluate the level of sustainability of buildings and reduce their energy use, both voluntary and mandatory. The framework, knowledge, materials and systems to achieve high levels of energy efficiency in buildings and strongly reduce energy consumptions are readily available and can make a positive impact, but they need to be properly implemented from design to construction and operation of buildings. A possible solution to incorporate all these elements in the building sector is the implementation of the “Integrated Building Design” approach, or more in general Integrated Design Process (IDP); shifting design decisions upstream in the project’s process, when the occasion to influence positive outcomes is maximised and the cost of changes minimised (Aziz, 2011).In this context, the use of building energy simulation could provide invaluable help to the IDP, providing information otherwise unavailable. Building performance simulations can help in reducing emission of greenhouse gasses and in providing substantial improvements in fuel consumption and comfort levels, by treating buildings and their thermal systems as complete optimized entities, and not as the sum of a number of separately designed and optimized sub-systems or components (Hensen, 2004).
1Marco Picco, Dept. of Engineering and Applied Science, Università degli studi di Bergamo, viale Marconi 5, I-24044 Dalmine (BG), Italy,
School of Environment & Technology, University of Brighton, Lewes Road, Cockcroft Bld., Brighton BN2 4GJ, UK. Phone: +39 035 205 2002, email: [email protected]
2
Many existing energy simulation tools for buildings are very sophisticated and promise a high level of accuracy. Popular tools such as Energy Plus and DOE-2 are quite effective at simulating final building designs and are typically used for demonstrating compliance with performance standards such as LEED. However, despite the proliferation of many building energy analysis tools in the last ten years, architects and designers are still finding difficult to use even basic tools (Punjabi et al., 2005). Findings confirm that most Building Performance Simulation tools are not compatible with architects’ working methods and needs (Van Dijk et al., 2002; Gratia et al., 2002). Accurate energy analysis requires time, up to several weeks in more complex cases, and the more accurate the analysis must be the more time it will require. This is in contrast with the necessity to minimize the time requirements of the analysis so that it can be compatible with IDP times, but to do so simplifications of the building model and simulation tool are needed, with the drawback of a loss in accuracy. It is therefore essential to devote some research effort in trying to quantify the effects of simplifications applied in simulation practice to evaluate if and when those assumptions can be considered acceptable, and eventually to identify possible solutions to minimize the differences obtained between detailed and simplified models of the same building.
Simplification Methodology and Case Studies
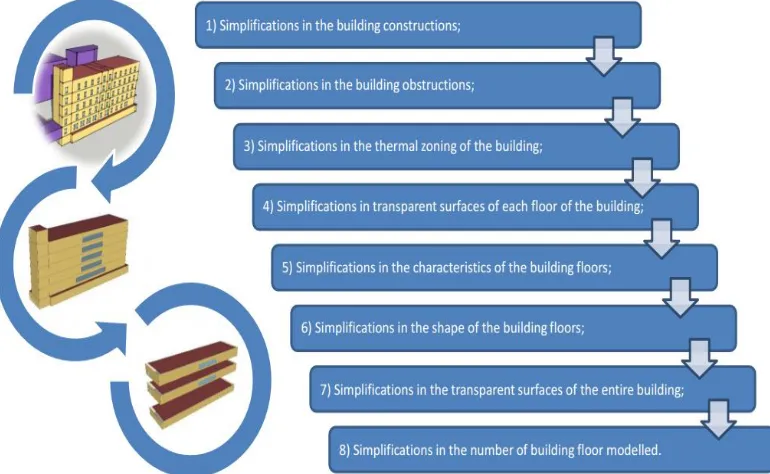
To evaluate the impact of simplifications on simulation results in building model description a simplification protocol has been developed (Picco et al., 2014). The objective of this protocol is to identify a number of simplification steps each linked to a specific set of information required in the simulation process. Separating the single simplifications into steps allows an evaluation of each simplification impact, even with the known issue of the nonlinear superposition of their effects. The simplification protocol is defined including, primarily, all the most common simplifications used during the practical application of dynamic energy simulation in order to give useful information about their impact on the simulation results and at the same time trying to suggest specific implementation to minimize them. The protocol then continues toward heavier and less commonly implemented simplifications up to an extremely simplified model of the building representative of a simulation model deployable during early design stages based only on information, at least in some form, already available at each design stage and easily obtainable. The simplification consists of eight different simplification steps, each one considering different aspects of the building model description, as shown in Figure 1.
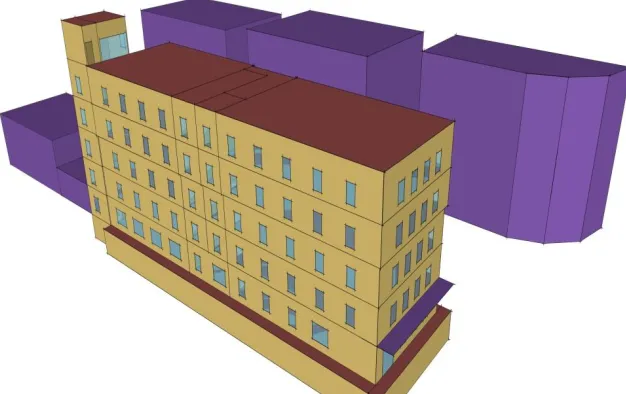
The simplification protocol in all of its steps and its application to the description model is further detailed in previously published papers (Picco et al., 2014). To evaluate the impact of those simplifications on simulation results three case studies are presented in this paper. The results of one of the case studies (CS1) are already discussed in a previous paper, while the extension of the analyses to two new case studies allows for a more comprehensive discussion and generalization of the results. For the purpose of this work, the analyses are focused around large non-residential buildings, as they are considered the ones that could benefit the most from early integration of energy simulation in the design process. Based on those conditions the buildings that represent the case studies are chosen with, as much as possible, different energy performances and occupational behaviours to evaluate if those aspects have an effect on the impact of simplifications. An office building, identified hereinafter as CS1 (Ex-Post), represents the first case study analysed (Figure 2), the structure was originally built in 1954 and fully renovated in 2007. During the renovations two storeys were added to the existing three and major improvements to the energy efficiency of the building were added, resulting in a highly insulated structure with a 35 cm EPS shell (thermal transmittance of 0.08 W/m2K for external walls) and 3-pane type windows, achieving Klimahaus Gold certification for passive buildings.
Being an office building the structure is characterized by a uniform distribution in term of internal loads, usage and HVAC parameters both on the single floor plan and for the elevation of the building. The shape of the building is also sufficiently uniform in term of floor plan switching from floor to floor.
Figure 2: Ex-Post - Overall view of the Detailed Model
The second case study is a private clinic (Figure 3), identified hereinafter as CS2 (Castelli Clinic), built in 1933 and further expanded in various steps between 1940 and 1970. Due to the age of the building and the nature of the expansions, the structure is characterized by a low level of energy efficiency, with a complete absence of insulation layers in the walls (e.g. thermal transmittance of 1.3-2.1 W/m2K for external walls) and low thermal resistance
Figure 3: Castelli Clinic – Overall View of the Detailed Model
Third and last case study is a recently built Bingo hall with complementary functions like betting and slot machine rooms (Figure 4), identified hereinafter as CS3 (GechBingo). The structure was built in 2010, and therefore complies with current regulations in Italy, granting an adequate level of insulation (e.g.thermal transmittance of 0.363 W/m2K for external walls) and thermal efficiency. The building has one conditioned floor, with only technical spaces
on the second floor and an indoor parking lot in the underground, but presents a strong lack of uniformity in term of internal loads and HVAC parameters, especially in term of ventilation air volumes, moving from room to room of the conditioned floor.
Figure 4: Gech Bingo - Overall view of the Detailed Model
For the purpose of this study a model is deemed adequately detailed if able to represent the thermal characteristics and behaviour of the real buildings therefore producing useful results. Each model was then associated to three different HVAC system representations to evaluate the impact of simulation results based on the system hypothesis.
The three system hypotheses are summarized as:
An “Ideal loads” air system, which represents the simplest system possible and operates by ideally adding or removing thermal energy from the air balance of the zones;
A “Unitary” system in which each single zone is provided with a separate conditioning system comprised of an AHU with direct expansion electric cooling coil and gas heating coil;
A more detailed system based on the real HVAC system of the building, defining a variable air volume (VAV) system for CS1and a “Fan-coil” air system, in which conditioning is achieved with recirculating fan-coil units powered by natural gas boilers and electrical chiller for CS2 and CS3.
The combination of the three building models with the three different system representations creates nine detailed building models; to each of those the abovementioned simplification process is then applied to evaluate the impact of each simplification step on the alteration of the simulation results. Those simplification steps need to be implemented progressively as some of the later steps require other simplifications to be already implemented. To successfully compare the results obtained by the various simplification steps to the ones of the corresponding detailed models, a number of relevant parameters of comparison are identified. This paper aims to obtain detailed results for two of those comparison parameters: the annual energy heating/cooling loads of the building. Results in term of Peak load request for heating and cooling are also briefly discussed in the next chapter only in relation to the total differences generated by the fully simplified model (i.e. the model resulting after the application of the last simplification step).
Results
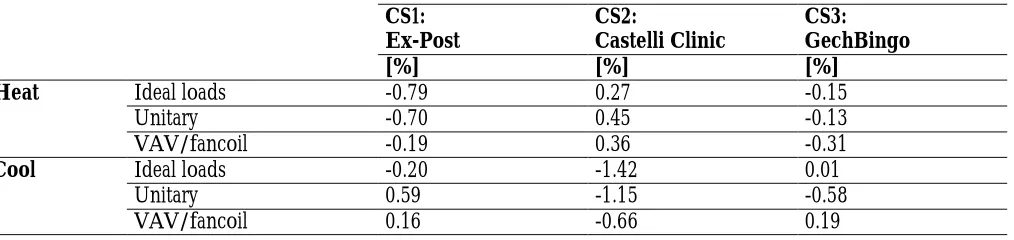
Simulation results following the various simplifications are here presented for all the case studies, discussing the entity of the differences introduced by the simplifications, and trying to generalise their impact based on the different case studies. Firstly the discussion will focus on “step-by-step” differences, analysing the variation in the outputs from one simplification step to the next, isolating the effect of the various simplifications, lastly the total variation between detailed model and fully simplified model are discussed. Starting from the detailed models of the case studies each simplification is applied progressively and for each step, results in term of differences compared to the previous step are reported and commented in detail. Table I shows all the results related to simplification Step 01, which concerns the simplification in the definition of building construction, going from a detailed description of each construction to only six construction types.
Table I: Step-by-Step Differences Overview in Heating and Cooling Total Loads for Step 01
CS1: Ex-Post
CS2:
Castelli Clinic
CS3: GechBingo
[%] [%] [%]
Heat Ideal loads -0.79 0.27 -0.15
Unitary -0.70 0.45 -0.13
VAV/fancoil -0.19 0.36 -0.31
Cool Ideal loads -0.20 -1.42 0.01
Unitary 0.59 -1.15 -0.58
VAV/fancoil 0.16 -0.66 0.19
In light of the results of this analysis, simplifications on the constructions detail could be easily applied with minor impact on the results significantly decreasing the effort and time needed to perform energy simulations. This also helps the integration of energy simulation during early stages building design as, generally, detailed constructions and their exact distribution on the building envelope are typically unknown and only generic target construction information is available.
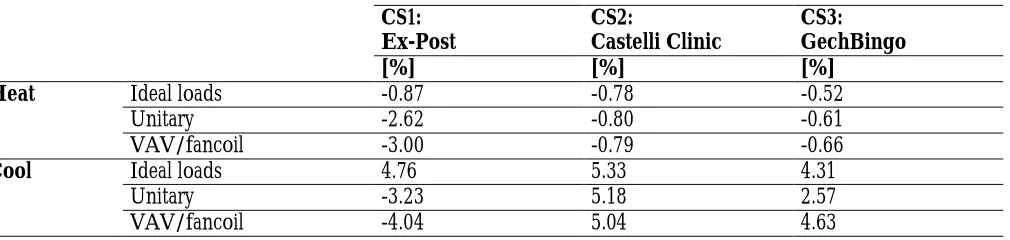
Table II: Step-by-Step Differences Overview in Heating and Cooling Total Loads for Step 02
CS1: Ex-Post
CS2:
Castelli Clinic
CS3: GechBingo
[%] [%] [%]
Heat Ideal loads -0.87 -0.78 -0.52
Unitary -2.62 -0.80 -0.61
VAV/fancoil -3.00 -0.79 -0.66
Cool Ideal loads 4.76 5.33 4.31
Unitary -3.23 5.18 2.57
VAV/fancoil -4.04 5.04 4.63
Table II shows the results of the analyses for the various case studies for simplification Step 02, removing external obstructions. As expected variations in results generated by this simplification are strongly different depending the load considered. Heating loads are influenced by this simplification only lightly, with differences normally under 1% and only for CS1 up to around 3% under two system hypothesis; reason for this is the highly insulated envelope of the building, lowering the losses and increasing the effect of secondary gains such as solar radiation. Cooling loads, on the other hand, are influenced by this simplification for a significant amount, with differences ranging around 4% to 5% for the majority of cases. This is expected, as solar gains are typically a more relevant issue during the cooling season as experience shows. During energy simulation, the description of external obstruction is often overlooked as deemed of marginal importance for the results of the analyses. Results of this study shows how this assumption could be considered valid if the focus of the simulation is the heating season, while the differences become more relevant for cooling loads. Impact of this simplification on cooling loads results is such as to require a justification, in the eventuality of it being applied, but is still acceptable if the application of energy simulation to early stage building designs requires it due to the lack of available information or time to perform more detailed simulations. A summary of the results of simplification Step 03 can be seen in Table III, below. Step 03 is characterized by the representation of each single floor with only one thermal zone inside the model.
Table III: Step-by-Step Differences Overview in Heating and Cooling Total Loads for Step 03
CS1: Ex-Post
CS2:
Castelli Clinic
CS3: Gech Bingo
[%] [%] [%]
Heat Ideal loads 6.16 0.86 -5.11
Unitary -4.98 1.67 -8.94
VAV/fancoil -5.79 0.97 -12.88
Cool Ideal loads 7.62 6.25 -12.00
Unitary -5.81 5.58 -20.80
VAV/fancoil -5.62 5.44 -9.33
The reason behind this is that modelling each floor with one thermal zone imposes the solution of only one thermal balance, “diluting” the effect of thermal gains and losses and neglecting the effect of extreme local conditions. This is more evident during cooling season as thermal losses or gains through the envelope are less relevant and internal and solar gains become more significant. Interesting is also how CS2 presents lesser percentage differences in results compared to the other case studies. This is due to being characterized by larger thermal zones also in the detailed model, as internal properties of the premises, such as occupation and internal gains, are less variable on the floor plan. The definition of thermal zones is entirely up to the modeller performing the energy analysis, and is often directly correlated to the model detail. Experience always recommends a careful evaluation of the thermal zoning of the building as one of the most important phases of modelling. Nonetheless, modellers often arbitrarily choose the number of thermal zones used to describe the building in function of what can be called “the level of detail of the model” independently from the available information and the time requirements. This often brings to the creation of building models with only one zone per floor used for detailed simulation without carefully considering the consequences. Results of this analysis shows how thermal zoning is an essential element of any useful energy simulation and needs to be carefully evaluated to ensure helpful results. Strong simplifications such as this could still be needed during early stage building design due to the lack of the information needed to increase the number of thermal zones in the model. Table IV shows the summary of results relative to simplification Step 04, i.e. the description of fenestrations with one single surface for relative cardinal direction for each floor.This simplification step impact on simulation results can be considered marginal in term of total heating loads, with variation of under 1% for case studies 2 and 3 and only slightly above 1% for CS1. In term of cooling loads the differences are still normally below 1%, with the exception of CS3 Unitary system hypothesis showing a 4.3% difference and the results associated with CS2 with all differences of around 2%.
Table IV: Step-by-Step Differences Overview in Heating and Cooling Total Loads for Step 04
CS1: Ex-Post CS2: Castelli Clinic CS3: Gech Bingo [%] [%] [%]
Heat Ideal loads -1.26 -0.91 -0.04
Unitary -1.67 -0.89 0.49
VAV/fancoil -1.43 -0.89 0.23
Cool Ideal loads 0.39 2.43 0.54
Unitary -0.40 2.31 4.30
VAV/fancoil -0.18 2.35 -0.28
The greater differences in CS2 for cooling loads could be attributed to the more complex geometry of the building floor plan causing self-shadowing effects on the single fenestrations; while the greater impact in CS1 for heating loads is attributable to the lower energy needs of the building, increasing the impact in minor differences in percentage. This kind of simplification is typically not implemented in energy simulations, as modellers tend to alter the geometry of the building as little as possible. However, results of this analysis show how this kind of simplification has in fact a minor impact on simulation results, and could be easily applied in practice, greatly reducing the information needed to compile the model and significantly cutting the time needed. In addition to this, during early stage building design information needed to describe fenestrations in a detailed model are often unavailable, and only needing generic information such total transparent surface and mean height of the windows can be helpful in the integration of energy simulations in those stages.
Table V: Step-by-Step Differences Overview in Heating and Cooling Total Loads for Step 5
CS1: Ex-Post CS2: Castelli Clinic CS3: GechBingo [%] [%] [%]
Heat Ideal loads -2.61 -1.70 -1.84
Unitary -4.07 9.41 -1.34
VAV/fancoil -3.66 9.58 -2.02
Cool Ideal loads 0.04 -20.83 -0.10
Unitary 0.37 -28.42 0.05
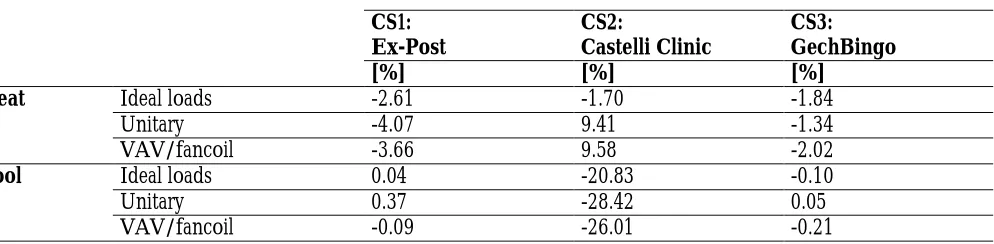
The standardization of floors, as implemented in simplification step 05, describing each floor of the building with similar inputs in term of geometry and characteristics, is summarized in term of analysis results in Table V. The impact of this simplification step is strongly dependant of the case study under consideration varying form 1.34% differences to 9.58% in regards to heating loads and from less than 1% to more than 28% for cooling loads. In term of heating loads CS1 and CS3 shows differences ranging from 1% to 4%, while CS2 results in variations around 9%. Those results are due to the strong variation in building occupation and internal gains of the various floors noticeable in CS2, and to the shape of the building as the last floor is characterized by a different floor plan. CS1 and CS3 buildings are instead characterized by a strong uniformity in their vertical development, mainly limiting the simplification outcome in the removal of accessory zones. Total cooling loads show similar results with CS1 and CS3 highlighting negligible effects of this simplification and CS2 showing a greater impact ranging from 20% to 28%, proving how cooling loads are more subject to variations due to normalization of internal gains, as already previously mentioned. This simplification step is typically avoided during energy simulation, due to its impact on the geometry description of the building, but similarly to simplification Step 03 is sometimes applied by modellers in term of zone characterization, such as internal loads and other parameters, sometime underestimating the impact of this simplification.
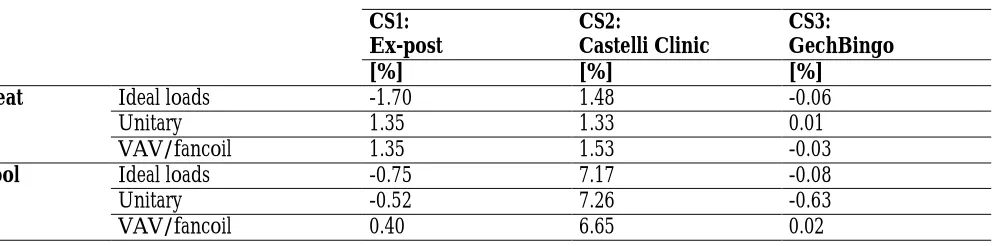
During early stage design some of the information needed to avoid this kind of simplification is often unavailable especially it term of internal gains and other zone parameters as the building design is not detailed enough. Geometrical definition of the zone floor is instead typically available, with the exception of initial stages of building design like the conceptual phase. It is therefore the modeller’s duty to carefully evaluate the advisability of the application of this simplification depending on the available information, the shape of the building and the objectives of the simulation in the light of the shown results. Table VI shows results of the analysis on simplification Step 06, the modelling of each zone with only six surfaces also called “zone squaring”. This simplification, if performed correctly, has minor impact on the evaluation of total heating loads, causing differences ranging from 0% to 1.7%.In term of total cooling loads, the differences attributable to the implementation of this simplification greatly differ from case to case.
Table VI: Step-by-step Differences Overview in Heating and Cooling Total Loads for Step 06
CS1: Ex-post
CS2:
Castelli Clinic
CS3: GechBingo
[%] [%] [%]
Heat Ideal loads -1.70 1.48 -0.06
Unitary 1.35 1.33 0.01
VAV/fancoil 1.35 1.53 -0.03
Cool Ideal loads -0.75 7.17 -0.08
Unitary -0.52 7.26 -0.63
VAV/fancoil 0.40 6.65 0.02
During traditional simulation this kind of simplification, as all the simplifications that strongly impact on the geometry of the model, is usually avoided by the modellers as considered too invasive in the model description with belief that it would have major impact on simulation results. The analyses shown above prove how this is not the case as, if done correctly, this simplification has minor impact in simulation results in term of both heating and cooling loads for sufficiently regular building shapes. The effect on results become relevant only for building with complex floor plans where self-shadowing has considerable effect, and even in this case only on cooling loads. This simplification could prove useful whenever a simulation must be delivered in short time and with few details on the building, as for example during early design phases, allowing to describe the building with a limited number of input data and showing only minor impact on the results. Results of the analyses performed on simplification Step 07, the standardization of fenestrations on different floors, are summarized in Table VII. The effects of this simplification step are negligible in term of total heating loads as all differences are below the 1% threshold except of one case at 1.07%. Differences on the estimation of total cooling loads are slightly higher up to 2.09%.
Table VII: Step-by-Step Differences Overview in Heating and Cooling Total Loads for Step 07
CS1: Ex-post
CS2:
Castelli Clinic
CS3: GechBingo
[%] [%] [%]
Heat Ideal loads -0.02 -0.07 0.00
Unitary 0.64 -0.05 0.00
VAV/fancoil 1.07 -0.08 0.00
Cool Ideal loads -1.96 1.02 0.00
Unitary 0.31 1.09 0.00
VAV/fancoil 2.09 1.14 0.00
CS3 shows 0% differences for this simplification step as the building is characterized by only one floor and therefore the simplification implemented with this step does not affect the simulation model. Differences generated by this simplification step are more relevant for CS1 compared to CS2 as the fenestration of ground floor of the Ex-Post building have significantly different surface area compared to the above floors, due to the different intended use of the ground floor. Instead, fenestration total surfaces of the Castelli Clinic are similar from floor to floor. It is also noticeable how differences on cooling loads are higher compared to heating loads as fenestration surface area directly impact the estimation of solar gains, one of the most relevant components of cooling season thermal balance. It is also possible to assume how differences in results associable to this simplification step are directly related to the non-uniformity of the fenestration area of the single floors of the building. It is therefore the duty of the modeller to consider the application of this simplification according to the uniformity of fenestrations of the building. Results of this analysis shows how, with a minor impact on simulation results, this simplification step could significantly reduce the number of input required to generate the simulation models facilitating the integration of energy simulation in building design.
Table VIII: Step-by-Step Differences Overview in Heating and Cooling Total Loads for Step 08
CS1: Expost
CS2:
Castelli Clinic
CS3: GechBingo
[%] [%] [%]
Heat Ideal loads -0.89 -1.23 0.00
Unitary -1.40 -0.20 0.00
VAV/fancoil -4.81 -0.66 0.00
Cool Ideal loads 2.71 2.19 0.00
Unitary 3.80 4.87 0.00
VAV/fancoil -7.86 9.26 0.00
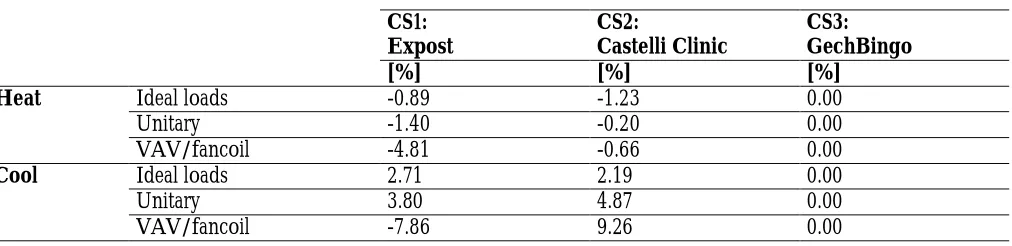
Differences in term of heating loads vary from less than 1% to 1.5% on all cases except for CS1 under the VAV system hypothesis with a difference of 4.81%. Cooling loads shows higher variations ranging from 2% to 9% mainly depending on system hypothesis with ideal loads showing the best results. It is interesting to notice how the more complex the modelled system is, the greater is the difference generated in results by this simplification step, showing better results under Ideal loads hypothesis and increasing in difference with Unitary system up to VAV and fan-coil systems. Reason for this behaviour is identified in the calculations applied to solving the system and plant balances, with Ideal loads simply covering the needs of the building directly without running a system simulation while more complex models needs an integrated system simulation interfacing with the thermal zones, therefore reducing the number of zones modelled directly impact the system simulation. This kind of simplification is is typically not used during energy simulation as it is most useful only in case of automated model generation, therefore energy modellers do not gain tangible advantages in its application. Similar simplifications are sometime applied in simulation of high-rise building, where the high number of floors would lead to the modelling of too many zones causing difficulties in the creation of the model and increasing simulation time. In those cases, one single floor is modelled and its results are then multiplied for the number of floors of the building, obtaining similar results to the ones illustrated in this simplification step.
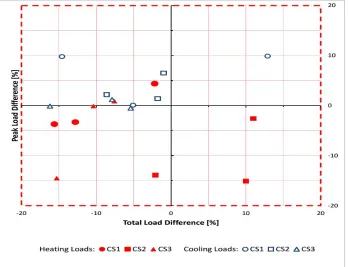
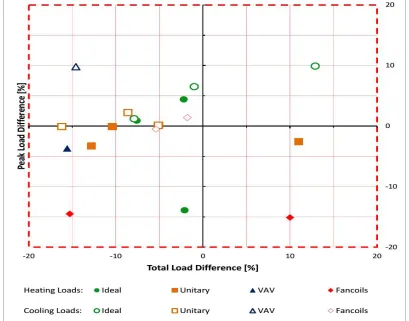
The application of this simplification step is only advisable for high-rise buildings, where the non-negligible differences in results are accepted due to the excessive number of zones that should be modelled otherwise, or for the implementation of automated model generation. This simplification is unrelated to the integration of simulation in early stage building design, and does not bring tangible advantages when manually creating building models if the number of floors is limited. After carefully evaluating the result of each simplification step in term of differences generated in the simulation results, it is possible to evaluate the performances of the simplification protocol as a whole, discussing the differences in simulation results between a detailed energy simulation model and a simplified model of the same building. Results of the simplification process applied to all the case studies analysed in this research are summarized in Figure 5, showing the percentage differences in term of total loads for the simulation on the x-axis of the chart and percentage differences in term of Peak power loads in the y-axis. Results are visible in term of heating or cooling loads depending on the colour of the indicator while its shape references the case study as shown in the attached chart.
As there is no available threshold, in literature or legislation, to determine if the results of the simplified model are acceptable, through the experience in the field of building design and energy simulation a practical margin of 20% is identified as a reference and considered an acceptable margin of difference between the results of a simplified and detailed model. As shown in the chart, results of the implementation of the simplified model on all the analysed case studies fall within the aforementioned margin of acceptability both in term of Total loads and Peak Power loads for heating and cooling needs. Another interesting, although qualitative, consideration that can be extrapolated by those results is how the simplified models tend to underestimate the heating Peak Power requirement of the buildings while overestimating the cooling Peak Power, with some exceptions. In term of total energy needs, on average, both heating and cooling loads tend to be underestimated by the simplified models compared to the detailed ones. This behaviour can be motivated with the ability of the detailed models to detect extreme conditions in selected thermal zones while the simplified model ignores them due to the limited number of modelled zones and associated internal gains. Results also show how differences in total loads are more scattered on the chart while differences in Peak Power are mainly centred in the range from -5% to +5%, showing smaller differences.
For the case studies analysed there seems to be no major deviation in total difference results as function of the analysed building. Ideal loads system and Unitary system hypothesis are applied to all case studies while Variable air Volume is only implemented in CS1 and fan-coil system is applied to case studies 2 and 3. Figure 6 shows the same results identified in term of system hypothesis as detailed in the attached chart. Form the chart it is possible to notice how, in term of total loads, the ideal loads system hypothesis seems to be the one showing fewer differences between simplified and detailed models. In term of peak power loads estimation the Unitary system hypothesis seems to give the best results with all cases inside the ±5% margin. Complex systems such as VAV and fan-coil system hypothesis, featuring modelled plant and air loops linked to distribution terminals in the zones, seem to show more varying results but always inside the 20% margin of tolerance.
Considering global difference results shown above in the light of step-by-step results reported previously, it is noticeable how the thermal zone definition is one of the most critical aspects in the definition of the building model in term of accuracy in the results. Simplification Steps 03 and 05 are the most relevant in this regard and both concern the number of thermal zones modelled. Contrarily to general belief, simplifications of the building geometry have a lesser impact on simulation results and, as shown in the analyses, are often acceptable even on complex buildings. It is possible to assume how the implementation of discussed simplifications shows best results on regular building, not so much in term of geometry but rather in term of internal gains distribution and local conditions, so to reduce the impact of modelling a limited number of zones.
Conclusions
Buildings are responsible for a tremendous amount of energy consumption due in part to their long lifetimes and continuous operation. Efficient design is critical, especially at the early stages – as poor decisions made early become difficult or impossible to correct. Dynamic energy simulation could significantly increase efficiency in design, especially during early design phases, however this integration is hindered by the complexity of simulations models and required detail. To overcome this obstacle, simplifications of the models are occasionally used. The results presented in this paper give a new insight of the impact on simulation results for different typical simplifications. As expected, different buildings perform differently under various simplifications; nonetheless, general conclusions can be drawn. A summary of the results is also provided in Figure 7. Some simplifications have a negligible impact in simulation results, as seen in Figure 7 like simplifications on constructions (step 01), fenestrations (step 04) and standardization of fenestrations (step 07).Other simplifications, like obstructions (step 02) and zone squaring (step 06), are negligible in term of heating loads but can have a noticeable effect on cooling loads as they mainly affect solar gain calculation, and their impact is stronger the more complex is the geometry of the models. The more relevant simplifications are the one concerning the number of zones modelled and characterized, zones per floor (step 03) and floor standardization (step 05), and are strongly dependant on the complexity of the modelled building, as shown by the various case studies. Simplification step08, number of modelled floors, becomes more relevant the more complex is the HVAC system modelled due to the implemented controls.
Figure 7: Summary of the impact on results of various simplification steps
In addition, simplifications seem always to have a greater impact on the estimation of cooling loads, compared to heating loads. In term of global differences between detailed model and fully simplified model, all the case studies here analysed results in differences never above 16.2% for total energy loads and 14.5%for peak power loads. Due to the lack and uncertainty in information provided during early design phases, differences within the practical margin of 20% between the simplified simulation and the detailed model can still be considered acceptable by the authors, meaning those models can still produce useful information to fuel the design process. It is therefore the duty of the simulation expert to form himself on the simplification topic and critically evaluate case by case the modelled buildings to understand if and when simplifications can be considered acceptable with the respect of the required outputs. This result brings the authors to conclude that all the investigated simplifications can result in limited deviations from the outputs of a detailed model. As practical thumb-rule, we may say that, using the simplification steps proposed in this paper and in Picco et al. (2014) at the beginning of building design, the simulations can be used for a good estimation of both heating and cooling needs and power required for energy efficiency and HVAC design, at least for non-residential buildings. Furthermore with all the simplifications active, the modelling and the simulation time are of the order of few hours, allowing the use of this protocol for the energy simulation of building in early-stage design.
References
Aziz, Z., 2011. Integrated Design and Delivery Systems, Lecture Notes. Orbee learning package. Open Resources in Built Environment Education
Chen, A. 2009. Working Toward the Very Low Energy Consumption Building of the Future. Retrieved from Lawrence Berkeley National Laboratory website
Economidou, M. 2011. Europe’s buildings under the microscope. A country by country review of the energy performance of buildings. Published in October 2011 by Buildings Performance Institute Europe (BPIE). ISBN: 9789491143014
Gratia, E., De Herde, A. 2002. A simple design tool for the thermal study of an office building. Energy and Buildings, Volume 34, pp. 279-289
Hensen, J. 2004. Towards more effective use of building performance simulation in design. 7th International Conference on Design & Decision Support Systems in Architecture and Urban Planning, Eindhoven, July 2-5, 2004
Picco, M., Lollini, R., Marengo, M. 2014. towards energyperformance evaluation in early stage building design: A simplificationmethodology for commercial building models. Energy and Buildings, Volume76, June 2014, Pages 497-505
Punjabi, S., Miranda, V. 2005. Development of an integrated building design information interface, Building Simulation 2005 Ninth International IBPSA Conference, Montréal, Canada, August 15-18, 2005