Comparable to Flow Cytometry
Alireza Moradabadi MSc1, Morteza Khaleghi MSc2, Maryam Shahdoost PhD3, Alireza Farsinejad
PhD4,*
1. Student Research Committee, School of Para Medicine, Kerman University of Medical Sciences, Kerman, Iran.
2. Pathology and Stem Cell Research Center, Afzalipour Medical School, Kerman University of Medical Sciences, Kerman, Iran.
3. Department of Biostatics, School of public Health, Hamadan University of Medical Sciences, Hamadan, Iran.
4. Associated Professor in Hematology and Blood Banking, Pathology and Stem Cell Research Center; Kerman University of Medical Sciences; Kerman; Iran.
*Corresponding author:Alireza Farsinejad, PhD, Associated professor in hematology and blood banking; Cell therapy and regenerative medicine, comprehensive center; Kerman university of medical sciences; Kerman; Iran. Email: [email protected]
Received: 20 December 2017 Accepted: 05 December 2018
Abstract
Background: Reticulocytes are immature red blood cells with RNA, spending the final stages of their maturation in the peripheral blood. The number of reticulocytes in the peripheral blood is the salient evidence of the effectiveness of bone marrow to produce red blood cells. Currently, reticulocyte count is done manually or automatically in clinical laboratories. Difficulties and limitations of these approaches, including imprecision, poor reproducibility and laboriousness are clear. This study used modification in manually staining method to achieve better counting.
Materials and Methods: The reticulocyte counts of 30 samples were obtained from patients referred to Afzalipour hospital in Kerman, Iran. The patients aged between 0-3 years old (median age= 1.4 years). Samples were investigated for reticulocyte count by three different methods, including conventional, modified, and flow cytometry methods. Modified staining method is used in the optimized method which helps operator to countg reticulocyte better than conventional method.
Results: Analysis of the results showed a reasonable agreement. Sphericity assumption was checked by Kolmogorov-Smirnov and Mouchley analyses. Repeated measurement analysis was performed using Greenhouse-Geisser correction (F=16.6, df=1.105) according to pairwise comparisons with Bonferroni adjustment. Mean differences for flow cytometry, optimized and common methods were 3.88, 3.59, and 2.46 were significant at the 0.05 level, respectively.
Conclusion: The proposed optimized method was simple method, highly reliable, and comparable to flow cytometry. Due to the ease of implementation, this method did not need specialized training or the use of complex devices so it is affordable.
Key words: Blood Stains, Flow Cytometry, Reticulocyte, Reticulocyte Count, Staining and Labeling
Introduction
Precise measurement of blood parameters is essential for the detection of some diseases (1). One of these parameters is the counting of reticulocytes. Reticulocytes are immature red blood cells containing ribosomes, which spend the final stages of their maturation in the peripheral blood (2, 3). The number of reticulocytes in the peripheral blood provides salient evidence of the effectiveness of bone marrow in
producing red blood cells (4). Counting these cells is very important in the differential diagnosis of anemias and in their classification (8-5). They are an important indicator for measuring erythropoiesis in bone marrow aplasia patients and bone marrow transplant recipients. The importance of this indicator is due to this fact that it is the first sign of successful treatment in these patients 10). Currently, reticulocyte counting in clinical laboratories is done manually or on
automated instruments. Due to the simplicity and low cost, the manual method is more often used and has been approved as a standard method since 1940 (9). In the manual method, the red blood cells are placed in a test tube with a vital dying solution such as Brilliant Cresyl Blue or New Methylene Blue, and a film is then prepared (10,11). Finally, the dried film is examined microscopically; the number of reticulocytes is counted among at least 500 red blood cells, and it is reported as a percentage. In this method, cells that contain at least two blue points or strands of positively-staining material are considered to be reticulocyte (2). Difficulties and limitations of this approach include imprecision, poor reproducibility, and laboriousness. In addition, a patient and careful laboratory scientist along with posing qualified staining, smear preparation, microscope are variables that affect the accuracy of manual methods (2, 4, 15).
Results of studies investigated automated methods, in which flow cytometry technology is mainly used, indicated satisfaction and an increased willingness toward using these methods. In flow cytometry, owing to large number of studied red blood cells and the operator’s non-interference in cell counting, error rate is considerably lower, resulting in increased accuracy of the results (12). However, due to the high cost of testing, lack of flow cytometry in all laboratories, and shortage of skilled staff, the general adoption of flow cytometry for this purpose is faced with serious obstacles (13).
Considering the importance of an accurate reticulocyte count as well as the differences between manual and automated counts, devising a more accurate method than the conventional manual method is very important. In this study, three standard methods of manual, innovative, and optimized one using flow cytometry
Materials and Methods
SamplingA total number of 30 samples of EDTA-anticoagulated blood were obtained from patients, referred to Afzalipoor hospital in Kerman, Iran during summer of 2017. Patients aged between 0-3 years old (median age= 1.4 years). This study was approved by the Ethics Committee of Kerman University of Medical Sciences (Ethical Code: IR.KMU.REC.1395.590). According to the clinical features, reticulocyte counting had been requested for all patients by clinical staff. Written informed consent was obtained from all of the patients' parents.
Reticulocyte count by standard methods
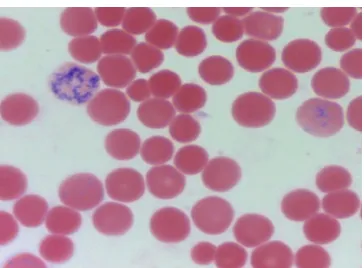
In this method, patients’ blood samples are equally mixed with supravital stain solution. Supravital stain solution included New Methylene Blue1% in phosphate buffer with pH 6.5. It was kept at 37 °C for 20 minutes in a water bath or double boiler. A wedge-spread film was prepared and was examined by optical microscopy after drying in the air. Reticulocytes among 500 red blood cells were counted. Cells containing at least two blue points or strings of positively-staining material were counted as reticulocyte, and their ratio to the total number of red blood cells was calculated as a percentage (Figure 1). Reticulocyte counts were performed in triplicate and the average was recorded as the final result.
Optimized method reticulocyte count
In this method, the patients’ blood samples were mixed with an equal volume of 1% New methylene blue solution and were maintained at 37 °C for 20 minutes as mentioned above. After film preparation and drying, the slides were placed in a jar containing absolute ethanol and were taken out immediately. In addition to bleaching, red blood cells were stabilized on glass slides with the ability to be stained at a
stain (as background color) and were examined with an optical microscope (Figure 2). A diluted Wright stain was selected because of the short time needed for staining and no formation of stain deposit, which could interfere with the reticulocyte count. Finally, reticulocyte counting was done in triplicate which was the same as the standard method.
Reticulocyte count using flow cytometry
In this method, the flow cytometry instrument, FACSCALIBUR, manufactured by BD company and equipped with CELLQUEST-Pro software was used to measure the number of reticulocytes. To achieve this purpose, two microliters of anticoagulated blood were mixed in 500 µl dye Thiazole Orange (according to the kit instruction) and diluted in phosphate buffer solution. Having kept for 30 minutes at room temperature in the dark, samples were analyzed by flow cytometry. For device settings, using the blood mixed with phosphate buffer, the population of red blood cells were shown in the diagram using gate forward scatter versus side scatter (FSC/SSC) (Figure3-A) and in the histogram related to FL1 channel (Figure3-B). In the histogram FL1, the Autofluorescence area (M1) was determined; M2 represented reticulocytes. At this point, the device for red blood cell stained with Thiazole Orange was ready to be counted. As the machine started to operate, all cells with fluorescence greater than the M1 threshold were considered to be reticulocytes (Figure 3-C). Finally, after counting 25,000 red blood cells, the reticulocyte percentage was determined. Flow cytometry test on each sample was done in triplicate, and the mean was recorded as the reticulocyte percentage.
Statistical Analysis
A repeated measurement analysis was
performed to compare three different methods with Bonferroni as the post hoc analysis. Statistical analysis was performed using SPSS (version 16). The level of statistical significance was set at 5%.
Results
Samples used for peripheral blood reticulocyte count were collected from 15 males and 15 females. Among these samples, 5 samples were from infants, 6 samples were from patients with hemolytic anemia, and 2 were from patients with severe anemia caused by bleeding, in all of whom reticulocytosis was expected. The rest of patients did not have hematological abnormalities or anemia and were not expected to have increased reticulocytosis. The intraclass correlation (ICC) was computed in order to determine the reproducibility of each method. For each method, ICC amount was close to one. Therefore, for each sample, the mean of responses in three rounds were computed and the means were compared by repeated measure analysis. Before performing the analysis, normality of data and also sphericity assumption were checked by Kolmogorov-Smirnov and Mouchley analyses, respectively. Contrary to normality test results, Mouchly test could not confirm the compound symmetry assumption (p<0.001). Therefore, the repeated measure analysis was performed using Greenhouse-Geisser correction (epsilon=0.552). The results of the analysis following Greenhouse-Geisser correction showed that the averages differed among three methods (p<0.001) (Table II). According to pairwaise comparisons (with Bonferroni adjustment), all means differences were significant at 0.05 level. Figure 4 shows the profile plot of method means.
Figure 1. Reticulocytes stained by the standard method
Figure 2. Rreticulocytes stained by optimized method.
Figure 3. Flow cytometry analysis of reticulocyte histogram. A. The population of gated red blood
cells in scatter plot vis-à-vis the lateral distribution. B- Control Isotype histogram that shows RBC
Autofluorescence (M1) C-Reticulocyte histogram displays reticulocyte ratio (M2) to the total RBCs.
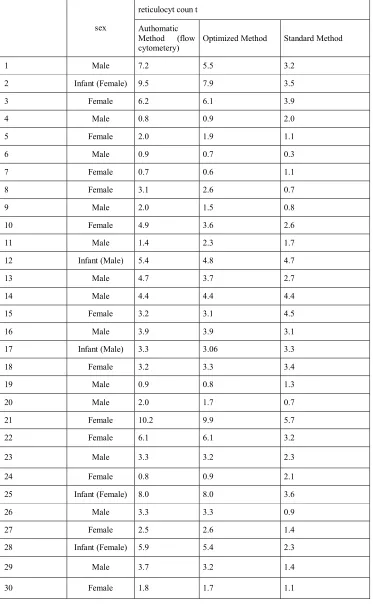
Table I: The triplicate reticulocyte counts using three different methods
reticulocyt coun t
sex
Standard Method Optimized Method
Authomatic Method (flow cytometery) 3.2 5.5 7.2 Male 1 3.5 7.9 9.5 Infant (Female) 2 3.9 6.1 6.2 Female 3 2.0 0.9 0.8 Male 4 1.1 1.9 2.0 Female 5 0.3 0.7 0.9 Male 6 1.1 0.6 0.7 Female 7 0.7 2.6 3.1 Female 8 0.8 1.5 2.0 Male 9 2.6 3.6 4.9 Female 10 1.7 2.3 1.4 Male 11 4.7 4.8 5.4 Infant (Male) 12 2.7 3.7 4.7 Male 13 4.4 4.4 4.4 Male 14 4.5 3.1 3.2 Female 15 3.1 3.9 3.9 Male 16 3.3 3.06 3.3 Infant (Male) 17 3.4 3.3 3.2 Female 18 1.3 0.8 0.9 Male 19 0.7 1.7 2.0 Male 20 5.7 9.9 10.2 Female 21 3.2 6.1 6.1 Female 22 2.3 3.2 3.3 Male 23 2.1 0.9 0.8 Female 24 3.6 8.0 8.0 Infant (Female) 25 0.9 3.3 3.3 Male 26 1.4 2.6 2.5 Female 27 2.3 5.4 5.9 Infant (Female) 28 1.4 3.2 3.7 Male 29 1.1 1.7 1.8 Female 30
Table II -Mean of counts by each method
n Mean (SD) p-value
ytometery c Flow
30 3.88(2.56) 0.001>*
Optimized
30 3.59(2.33)
Common
30 2.46(1.39)
(*) Based on Mouchly test, repeated measure test was performed using Greenhouse-Gaisser correction (F=16.6, df=1.105).
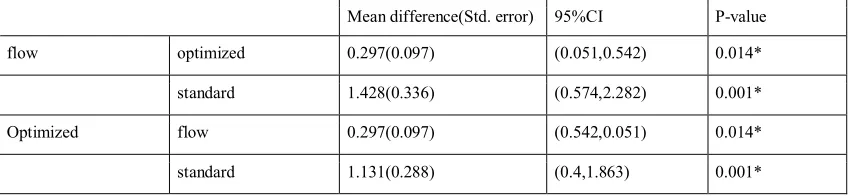
Table III: Pairwise comparison among three methods
Mean difference(Std. error) 95%CI P-value
flow optimized 0.297(0.097) (0.051,0.542) 0.014*
standard 1.428(0.336) (0.574,2.282) 0.001*
Optimized flow 0.297(0.097) (0.542,0.051) 0.014*
standard 1.131(0.288) (0.4,1.863) 0.001*
(*) significant at 5% level
Discussion
Today, the basis of correct diagnosis of blood diseases is accurate measurement of blood parameters, including counting blood cells (1). Among these, the reticulocyte count is very important in diagnosis and for determination of the effectiveness of anemia treatment (4). The reticulocyte counts and calculation of its relevant parameters are very useful in the differential diagnosis of common forms of anemia such as iron deficiency and beta thalassemia minor (3). The reticulocyte index has many applications in the classification of diseases such as iron deficiency and functional iron deficiency and in the evaluation of patients who are treated with recombinant erythropoietin (4). Evaluation of the bone marrow in patients with a high reticulocyte count shows that maturation of basophilic erythroblast to produce reticulocyte has become very short; hence, a more active
suggested (2). As a result of stimulating the bone marrow with erythropoietin, hypoxia caused by anemia, and/or prescribing erythropoietin, the cells are released to a greater extent in the bone marrow. Counting these cells in peripheral blood is of high value. Normally, the peripheral blood cells count is done using vital stain. This procedure is the common and standardized method for counting reticulocytes, but flow cytometry is also used with a more limited extent. Automated analyzers with a module for reticulocyte counting also uses flow cytometry.
In surveys conducted on the coefficient of variation (CV) in the reticulocyte count manual method, this index is ranged from 26.2% to 32.4% by the American Pathologists Association (14, 15). High CV is due to many errors, the inability to distinguish stain deposits from reticulocytes by the laboratory expert.
counting using fluorescent dyes such as Acridine Orange which stains only RNA in red blood cells, was reported by KOZENOW and MAI in 1950 using fluorescence microscopy (17). This method was not generally adopted because of the unavailability of appropriate equipment and the lack of clear advantages as compared to the microscopic method (18). Automated methods are more advantageous since they have high speed, include less laboratory scientist interference, and have more accuracy. Through allowing higher numbers of cells to be counted (at least 50 times greater) compared to manual methods, the automated methods also provide more information (18). However, automated methods have their own disadvantages such as a falsely high reticulocyte count due to interference including that from nucleated red blood cells and Howell‒Jolly bodies; the requirement for sophisticated and expensive equipment, and the need for a skilled operator (18). Many studies have compared different methods of counting. Scherer et al., (2015) specified a normal reticulocyte count (mean ± 2SD) using flow cytometry method in 249 healthy patients and reported 0.07±0.04 for men and 0.06±0.04 for women (19). Similar to our study, in another study by Nobes and Carter, manual counting was compared with flow cytometry, giving a coefficient of correlation of 99/0% with slope of 96/0 % and intercept 0-02. In the present study, reticulocyte count accuracy percentages in three patients with counts of 0/12, 1/18, and 14/3 were 33/3, 7/3, and 1/84; respectively (2). In another study conducted by Pappas et al to compare these methods, it was found that 10,000 or more cells (now 30,000 cells in our laboratory) could be counted using flow cytometric method; however, 1,000 could be counted by conventional method, revealing the higher statistical accuracy of the flow cytometry method(20).
conventional method was still the standard method since the automated method was too expensive but the manual method was more available and simple (21).
Conclusion
In the current study, an alternative method was developed for counting reticulocytes, which did not need complex devices or specialized training. Interferences related to dye deposits and Heinz bodies was minimized due to an additional step of bleaching; hence, the accuracy of this method remained high and comparable to that of flow cytometry methods. Another advantage of this method was that it facilitated the counting process compared to conventional staining and reduced the rate of error done by staff. Accordingly, it seems that this method is affordable and accessible for the centers in which the reticulocyte count is critical for patient care.
Acknowledgment
Hereby, the efforts of staff in stem cell research center and pathology department in Kerman University of Medical Sciences are appreciated with lots of gratitude.
Conflict of interest
Authors declared no conflict of interst.
References
1. Müller MM. Implementation of reference systems in laboratory medicine. Clin. Chem 2000;46(12):1907-9.
2. Nobes P, Carter A. Reticulocyte counting using flow cytometry. J. Clin. Pathol 1990;43(8):675-8.
3. Estridge BH, Reynolds AP, Walters NJ. Basic medical laboratory techniques: Work Life Policies 2007. 4. Khan, Leah. Anemia in Childhood. Pediatr Ann 2018, 47.2: e42-e47.
5. Nalado, Aishatu Muhammad, et al. Utility of reticulocyte haemoglobin content and percentage hypochromic red
cells as markers of iron deficiency anaemia among black CKD patients in South Africa. PloS one 2018, 13.10: e0204899.
6. Kotisaari S, Romppanen J, Penttilä I, Punnonen K. The Advia 120 red blood cell and reticulocyte indices are useful in diagnosis of iron‐deficiency anemia. Europ J Haemat 2002;68(3):150-6.
7. Briggs C, Rogers R, Thompson B, Machin S. New Red Cell Parameters on the Sysmex XE-2100TM as Potential Markers of Functional Iron Deficiency. Transfus Med Hemother 2001;28(5):256-62.
8. Miwa N, Akiba T, Kimata N, Hamaguchi Y, Arakawa Y, Tamura T, et al. Usefulness of measuring reticulocyte hemoglobin equivalent in the management of haemodialysis patients with iron deficiency. Int J Lab Hematol 2010;32(2)248-55.
9. Kaufhold, Annemarie E., et al. A comparison of manual counting of rabbit reticulocytes with ADVIA 2120i analyzer counting. J. Vet. Diagn. Invest 2018, 30.3: 337-341.
10. Koury, Mark J., et al. In vitro maturation of nascent reticulocytes to erythrocytes. Blood, 2005, 105.5: 2168-2174.
11. Mahe, Etienne R., et al. Accuracy of the CellaVision DM96 platform for reticulocyte counting. J Pathol Inform 2014, 5.
12. International Council for Standardization in Haematology, Writing Group:, et al. "ICSH guidelines for the evaluation of blood cell analysers including those used for differential leucocyte and reticulocyte counting." Int J Lab Hematol 2014 : 36.6: 613-627.
13. Cell ndi. pathogenesis of aplastic anaemia and paroxysmal nocturnal haemoglobinuria: the concept of clonality in stem cell disease jaroslaw maciejewski. pathology. 2012;44(s1):s33-s6.
14. Belisário, André Rolim, et al.
high-risk transcranial Doppler in a newborn cohort of 395 children with sickle cell anemia. Ann Hematol 2016, 95.11: 1869-1880.
15. Scherer, Patrícia S., et al. New red blood cell and reticulocyte parameters and reference values for healthy individuals and in chronic kidney disease. J Bras Patol Med Lab 2015, 51.2: 77-84.
16. Viana, Karina Augusta, et al. Flow cytometry reticulocyte counting using acridine orange: validation of a new protocol. J Bras Patol Med Lab 2014, 50.3: 189-199.
17. Kosenow, W., & Mai, H. (1952). Fluorescence microscopy of blood cells. Z Kinderheilkd 70(6), 552-560.
18. Riley RS, Ben-Ezra JM, Tidwell A. Reticulocyte enumeration: past & present. Lab Med 2001;32(10):599-608.
19. Scherer PS, Moraes D, Munhoz TP, Sgnaolin V. New red blood cell and reticulocyte parameters and reference values for healthy individuals and in chronic kidney disease. J Bras Patol Med Lab 2015;51(2):77-84.
20. Pappas AA, Owens R, Flick J. Reticulocyte counting by flow cytometry. A comparison with manual methods. Ann Clin Lab Sci 1992;22(2):125-32.
21. Viana KA, Carvalho MdG, Dusse LMSA, Fernandes AC, Avelar RS, Avelar DMV, et al. Flow cytometry reticulocyte counting using acridine orange: validation of a new protocol. J Bras Patol Med Lab 2014;50(3): 189-99.