International Journal of Railway Research, Vol. 5, No. 1, (2018), 27-37
*Corresponding Author
Email address: [email protected] `
International Journal of
Railway Research
Modeling a Multi-period Transportation System for Supplier Selection and Orders Allocation
Problem (Case Study: Parchsaz Company)
Shadi Nouhi Tehrani1, Ali Bozorgi-Amiri2*
1School of Industrial Engineering, South Tehran Branch, Islamic Azad University, Tehran, Iran 2School of Industrial Engineering, College of Engineering, University of Tehran, Tehran, Iran
ARTICLE INFO A B S T R A C T
Article history: Received: 10.02.2018 Accepted: 23.04.2018 Published: 15.06.2018
The combination of transportation costs is very important for supplier decision making. Suppliers play a key role in the efficiency and effectiveness of the organization in reducing costs, quality, profitability, and flexibility. With increasing competition in the world of trade, how to supply and choose suppliers of raw materials in the supply chain is an important challenge for many organizations. Therefore, in this research, it is tried to analyze the effective measures on the assessment of the quality of suppliers by using the opinions and experiences of the experts, analyzing the relations between them and using the method of network analysis to rank the criteria and suppliers. 39 risk-based supply indicators for the case of study are identified. Based on the experts’ assessment, 10 indicators are selected as the final indicators. According to the existing supply chain, five existing suppliers of the company are evaluated and ranked. Using the mixed linear programming model, the allocation of raw materials to each of the ranked suppliers is determined.
Keywords:
Transportation Supplier selection Supply allocation
Fuzzy ANP ranking Routing problem
1. Introduction
In today's global competitions, the economic and manufacturing firms have turned to supply chain management for gaining competitive advantage and higher market share. The key issue in a supply chain is the coordinated management and control of all activities. Supply chain management is a phenomenon helping the customers quickly receive the high-quality, reliable products and services at a minimum cost. In general, the supply chain consists of two or more organizations which are formally separated from each other and linked together by the flows of materials, information, and financial flows [1]. The transportation is one of the important and interesting issues that have paid much attention in industrial engineering. In industrial engineering,
there is a managerial and optimization attitude to these issues. In manufacturing organizations a large percentage of production costs is related to their transportation system. Therefore, by optimizing transportation, production costs can be greatly reduced and corporate profits can be increased. In general, transportation is used to move people, animals and goods. Transportation system in manufacturing companies is divided into two categories.
Outside company (transportation): These types of issues are being evaluated by researchers in the field of logistics and supply chain issues. Inside company (material handling): These types
of issues are being studied and evaluated by the researchers in the fields of production.
ISS
N:
2423
-3838
Modeling a Multi-period Transportation System for Supplier Selection and Orders Allocation Problem …
28 International Journal of Railway Research (IJRARE) Various types of transportation are air, water and land transportation, which includes rail, and road transport. The shift of a paradigm is one of the most important reasons for highlighting the role of supplier selection for companies. At the beginning, the companies sought to increase their list of suppliers to increase their bargaining power over the price and now they are attempting to establish a strategic relationship with a smaller number of suppliers satisfying their needs in the best way [2]. This will add to the efficiency and effectiveness of the company and its value chain through a partnership, facilitation of communication, and faster supply of better quality products. Basically, there are two main tasks in every decision-making process on how to select the suppliers: one is how to evaluate and the other is how to select. The evaluation process involves identifying the indicators, attributes, criteria and decision-making factors while the selection process involves ranking the suppliers by considering the indicators and criteria of selecting the potential [3].
The decisions on supplier evaluation and selection are an important part of supply chain management which is true for manufacturing companies to obtain a variety of products and services including materials and equipment. In today’s severe competition, the low-cost production and high-quality products without satisfactory suppliers are not possible. Due to the progress made in quality improvement and delivery based on timely delivery plans, the supplier evaluation has developed in the present form and hence the need for evaluation emerged on the basis of new features (not just prices). Furthermore, the supplier selection on a cost-effective basis could make quality improvement plans difficult. Forgetting the factors such as delivery time and quality was risky for the customer because it caused a shortage of materials or a defective product. The other shortcomings resulted from considering the price as the only evaluation criterion included the lack of product delivery in accordance with the requirements, especially with the number of low, but frequent orders, the lack of technical capabilities, etc. [4].
Due to the complexity and uncertainty in a business environment, there is a risk in all processes and business practices. In other words, in any process or action, it is likely that things will not be performed in accordance with what was planned and accompanied by unfavorable results. The buyer organizations face a variety of risks associated with supplying their items. The supply risk is the
probability of the occurrence of an event related to the supply of materials or goods entering the organization resulting in the supply of goods and services from a supplier or a means of supply with difficulty and defect. The result of such a defect is the failure to meet the customer's demand or the loss of customer safety. Based on the numerous industries, the scope of risk sources and their outcomes are different. Given the many angles of studying the supply chain risk, many categories for this group of risks were presented in a lot of studies. However, not a particular category can be preferred because each one is desirable and efficient from the researcher's point of view and in terms of the field of industrial background and its particular environment. Although, there is no consensus among researchers about risk grouping, they all agree that risk is a dynamic phenomenon and heavily depends on the context and the environment in which it occurs. Several studies were conducted on designing and identifying the supplier evaluation indicators. The most important discussion about the indicators of supplier evaluation is the appropriateness of the indicators with organizational goals, alignment with organizational strategies, credibility over time, and the possibility of rapid and accurate feedback. Seemingly, imposing a series of criteria on the decision maker is not the correct procedure but he must be made free for selection by introducing the structure of procedure. Choosing the criteria for supplier evaluation is one of the early stages of the supplier selection process. Therefore, this stage is very important. The indicators were defined in different studies based on the type of subject. Such criteria are usually determined by experts. These people determine the indicators according to the organization's strategies in the meetings.
2. Literature review
The most important discussion of the supplier evaluation criteria is the appropriateness of the indicators with organizational goals, along with the organization's strategies, credibility over time and the possibility of rapid and accurate feedback. Min examines supplier selection problem using case studies of organizations involved in buyer-supplier relationships [5]. He has mentioned several other complementary factors which must be considered in choosing supply chain members alongside factors such as quality, cost, on-time delivery and services. This problem is usually arisen in relation with the role of the Multi-Attribute Decision Making problem (MADM) due to the involvement of many factors in the supplier evaluation and selection. MADM problems usually include discrete decision variables
Tehrani and Bozorgi Amiri
International Journal of Railway Research (IJRARE) 29 and a limited number of evaluation alternatives. Also,
uncertainty is considered as an integral part of the process when the evaluation process is executed by human judgment. Fuzzy set theory is also one of the most effective tools which consider uncertainty in the evaluation process. Many MADM problems are evaluated in fuzzy environments due to this feature of fuzzy sets. The supplier evaluation and selection problem is one of MADM problems. In this regard, no effort has been made to review the functions of the MADM approaches for the fuzzy evaluation and selection of suppliers. However, some researchers have carried out articles on multi-objective evaluation and selection.
Franklin et al. [3] introduced a new method called the Voting Analytic Hierarchy Process (VAHP) for supplier selection in their research paper. This method is a new weighing method rather than the AHP Pairwise comparisons for supplier selection, but does not lose the systematic approach of weights used and scoring to supplier performance. Chen et al. [6]have introduced a fuzzy decision-making method for supply selection problem in the supply chain system. They have argued that in recent years, identifying appropriate suppliers in the supply chain has become an important strategic problem. In a research entitled Simulation of AHP and TOPSIS models and their application in supply chain management, they concluded that the strategic relationship between the parent company and affiliated companies have been emphasized in supply chain management. Min [5] provided a method to select one or more suppliers by calculating the supplier's combined score using quantitative and qualitative criteria. His integrated model is a combination of AHP, DEA, and neural network. Ha and Krishnan [4] during a study used AHP and TOPSIS methods and developed a general framework based on consumer and customer needs. Accordingly, they considered the requirements of customers as the basis of their work. Lin et al. [7] determined the relationship between customer needs and product features using the AHP model, and prioritized customer demands using the TOPSIS approach.
Mousakhani et al. [8] examined about the most common methods used in supplier selection and evaluation, and tried to answer the question that which one of the evaluation criteria had been paid more attention?" They examined 75 papers conducted in the period of 2000-2008 on the supplier selection and evaluation in order to answer these questions. They realized that integrated approaches
has received less attention compared to individual approaches for supplier selection. The most commonly used for supplier selection is DEA. AHP has received more attention in the integrated approaches due to its ease of use and flexibility. The most commonly integrated approach used is AHP-GP. About the most common supplier evaluation criteria, the quality criterion (used in 68 articles) followed by delivery time (used in 64 articles), price / cost (in 63 articles), the ability to manufacture, service, management, technology, R & D, financial, flexibility, reputation, relationships and safety are the most commonly used criteria for supplier selection and evaluation. This proves that, the cost criterion as one of the main criteria for supplier selection is now replaced by other criteria. Kilincci and Onal [9] have carried out a study on Fuzzy AHP Approach for supplier selection in the washing machine company, and selected three suppliers based on three criteria of product performance, service performance and suppliers. The supplier criterion included the sub-criteria of supplier financial, management, technological capability, quality system, geographic location and capacity. The sub-criteria of the product performance are: product price and product quality. The service performance criterion is also divided into sub-criteria of delivery time, follow-up and technical support. In this study, the product performance criterion is more important than the other two criteria. In 2013 Samoilenko and Osei-Bryson [10] concluded that the competitive nature of the business environment requires the awareness of productivity-based organizations of the relative level of their effectiveness against competitors. Firstly, this issue suggests the need for an effective mechanism that makes possible the discovery of appropriate productivity models for improving overall organizational performance. Secondly, the need for a feedback mechanism that makes possible the evaluation of different productivity models for selecting the most appropriate model. In this study, the focus is on organizations that consider the status of the internal organizational environment (for example, they are likely a reprehensive of a source-centered view), and external (for example, they are likely a reprehensive of positioning perspective) for formulating their own strategies. In this study, a DEA-based decision support systems (DSS) is aimed to evaluate and manage the relative performance of such organizations is proposed and tested.
Modeling a Multi-period Transportation System for Supplier Selection and Orders Allocation Problem …
30 International Journal of Railway Research (IJRARE) Lin et al. [7] argued that supply chain managers have faced with supplier selection, as an important problem over the years. It is no longer easy to select the right suppliers, just like the selection (based on the price) offered by them. There are many quantitative and qualitative criteria that must be considered. Therefore, there is an urgent need for an approach that can cover these criteria. In addition, since the importance of supply chains is increasing day by day, consideration of inappropriate supply risks is of utmost importance in supplier evaluation. This study presents an approach that focuses on data envelopment analysis for analysis and comparing the relative efficiency of suppliers. Since data envelopment analysis can only cover quantitative features, Analytic Hierarchy Process (AHP) is used to help qualitative analysis. Risks are considered in the supplier evaluation. The aim of proposed approach is to provide a comprehensive approach to address supplier selection problem.
Mirhedayatian et al. [11] argued that the Data Envelopment Analytic Hierarchy Process (DEAHP) Approach as a weighting method for the hierarchical analysis process (AHP) has faced with some barriers. They have proposed a new approach, entitled "Modification of Analytical Hierarchy Process of Data Envelopment Analysis for Analytical Hierarchy Process". It was a new approach to derive weight using the data envelopment analysis in the hierarchical analysis process. According to the points presented in this study, (1) the modification of the hierarchical analysis process of data envelopment analysis can derive the correct weights from fully pairwise comparison matrices, (2) the use of the above-effective model in the Data Envelopment Analysis to derive weight of the additional hierarchical analysis process improves the decision making when there are a multi-decision criterion or effective options in the pairwise comparison matrix. With regard to the literature review carried out in this area, obviously most studies were based on decision models or mathematical models. In other words, the studies were either carried out on the basis of allocation or selection. The supply chain at the allocation and selection was less considered and the research gap in this case was seen in most studies.
3.
Model Definition
With reference to the research gap that needs to be completed and analyzed here is a general outline of the problem in this study:
3.1
The mathematical modeling of order
volume allocation to suppliers
(MODM)In this section, given the importance of order allocation to each supplier and its impact on costs, there was an issue of order volume allocation to rated suppliers in which the problem of vehicle routing and material inventory was considered.
3.1.1. Abbreviations and Acronyms
A multi-objective linear programming model for the problem with the following symbols is presented.
Assumptions of the problem
• Demand for each course is considered as a deterministic.
• The model will be reviewed in several cycles. • The model is considered as multi-product. • It is possible to store materials in any supplier. • There is a space between the factories and suppliers and supplier to the supplier.
• It is possible to store raw materials in suppliers. • In each period, the factory deficit is not allowed. • Travel time between suppliers is estimated based on the distance between them.
• Suppliers are ordered based on the weight obtained by the fuzzy network analysis process.
Sets:
= { = 1, … , } set of all factory = { = 1, … , } set of all supplier
= { = 1, … , } set of all order = { = 1, … , } set of all vehicle = Set of time periods
Parameter definitions:
The amount of demand i from the product r in period t
Vehicle fixed costs l
Figure 1. Two-phase problem of supplier selection and order allocation
Tehrani and Bozorgi Amiri
International Journal of Railway Research (IJRARE) 31 Production Fixed costs in period t
Transportation cost of vehicle l from factory i to supplier's location j in period t, with regard to the emission
Transportation cost of vehicle l from supplier j to supplier location with regard to the emission
Travel time between factory i and j supplier location
Cost of travel time between plant i and j supplier location j
Travel time between supplier location j and supplier location
Standard travel time for transportation The cost of travel time between the supplier's location j and supplier location with regard to the emission
Volume of each product r Capacity of Factory i
Capacity of vehicle l
The cost of maintaining each product unit r in supplier j in period t
Large number
Decision variables:
The amount of product r sent from the supplier j to the plant i at time t.
The amount of product r produced by supplier j is sent during period t.
The amount of product r delivered from the supplier j to the supplier by the vehicle l in period t.
The amount of product r in supplier j in period t
A binary variable that determines if the vehicle l transported from factory i to supplier's place j in time t
Mathematical model:
A binary variable that determines if the vehicle l transported from the supplier j to the supplier in period t
A binary variable that determines if the vehicle l transported from the supplier j to factory i
in period t.
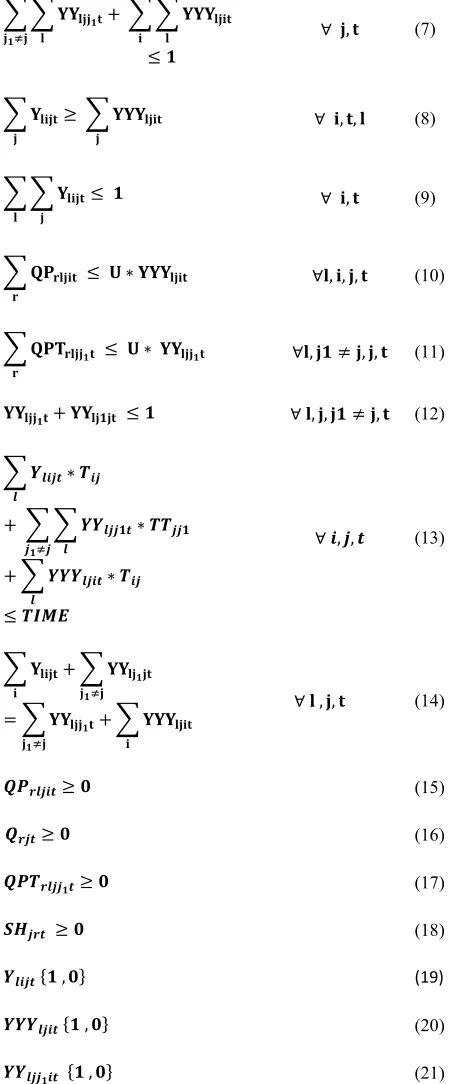
The first objective function is to minimize the cost of supplying products from the supplier to the factory, sending the material from the supplier to the other supplier, the cost of transportation vehicle from the factory to the supplier (1). The second objective function is the cost of the travel time from the factory to the supplier and the cost of the travel time from the supplier to the other supplier maintenance cost in supplier depot with the fixed cost of production.(2) Constraint (3) ensures all inputs and outputs from suppliers must be equal in each period. Constraint (4) ensures that the total amount of material loaded from the volume of vehicles is less for sending materials to the factory location. It does not exceed the capacity of the vehicle. The next constraint (5) ensures that all of the orders must be supplied from suppliers that were selected with FANP. Constraint (6) ensures that open rout in each period from factory to supplier or from supplier to another supplier is provided. Constraint (7) ensures that each vehicle in each period transported from supplier to another supplier
= ∑ ∑ ∑ ∑ ∑ ∗
+∑ ∑ ∑ ∑ ∑ ∗ +
∑ ∑ ∑ ∑ ( + ) ∗ (1)
= ∑ ∑ ∑ ∑ * ∗ +
∑ ∑ ∑ ∑ * ∗
+ ∑ ∑ ∑ * + ∑ ∑ ∑ ∗
(2)
s.t
+ ( )+
= +
+
∀ , , (3)
∗ +
∗ ≤
∀ , , , (4)
∗ = ∀ , , (5)
+ ≤ ∀ , (6)
Modeling a Multi-period Transportation System for Supplier Selection and Orders Allocation Problem …
32 International Journal of Railway Research (IJRARE) or factory. Constraint (8) ensures that, if the vehicle goes from the factory to the supplier, it will then return the supplier to the factory again, if possible. Constraint (9) ensures that the vehicle can be transported from the factory to the supplier once in each period. (10) Ensures opening a path between the factory and the supplier. Restriction (11) show opening a path between the supplier and another supplier. (12) Ensures that do not create closed loop between suppliers. Constraint (13) ensures that
orders are sent to the factory during the standard period. Constraint (14) ensures that the vehicles arrive to each supplier at the same extend that leaves from supplier. Constraints (15-21) present the type of continuous and discrete (binary) variables of the mode.
3.2 FANP decision-making technique (MCDM)
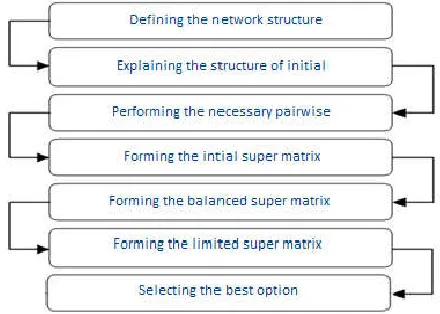
Considering the research literature, reviewing the status of the company and suppliers, and interviewing purchasing managers, procurement, quality, research and development, engineering, etc., the FANP decision making technique was selected for selecting and ranking suppliers and obtaining the supplier's weight parameter in the proposed mathematical model. Firstly, each expert was asked to rate each indicator according to the importance of indicators and based on Likert scale (points one to five). Then, the indicators with an average score of above three were identified and selected by calculating the average scores. In general, the final indicators were elected to evaluate suppliers according to the experts’ opinion. In this study, the census method and opinion of all experts were used due to the limited number of members. In order to ensure the reliability of the opinions received from experts, the reliability of interviews was assumed given that the sample population of the study was among the experts of the studied industry. In this phase, after identifying the suppliers, the quantitative and qualitative criteria were calculated using the FANP technique to weigh the criteria and to evaluate the contractors of the company. After obtaining the output weight parameters, the multi-criteria decision making model was used as input in the MODM phase to accurately calculate the demand and eventually allocate the volume of orders to each supplier, Figure 2.
Figure 2
.
Development stages of the hybrid MCDM and MODM model+
≤
∀ , (7)
≥ ∀ , , (8)
≤ ∀ , (9)
≤ ∗ ∀ , , , (10)
≤ ∗ ∀ , ≠ , , (11)
+ ≤ ∀ , , ≠ , (12)
∗
+ ∗
+ ∗
≤
∀ , , (13)
+
= +
∀ , , (14)
≥ (15)
≥ (16)
≥ (17)
≥ (18)
{ , } (19)
{ , } (20)
{ , } (21)
Step 1: Identifying the options (suppliers)
Step 2: Determining the quantitative and qualitative criteria
Step 3: Using the FANP technique to weigh the criteria and options
Step 4: Solving the mathematical model and determining the optimal order value for each supplier by the hybrid MCDM
and MODM model
Tehrani and Bozorgi Amiri
International Journal of Railway Research (IJRARE) 33
3.3 Explaining the FANP structure
Explaining the FANP structure in a network analysis method allows the decision maker to build a network instead of a hierarchy making it possible to examine the interconnection between the elements. The nodes in this network are equivalent to the standards or options, and the branches that connect these nodes are also equivalent to their degree of dependency. Determining the relationships existing in the network structure or determining the degree of interdependence between the criteria and the options is the most important task of network analysis. Communication and dependency can be as the relationship between different levels of the network either externally or internally. The relative importance of each member of the collection - at its own level - is similar to the hierarchical analysis method with the help of a set of pairwise comparisons. The structure of the FANP method is presented in Figure 3.
Figure 3. The structure of the FANP method
4.
The Analysis of the Results4.1 Case study (Parchsaz Manufacturer)
The company for this case study that is Parchsaz Manufacturer was established in 1984 to produce a variety of rivets (blind rivet). Since its exploitation, the promotion of quality has been one of the major goals. The overall purchasing process of this company involves numerous activities
which are
highly interconnected in most cases, Figure 4.
Figure 4. Purchasing process
4.2 Identifying the indicators of supplier
evaluation based on supply risk (step one)
In this study, the foreign companies were disregarded and five Iranian supplier companies were selected. This is due to the collected field data as well as taking advantage of the experts’ opinions in the studied company and the political and economic problems of the country in recent years. The five Iranian supplier companies included:
A1: Kashan Wire Net Company A2: Alborz Industrial Dies Company A3: Esfahan Steel Company
A4; Kavir Steel Company A5: Hermes Wire Company
It should be noted that these five companies worked in the fields of supplying the steel items required by the company.
4.3 Identifying the indicators of supplier
evaluation based on supply risk (step two)
In this study, 39 indicators having more importance than other indicators of supplier selection in the initial evaluation were selected. This is according to the collected field data and using the opinions of 14 experts while the other indicators were ignored because of their low importance, Table 1.
Table 1. The average of experts’ opinions on the importance of evaluation indicators
ro
w Indicators of outsourcing activities
me
a
n
1
Acceptable Pieces in Million 3/85
2
Corrective and preventive action system 4/12
3
Low rates of defects 2/18
4
Full rate (no flaw) 4/26
5
Quality bonus 2/99
6
quality reliability 3/45
7
appropriate delivery date 2/82
8
Delivery and location 2/33
9
Delays in delivery 2/09
10
Delivery reliability 2/95
Modeling a Multi-period Transportation System for Supplier Selection and Orders Allocation Problem …
34 International Journal of Railway Research (IJRARE) 11
Competitive cost 1/47
12
Fluctuation in costs 2/75
13
Money Transfer Interactions 2/63
14
quality match 3/83
15
Documentation and self-certification 2/78
16
Non-conforming material control system 3/12
17
Process control capability 3/2
18
Quality Certificate 1/32
19
Experiencing the quality of service 3/56
20
compliance with the expiration date 2/1
21
delivery match 2/34
22
delivery efficiency 1/54
23
time from Procurement to delivery 2/3
24
Ability to reduce costs 1/89
25
price of products 2/76
26
high reputation 2/1
27
Production based on Six Sigma or Comprehensive
Quality Management Program
4/2
28
Inspection and control 3/2
29
The number of quality staff 2/39
30
quality guarantee 2/1
31
Data and Quality Reporting 2/87
32
transportation quality 2/89
33
Degree of proximity 1/9
34
Terms of delivery 2/56
35
Procurement time 1/3
36
fitting the price of materials to market price 1/2
37
attempting to cut the costs 2/14
38
ordering circulation 2/13
39
being a brand 2/44
Based on the above data, 10 indicators out of 39 had an average above 3. It can be concluded that these variables were effective risk indicators for
supplier evaluation in the organization from the perspective of experts.
4.4 Ranking the indicators and suppliers by
using the FANP (Step 3)
Pairwise comparisons were performed for
each criterion in the table.
The steps of obtaining the weight of components by Fuzzy Network Analysis
Based on the super matrix, the steps of calculating the weight of components were:
Step 1: A geometric mean was taken from the pairwise comparisons to summarize the experts’ opinions.
Step 2: Eigen vector calculation: The logarithmic least squares method was used according to Equation (22) to calculate the Eigen vector of each of the pairwise comparison tables.
l m u
s a a w n i n n j m ij n n j s kj s
k , , ,
1 1 1 1 1
(22)So that,
w
w
w
w
k
n
u k m k l k
k
(
,
,
)
1
,
2
,
3
,...,
~
An example of the geometric mean of experts’ opinions was given in the Tables 2&3. The Eigen vector was shown in the final column of these tables. Step 3: Forming the Eigen vector matrices (Wij);
these matrices included the Eigen vectors derived from the second-order pairwise comparisons. Step 4: Calculating the final weights levels: In order to calculate the final weight of components at each level
W
i* the product of the Eigen vector matrix of internal relations in the Eigen vector of the same level must be multiplied by the final weight of the higher level. * 1 ) 1 ( *
ii ii ii
W
W
W
W
(23)If there is no matrix Wii for one level, a matrix with the same level must be replaced. In other words, the following formula must be used:
* ) ( * 1 1
ii ii
I
W
W
W
(24)Tehrani and Bozorgi Amiri
International Journal of Railway Research (IJRARE) 35
Table 2. Eigen vector matrix at level 2 over level 1
Check the selection of suppliers
Rating Indicators (0.058,0.063,0.079) Corrective and preventive
action system (0.075,0.087,0.105) Full rate (no flaw) (0.076,0.087,0.104) quality reliability (0.067,0.079.0.094) quality match (0.072,0.084,0.101) Non-conforming material
control system (0.087,0.103,0.12) Process control capability (0.096,0.117,0.131) Experiencing the quality of
service (0.104,0.125,0.143)
Production based on Six Sigma or Comprehensive Quality Management Program
(0.124,0.149,0.17)
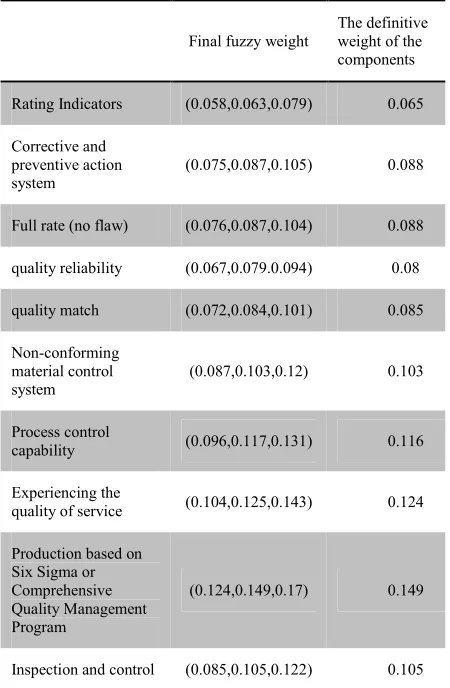
Table 3.The final weights matrix of criteria over the supplier selection
Final fuzzy weight
The definitive weight of the components Rating Indicators (0.058,0.063,0.079) 0.065 Corrective and
preventive action system
(0.075,0.087,0.105) 0.088
Full rate (no flaw) (0.076,0.087,0.104) 0.088 quality reliability (0.067,0.079.0.094) 0.08 quality match (0.072,0.084,0.101) 0.085 Non-conforming
material control system
(0.087,0.103,0.12) 0.103
Process control
capability (0.096,0.117,0.131) 0.116 Experiencing the
quality of service (0.104,0.125,0.143) 0.124 Production based on
Six Sigma or Comprehensive Quality Management Program
(0.124,0.149,0.17) 0.149
Inspection and control (0.085,0.105,0.122) 0.105
Figure 5. The final weights of criteria over the supplier selection
Figure 6. The final weights of options over the supplier selection
Table 4. The final weights matrix of options over the supplier selection
supplier Final fuzzy weight of options
The definitive weight of
the options
Prioritization based on final weight
A1 (0.121,0.164,0.225) 0.167 5 A2 (0.163,0.221,0.302) 0.225 2 A3 (0.187,0.258,0.243) 0.261 1 A4 (0.136,0.189,0.251) 0.19 3 A5 (0.124,0.168,0.227) 0.17 4
Modeling a Multi-period Transportation System for Supplier Selection and Orders Allocation Problem …
36 International Journal of Railway Research (IJRARE)
4.5 Allocating the requested demand volume of factory to suppliers and solving the mathematical model (step 4)
The results of solving the mathematical
model for allocating the orders to selected
suppliers in the previous step is as follows:
Firstly, 10 indicators out of 39 risk indicators were selected as supplier selection by considering supply risk and using a survey of 14 company experts. Then, the supply indicators and suppliers were evaluated and ranked by using Fuzzy ANP method. Three out of five first suppliers were selected in terms of rank in order to supply the items
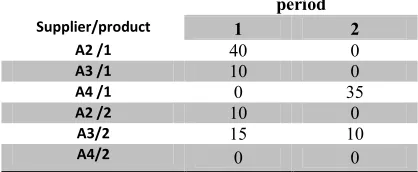
and finally the amount of allocation of each raw material was specified and presented to the suppliers according to the presented mathematical model. The results showed that according to the tables in the two considered periods, a total of 22 units of product 1 and 26 units of product 2 were needed, of which 12 units from product 1 in the first period were supplied by all three suppliers A3 and A2 and A4. 10 other units were allocated to all three suppliers in the second period. 13 units of product 2 were also supplied by A2 and A3 only in the first period while the rest of it was supplied by suppliers A2, A3 and A4 in the second period.
5.
Conclusions
According to the proposed research methodology, an integrated model was developed to analyze and select the most suitable suppliers. The proposed model was a hybrid model simultaneously considering different goals and criteria. Firstly, the steps of decision making technique were described and then the company was investigated. Information about suppliers and risk factors of the company affecting the supply were introduced. Then, the company's suppliers were weighted and ranked by the FANP technique, and the order quantity was allocated to each supplier for two periods and the results were analyzed.
Selecting the appropriate supplier and determining the volume of orders to each supplier have an effective role in improving the efficiency of the economic units, so that the lack of proper supply and timely delivery of the materials required by the organization causes a problem throughout the organization. The present study aimed at evaluating and selecting the suppliers of raw materials and allocating the optimal order quantity to each of them in the company under study. After reviewing the raw materials used in this company, the supply of raw materials was considered due to the importance and
Table 5. Demand rate for two products in two periods of time
Second period First period Demand 10 12 Product 1 13 13 Product 2
Table 6. Allocation in the first period
A4 A3 A2 First period Demand 1 8 3 12 Product 1 0 9 4 13 Product 2
Table 7. Allocation in the second period
A4 A3 A2 Second period Demand 1 8 1 10 Product 1 3 7 3 13 Product 2
Table 8. Material displacement among suppliers
A4 suppliers A3 A2 Supplier/product 0 0 0 /1 A2 0 0 10 /1 A3 0 15 0 /1 A4 5 0 0 /2 A2 0 0 20 A3/2 0 5 0 A4/2
Table 9. The inventories held by suppliers
period
Supplier/product 1 2
0 40 /1 A2 0 10 /1 A3 35 0 /1 A4 0 10 /2 A2 10 15 A3/2 0 0 A4/2
Tehrani and Bozorgi Amiri
International Journal of Railway Research (IJRARE) 37 the full concentration on all quantitative and
qualitative aspects of supplier selection. Here are some suggestions of the future studies in this area:
In order to increase the accuracy and reduce uncertainty in prioritizing the criteria and suppliers and allocating the optimal order quantity to each supplier, it is recommended to mix this model with neural network models and genetic algorithm and then compare to the results of this study. It is suggested to consider the demand for the raw materials of the company as uncertain and study the model as probable. It is recommended to consider the model's main parameters as fuzzy to increase the accuracy of the calculations. The indicators of this study were developed according to the scope of the research and are tailored to the study company. It is recommended to review other similar companies to present a comprehensive model associated with similar organizations and corporations covering all the criteria of the participating companies. It is suggested to test the indicators based on the conceptual model or structural model to identify the supply risk management framework.
References
[1] G. Bruno, E. Esposito, A. Genovese, M. Simpson, Applying supplier selection methodologies in a multi-stakeholder environment: A case study and a critical assessment. Expert Systems with Applications, 43, (2016), pp.271–285. http://dx. doi.org/10.1016/j.eswa.2015.07.016.
[2] M.B. Ayhan, H.S. Kilic, A two stage approach for supplier selection problem in multi-item/multi-supplier environment with quantity discounts. Computers & Industrial Engineering, 85, (2015), pp. 1-12.
[3] F-H Franklin Liu, H-L Hai, The voting analytic hierarchy process method for selectin supplier, International Journal of Production Economics, Vol.53, (2015), pp.43-57.
[4] K. Govindan, S. Rajendran, J. Sarkis, P. Murugesan, Multi criteria decision making approaches for green supplier evaluation and selection: a literature review. Journal of Cleaner Production, 98, (2015), pp.66-83.
[5] W. Min, Topsis-AHP simulation model and its application to supply chain management, World Journal of Modelling and Simulation, Vol.3, No.3, (2007), pp.196-201.
[6] C.T. Chen, C.T. Lin, S.F. Huang, A fuzzy approach for supplier evaluation and selection in supply chain managemen, International Journal of Production Economics, Vol. 102, No.2, (2006), pp. 289-301.
[7] M. Chyuan Lin, M. Chen, A. Chang, Using AHP and TOPSIS approaches in customer-driven product design process, Computers in Industry, Vol.59, No.1, (2008), pp.17-31.
[8] S. Mousakhani, S. Nazari-Shirkouhi, A. Bozorgi-Amiri, A novel interval type-2 fuzzy evaluation model based group decision analysis for green supplier selection problems: A case study of battery industry. Journal of Cleaner Production, 168, (2017), pp.205-218.
[9] O. Kilincci, S.A. Onal, Fuzzy AHP approach for supplier selection in a washing machine company. Expert systems with Applications, Vol.38, No.8, (2011), pp.9656-9664.
[10] S. Samoilenko, K.M. Osei-Bryson, Using Data Envelopment Analysis (DEA) for monitoring efficiency-based performance of productivity-driven organizations: Design and implementation of a decision support system. Omega, Vol.41, No.1, (2013), pp.131-142.
[11] M. Azadi, S.M. Mirhedayatian, R.F. Saen, M. Hatamzad, E. Momeni, Green supplier selection: a novel fuzzy double frontier data envelopment analysis model to deal with undesirable outputs and dual-role factors. International Journal of Industrial and Systems Engineering, Vol.25, No.2, (2017), pp.160-181.