61
Available online at www.ijiere.com
International Journal of Innovative and Emerging
Research in Engineering
e-ISSN: 2394 - 3343 p-ISSN: 2394 - 5494
Solution To Conventional Traffic Problems On Old N.H.No 08
Rana ChitrangM.
1, Mr.N.P. Soni.
2and Patel Mehang V.
31 Student, Civil Engg.Dept.S.V.M.I.T, Bharuch and India, [email protected] 2 Asst. Prof., Civil Engg. Dept., S.V.M.I.T., Bharuch, India, [email protected] 3 Student Civil Engg.Dept. S.V.M.I.T, Ankleshwar and India, [email protected]
ABSTRACT:
National highway number is about 4-6 laneway connecting Mumbai to New Delhi. It is about 2,807km and connecting main develop city like Surat, Baroda, Ahmedabad, Jaipur, Ajmer, Udaipur. British had started work to build “GOLDEN BRIDGE” in 1877 and completed in 1881, which is part of national highway no 08. From till 1881 to till date it had complete his structure decade year. So the government had decided to construct the parallel bridge.
The golden bridge is too old and not so wide it is just one way but it is used in two way Bharuch to Ankleshwar and Ankleshwar to Bharuch. And traffic speed is limited to max 40kmph and after approaching on bridge the road is narrow to drive the vehicle. It causes heavy traffic for hours and both the way are distrusted.Planning for a new bridge has been proposed and government had perhaps the work had started by the “RANJIT CONSTRUCTION”, so people are waiting for the time when they get less traffic on this bridge.
Keywords:Bridge, Highway, Traffic, Vehicle, Speed, Accident, Survey
I.
I
NTRODUCTION The traffic problem and waste of valuable time of people due to traffic on the national highway no 08. The heavy
traffic volume only perceptible the people passing through golden bridge & the inhabitant of ankleshwar and Bharuch. It is well new bridge is being constructed beside the golden bridge is immediate required to console the people of ankleshwar and Bharuch & total economic, transportation & industrial development in ankleshwar, Bharuch, dahej, etc.
The 130-year-old historical golden bridge over Narmada river, which connected Bharuch and ankleshwar, has
turned golden literally. It include painting, change of bolts, foundation & pillar of the bridge which cost nearly 1.75 crore. The bridge has withstood many floods and natural disaster like earthquake and provides daily load of the transportation from Bharuch to ankleshwar. From golden bridge to ABC cross road there is full rush of the traffic during the day time. At same distances and area there are five academic colleges, hospital & hotels which result more have rush on the old national highway no. 08. Number of pilgrims, college’s students, etc. are travelling on this road which result increasing traffic day by day. Another hand problem on this road is that, the traffic of city area like shaktinath, panchbatti, sarvan chokdi are diverted by the newly fly over bridge named “RUSHIKRUS BRIDGE” in the day time.
II.
Study Area
I have recognized a major problem of a stream of heavy traffics in the city Bharuch. Over a golden bridge to the
ABC chokdi line, an intensity of vehicle transportation is very high, this is a reason of heavy traffic on this stream. Most of the students who are using this path for transportation face the traffic problem and get the time lost. Due to this, to reduce the traffic and maintain a flow line of transportation vehicle without any resistance, a project becomes more reliable and useful in the future. As we have found out the project work relate to the traffic in transportation at the collage road, Bharuch. We utilized our time and focused over the type of vehicle and the number of vehicle passes through the golden bridge to ABC root circle. We also did an analysis of the how many of students are facing this traffic problem. We analyzed the area surveyed across the Bharuch and found the most
affected areas and its reasons. We have found the numbers per hour’s vehicle transportation of different kinds
62
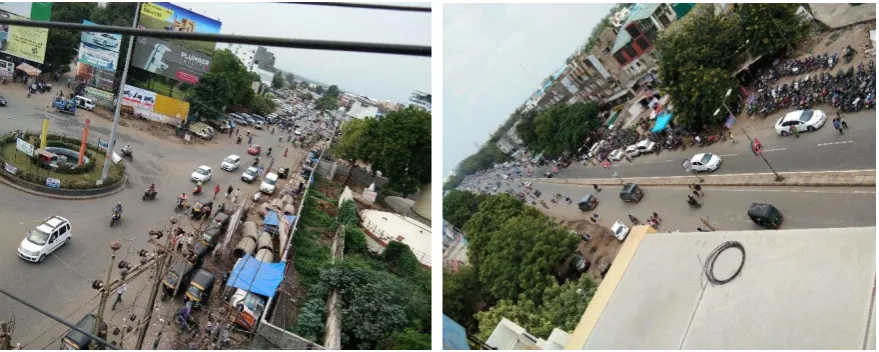
Figure 1: Old
National
highway No. 8 Golden Bridge to ABC Cross Road [Source: Google Map]Figure
2 -3 Traffic on Golden Bridge
63
Sources of Data on Exposure to Accident Involvement Risk:-
Exposure data contain information on the number and characteristics of the units at risk (irrespective of traffic
accident involvement). Depending on the analysis level, the corresponding data can be obtained either from different routine sources or from special-purpose surveys.
Sources for risk studies at the trip level:
· mobility surveys (trip diaries)
Sources for risk studies at the person- or vehicle-year level:
· population census data
· vehicle registration data
· travel surveys
·
vehicle mileage surveysIII.
Aim & objectives
The aim of our project is to study traffic congestion related issue across Bharuch city, to point out the area that
are prone to traffic problems and to come up with solution for it so, our group had taken the area from ABC chokdi to golden bridge.
A. Specific objectives:
The following specific objectives were addressed by this study:
Traffic congestion points will show the most affected area and will help to work faster for it.
Reduced traffic will save time and fuel consumption and hence will result in reduced expenditure.
Reduced traffic will result in people spending less time exposed to polluted gases and traffic incidents.
Decrease in traffic will result in speedy movement of vehicles which will eventually result in increase in
productivity and growth of nation.
B. Geography of Bharuch
Bharuch is located at 21.7’ N to 72.97’ E. It has an average elevation of 15 meter (149feet). The damming of
the Narmada caused the original post facilities to close the nearest port is now dahej.
Bharuch has tropical savanna climate moderated by an Arabian sea the summer begin in early march and last
until June. April and may are hottest climate, monsoon begin in late June and at end of December end with February temperature around 23’c.
IV.
Various transportation surveys:
The various types of transportation survey to be carried out for planning process are:
Origin and destination
Traffic survey
Screen line survey
Commercial vehicles survey
Taxi survey
Public transport surveys
Parking surveys
Pedestrian survey
A. Origin and Destination Survey
The origin and destination study is carried out mainly to know the origin and destination of various vehicles.
In this study, the data collected are, number of vehicles, their origin and destination, number of passengers in each vehicle, route etc.
B. Traffic Survey
Mid-block counts are carried out on a weekly an all busy roads to study the density of traffic frequently for
about 16 hours in order to assess the total daily volume and their composition and peaking pattern as well as their direction. The vehicle counts are generally made and recorded at 15 minutes’ intervals. The volume ratio of road stretches can be obtained from these data in order to help in planning long tern strategies.
C. Screen Line Survey
Screen line survey refers to volume count conducted at different locations in the study area at crossings along
natural barrier like rivers, canals, and railway lines, the main purpose of this survey is to justify of models developed.
D. Commercial Vehicles Survey
Commercial vehicle surveys are conducted to obtain information on journeys made by all commercial vehicles
64
E. Taxi survey
Taxi survey are usually carried out in large urban areas, having a sizeable amount of travel by taxis.
F. Public transport survey
In order to assess the number of bus passenger passing through an external column, the survey can either be
by direct interview with the passengers by issuing post card questionnaires. Direct interview is likely to result in large delays and require a large number of interviews
G. Passenger Car Unit
Different classes of vehicles such as car, buses, tracks, auto, cycle, etc. are found to use the common roadway
facilities without separation on most of the roads. Such a traffic flow is called Heterogeneous traffic flow.
V.
Data Collection & Analysis
Table 1:
Traffic Data Analysis from Golden Bridge to ABC Cross Road [Source: Field Survey
Data Collection]
Time
2 Wheeler
Auto Rickshaw
Passenger Car
8:00 to 9:00 399 53 341
9:00 to 10:00 465 129 372
10:00 to 11:00 454 126 327
11:00 to 12:00 420 114 368
12:00 to 13:00 353 106 273
13:00 to 14:00 427 141 370
14:00 to 15:00 485 112 363
15:00 to 16:00 267 92 315
16:00 to 17:00 273 106 306
17:00 to 18:00 283 115 250
18:00 to 19:00 253 114 302
19:00 to 20:00 223 124 301
20:00 to 21:00 177 29 283
21:00 to 22:00 129 17 272
22:00 to 23:00 127 22 297
23:00 to 0:00 132 12 229
0:00 to 1:00 56 22 262
1:00 to 2:00 33 11 85
2:00 to 3:00 22 5 54
3:00 to 4:00 18 6 44
4:00 to 5:00 54 11 55
5:00 to 6:00 54 35 157
6:00 to 7:00 82 39 176
65
Figure No. 6 Traffic Data Analysis From Golden Bridge To ABC Cross Road
[Source: From Actual Field
Survey Data Collection]
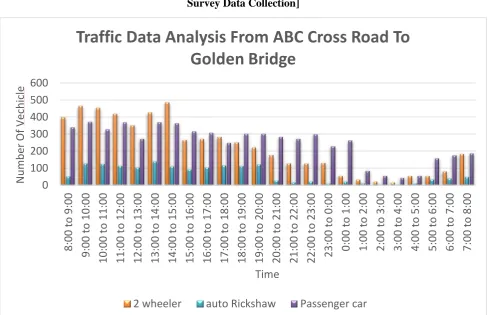
Figure No. 7
Traffic Data Analysis From ABC Cross Road To Golden Bridge
[Source: From Actual Field
Survey Data Collection]
0
100
200
300
400
500
600
8:
00
t
o
9:
0
0
9:
00
t
o
10
:00
10
:0
0
to
11
:0
0
11
:0
0
to
12
:0
0
12
:0
0
to
13
:0
0
13
:0
0
to
14
:0
0
14
:0
0
to
15
:0
0
15
:0
0
to
16
:0
0
16
:0
0
to
17
:0
0
17
:0
0
to
18
:0
0
18
:0
0
to
19
:0
0
19
:0
0
to
20
:0
0
20
:0
0
to
21
:0
0
21
:0
0
to
22
:0
0
22
:0
0
to
23
:0
0
23
:0
0
to
0:
00
0:
00
t
o
1:
0
0
1:
00
t
o
2:
0
0
2:
00
t
o
3:
0
0
3:
00
t
o
4:
0
0
4:
00
t
o
5:
0
0
5:
00
t
o
6:
0
0
6:
00
t
o
7:
0
0
7:
00
t
o
8:
0
0
N
u
mb
er
Of
V
eh
ic
les
Time
Traffic Data Analysis From Golden Bridge To
ABC Cross Road
2 wheeler
auto Rickshaw
Passenger car
0
100
200
300
400
500
600
8:
00
t
o
9:
0
0
9:
00
t
o
10
:00
10
:0
0
to
11
:0
0
11
:0
0
to
12
:0
0
12
:0
0
to
13
:0
0
13
:0
0
to
14
:0
0
14
:0
0
to
15
:0
0
15
:0
0
to
16
:0
0
16
:0
0
to
17
:0
0
17
:0
0
to
18
:0
0
18
:0
0
to
19
:0
0
19
:0
0
to
20
:0
0
20
:0
0
to
21
:0
0
21
:0
0
to
22
:0
0
22
:0
0
to
23
:0
0
23
:0
0
to
0:
00
0:
00
t
o
1:
0
0
1:
00
t
o
2:
0
0
2:
00
t
o
3:
0
0
3:
00
t
o
4:
0
0
4:
00
t
o
5:
0
0
5:
00
t
o
6:
0
0
6:
00
t
o
7:
0
0
7:
00
t
o
8:
0
0
N
u
mb
er
Of
V
ech
ic
le
Time
Traffic Data Analysis From ABC Cross Road To
Golden Bridge
66
Table 2: Traffic Data Analysis from ABC Cross Road to Golden Bridge [Source: Data Collection Field
Survey]
Time 2 Wheeler Auto Rickshaw Passenger Car
8:00 to 9:00 339 53 269
9:00 to 10:00 598 131 379
10:00 to 11:00 514 116 319
11:00 to 12:00 599 121 336
12:00 to 13:00 405 120 294
13:00 to 14:00 536 122 495
14:00 to 15:00 381 106 377
15:00 to 16:00 266 89 320
16:00 to 17:00 258 93 282
17:00 to 18:00 225 115 282
18:00 to 19:00 246 114 306
19:00 to 20:00 229 116 343
20:00 to 21:00 154 23 369
21:00 to 22:00 77 17 243
22:00 to 23:00 182 33 267
23:00 to 0:00 214 22 306
0:00 to 1:00 176 31 212
1:00 to 2:00 67 17 139
2:00 to 3:00 38 7 84
3:00 to 4:00 19 12 52
4:00 to 5:00 33 22 97
5:00 to 6:00 129 53 164
6:00 to 7:00 120 72 171
67
Figure no. 8 Frequency analysis of Number of vehicles per hour passing per day [Source: From Actual
Data Collection]
VI.
Types of Traffic Counts
It is essentials to know the magnitude of traffic data required or to be collected, which will then determine its
quality and type of vehicle classification to be adopted. Traffic counting falls in two main categories, namely; manual counts and automatic counts.
A.
Manual Counts:
The most common method of collecting traffic flow data is the manual method, which consist of assigning a
person to record traffic as it passes. This method of data collection can be expensive in terms of manpower, but it is though necessary in most cases where vehicles are to be classified with a number of movements recorded separately, such as interactions.
B.
Automatic Counts:
The detection of vehicular presence and road occupancies has historically been performed primarily on or near
the surface of the road. The utilization of new electromagnetic spectra and wireless communication media in recent year, has allowed traffic detection to occur in an unavoidable fashion, at locations above or to the side of the roadway.
The most commonly used detector types are:
Pneumatic tubes
Inductive loops
Weigh-in-motion sensor types
Micro-milli meter wave radar detectors
Video camera.VII.
Traffic Problems:
Wasting of time of motorists and passengers from people travelling to golden bridge to ABC cross road. As
a non-productive activity for most people, congestion reduces regional economic health. Delays, which may result in late arrival in colleges, emergency to reach in accident time, for employment, meetings and resulting in lost business, disciplinary action. Wasted fuel increasing air pollution and carbon dioxide owing to increased idling, acceleration and braking.
-500 0 500 1000 1500 2000 2500 3000 3500 8 9 9 1 0 1 0 1 1 1 1 1 2 1 2 1 3 1 3 1 4 1 4 1 5 1 5 1 6 1 6 1 7 1 7 1 8 1 8 1 9 1 9 2 0 2 0 2 1 2 1 2 2 2 2 2 3 2 3 0 0 1 1 2 2 3 3 4 4 5 5 6 6 7 7 8 N o. of V e hi c le s
Hour of Day
Figure : Daily and Hourly Variation (Distance in Km : 2.2 KM)
68
VIII.
Emergencies:
Blocked traffic at GOLDEN BRIDGE to ABC Cross Road may interfere with the passage of emergency
vehicles travelling to their destinations where they are urgent needed.
IX.
C
ONCLUSIONS Problem can be solving by encouraging motorists to re-time their trips and divert their expensive road space
in full use for a greater number of hours per day.
The standard response to traffic problem in to expand, but the road space somehow, it perhaps by widening
and existing road or adding a BRIDGE or Tunnel.
Over a golden bridge to the ABC chokdi line, an intensity of vehicle transportation is very high, this is a
reason of heavy traffic on this stream.Most of the students who are using this path for transportation face
the traffic problem and get the time lost. Due to this, to reduce the traffic and maintain a flow line of transportation vehicle without any resistance, a project becomes more reliable and useful in the future.
It has been found that the project work relate to the traffic in transportation at the collage road, Bharuch.
The major focus was over the type of vehicle and the number of vehicle passes through the golden bridge to ABC root circle.
As a prerequisite for applying well established epidemiological methods for risk factor assessment in traffic
accident causation research, a new conceptual framework for accident involvement risk studies has been developed in this report.
Under this framework, road user trips are considered to be the basic “units at risk” and a distinction is made
between accidental and non-accidental trips
X.
A
CKNOWLEDGMENT The authors are expressing their sincere thanks to Prof. N. P. Soni for guiding and motivating for solving the
critical traffic and accident issues in the area under consideration.
The management of Shri S’ad Vidya Mandal Institute of technology is also highly acknowledged for their
extended help in finishing this study.
We are heartily thankful to the traffic police department of Bharuch city and officials of the Bharuch
Municipal Corporation for their help in providing the data for the detail analysis.
REFERENCES:
[1] Heinz Hautzinger, Claus Pastor, Manfred Pfeiffer, November 2007 Analysis Methods for Accident and Injury Risk
Studies
[2] Carr, B.R.A. (1969): A statistical analysis of rural Ontario accidents using induced exposure data. Accident
Analysis and Prevention, 1(4): 343-357.
[3] Agresti, A. (1996): Introduction to Categorical Data Analysis. New York: Wiley
[4] Davies, G.A. and Y. GAO (1993): Statistical methods to support induced exposure analyses of traffic accident
data. Transportation Research Record, 1401, Washington: Transportation Research Board.
[5] Danish road traffic accident investigation board (2014) why do road traffic accidents happen?
![Table 2: Traffic Data Analysis from ABC Cross Road to Golden Bridge [Source: Data Collection Field Survey]](https://thumb-us.123doks.com/thumbv2/123dok_us/8876209.1817023/6.595.69.531.110.581/table-traffic-analysis-golden-bridge-source-collection-survey.webp)
![Figure no. 8 Frequency analysis of Number of vehicles per hour passing per day [Source: From Actual Data Collection]](https://thumb-us.123doks.com/thumbv2/123dok_us/8876209.1817023/7.595.55.559.59.359/figure-frequency-analysis-number-vehicles-passing-source-collection.webp)
