ISSN: 2333-6064 (Print), 2333-6072 (Online) Copyright © The Author(s). All Rights Reserved. Published by American Research Institute for Policy Development DOI: 10.15640/jfbm.v3n2a3 URL: http://dx.doi.org/10.15640/jfbm.v3n2a3
Macroeconomic Variables, Stock Market Bubble, Meltdown and Recovery:
Evidence from Nigeria
Mike Ozemhoka Asekome
1, (Ph.D) & Abraham Oni Agbonkhese
2, (Ph.D)
Abstract
The study attempts to empirically examine the macroeconomic variables that contributed to the Nigeria stock market bubble, its consequent melt down and its gradual recovery during the period under review and particularly between 2007 to 2013. Relying on the Ordinary Least Square (OLS) regression technique, the study examined the joint impact of gross domestic product (GDP), money supply (M2), exchange rate (EXR),
capacity utilization (CAU), and inflation (INF) on All Share Index (ASI). The result shows that the coefficients of gross domestic product and money supply were statistically significant while the remaining three: exchange rate, capacity utilization and inflation were not significant. The paper observes that the post melt down macroeconomic policies including banking sector reforms contributed to the gradual recovery of the stock market. The paper therefore recommends the need for policies that could further strengthen and stabilize the banking sector, ensure low but steady interest rates, favourable exchange rate, low inflation and consistent policy environment that could boost a steady growth in the real sector.
Keywords: ‘Macroeconomic Variables’, ‘Nigeria Stock Market’, ‘Bubble’, Melt down’and Recovery’.
Introduction
Financial markets play significant roles in the economy of any country especially in the mobilization, allocation, re-allocation as well as the pricing of capital resources through the various stages of financial intermediation. The success of any financial system depends on its level of efficiency. Efficiency is literally and simply a measure of the output and input ratios within a given unit of time. Financial capital and human resources are never limitless in availability as well as in opportunity cost. The definition of market efficiency depends on the assumption on what constitutes the type of market as well as the types of assets, but most of the definitions in financial markets are centered on the availability of the necessary information for financial and investment decisions. Capital market efficiency can be likened to the assumptions of perfect competition in commodity markets involving large number of products, free entry and free exit, large number of players such that the action of any particular player does not affect significantly the activities of others, transactions costs are minimal or non-existent and that market players act in rationality.
Added to the above, the efficient market hypothesis further assume rapid adjustment of security prices to the inflow of relevant new information (Reilly, 1989), that all relevant available public information influence the prices of traded securities (Samuels and Wilkes, 1980), that there is rapid response to any relevant new information (Brockington, 1980). Reilly (1979) described an efficient capital market as one where (i) there is a large number of profit maximizing participants, (ii) new information regarding securities adjusts security prices rapidly to reflect the effect of the new information.
1 Lecturer, Department of Economics, Banking and Finance, Benson Idahosa University, Benin City, Edo State, Nigeria.
[email protected], Tel 234 8023402406
Thus an efficient market is one in which security prices adjust rapidly to the infusion of new information and in which current stock prices fully reflect all available information including the risk involved (Keilly, 1979 and Fama, 1970).
Price movement represented in theory by the random walk hypothesis is a natural feature of stock markets but a stock market crash or melt down occurs when prices of a majority of the stocks that are unusually high and subsequently exhibit sharp decline within a short period of time. It results in a sharp drop in the stock market index as well as severe losses on the part of stockholders. Extreme variations of stock prices not consistent with the fundamentals of the random walk hypothesis negates the basic principles of market efficiency and are thus not compatible with the models that successive stock prices are not serially correlated. They indicate market risk and uncertainty. Such situations are usually triggered off more with investors behavior rather than market fundamentals, because rather than being rational, noise trading, herds behavior and bandwagon effect usually over shadow market fundamentals (Bailey, 2005). This portrays market inefficiency which in extreme cases leads to stock market price distortions, meltdown and eventual collapse. Another non-fundamental factor that may lead to stock market inefficiency is style investing in new fashionable businesses such as ICT which resulted in the dot-com bubbles of the early 1990s (Barbers and Shleifer, 2003). Apart from fundamental and behavioural factors, macroeconomic variables including government monetary policy thrusts as well as global co integration factors could also impact on stock market performance especially in developing countries like Nigeria.
This study aims at determining the impact of macroeconomic variables on stock market in Nigeria vis-à-vis the market’s bubble, burst, and its gradual recovery most particularly between the period 2007 to 2013. The study covers a period of 24 years from 1990 to 2013 during which the Nigeria stock market witnessed a remarkable market bubble and eventual melt down when the market capitalization of N12.6 trillion during the month of march 2008, dropped to N6.96 trillion in the month of December and crashed to N4.48 trillion in the month of march, 2009. However, as at the end of December, 2013, the market has recovered gradually with market capitalization well over the N13.6 trillion. The study relied on secondary data as source. Following the introductory section is the review of literature in section two.
2.0 Literature Review
2.1 Stock Market Liberalization and Volatility
As several developing countries began to open up their markets through financial system reforms and liberalization, there arose the research question to the relationship between liberalization and stock market volatility. Research shows that there have been mixed results as evidenced from the observed volatility in some emerging markets which in some cases experienced some financial crises emanating from liberalization like the Mexican, Asian and Russian financial crisis (Miles, 2002). Some of the a priori expected benefits of openness have been compromised as evidenced from increasing variances of stock returns and rising cost of capital which have implications for portfolio planning. As financial market reforms and globalization of financial markets are taking place in developing countries like Nigeria the need for critical research on the impact of financial sector reforms and openness on stock market returns and volatility has become very relevant.
Studies by Bekaert and Harvey, 1997, De Santis and Imrohoroglu (1997), Inclan, Aggarwal and Leal (1997), Kim and Singal (2000) and Levine and Zervos (1998) presented conflicting results either due to the type of the models or methodologies adopted or to other none fundamental variables which resulted in either increase in volatility, decrease in volatility or no effect on the returns and volatility. (Allen, Golab and Powell, 2010).
While Aggarwal, Inclan and Leal (1997) used the General Autoregressive conditional Heteroskedasticity (GARCH) to examine volatility, they did not extend their test to the impact of stock market liberalization. Tests carried out by Kim and Singal (2000) relying on the ARCH and GARCH models revealed marginal decreases in aggregate volatility following market liberalization. However, results of parametric and non-parametric GARCH models by De Santis and Imrohoroglu (1997) splitting sample data at a particular period using the second batch of data sample as a proxy for market opening for 5 countries showed that volatility was greater for three out of the five countries before and after the proxied market opening. The impact of liberalization on volatility has also been studied by the use of event study methodologies, by examining the individual effects of liberalization on volatility and applying dummy variables to represent the period before and after liberalization (Kwan and Reyes 1997). Further studies using event studies were carried out by Kim and Singal (1993) and Schwert (1989) to obtain volatilities arising from liberalization using monthly data. Their findings show significant changes in the mean volatility related to such events. Many other event studies on the impact of liberalization on volatility show evidence of mixed results. While studies by Jayasuriya (2002), Levine and Zervos (1998) indicated increase in volatility, the studies by Kim and Singal (2000), Bekaert and Harvey (1997) and Kwan and Reyes (1997) showed decrease in volatility. However, event studies by De Santis and Imrohoroglu (1997) and Kim and Singal (1993) show no relationship within 12 months of introducing liberalization (Mana and Reddy, 2007 p.11).
2.2 Causes of Asset Price Volatility
According to Awan, Bukhari, Khakwan and Ghufran (2010), stock market volatility may be caused by several factors some of which are: news on financial information in the media, financial analysts forecasts, performance reports of quoted companies such as dividend effects, macroeconomic policies and changes in related variables, non-fundamental factors that are common in behavioral anomalies including calendar effect, style investment, noise trading and inside information and stock market manipulation, and changes in the political environment. The macroeconomic variables include changes in the prices of goods, money supply, interest rates, real sector activities, exchange rates, oil prices as well as stock market indices (Mana and Reddy, 2007). Fama (1965) and French (1980) find a relationship between greater trade volume and greater price movement which also contributes to asymmetric volatility. In their study, French and Roll (1986) observed that volatility is associated with trading hours and affected by the arrival of new information that affects asset prices. Over confidence of some investors has also been identified as a possible cause of asset price volatility (Shiller 1998) which in some cases lead to speculative bubbles and crash as witnessed in the 1987 U.S. stock market crash. Shiller (1987) observed that in spite of negative signs noticed towards the bubble priming before the crash, some investors continued to over play on their confidence. This would imply that over confident investors tend to ignore prior information living in a gambler’s fallacy (Awan et al 2010). Shiller (1979) therefore concludes that volatility leading to extreme bubbles and melt down could be attributed to investor psychology or behavioral irrationality.
2.3 Economic Variables and Volatility
Some economic factors that have been found to influence volatility were identified by Bekaert and Harvey (1997) who used aggregated cross-sectional time-series model with control variables such as: level of asset concentration, stock market development, microstructure and macroeconomic variables such as: inflation, interest rates, exchange rate, industrial production index, etc. In a related study, Xing (2004), added the average level of investors’ education as a controlling variable and finds that there is a negative relationship between level of education and volatility. This implies that educated investors behave more rationally in investment decisions.
2.3.1 Inflation and Stock Market Volatility
By means of the Generalized Autoregressive conditional Heteroskedasticity (GARCH) model, Aliyu (2010), shows evidence of time varying volatility on stocks returns in Ghana and Nigeria. The results like those obtained in some other emerging countries also show that inflation is one of the determining factors for stock market volatility in both Ghana and Nigeria. Aliyu (2010) in his analysis used monthly data from March 1990 to March 2010. Mala and Reddy (2007), also using the ARCH and GARCH econometric models for the period 2001-2005 finds the presence of stock market volatility on Fiji’s stock market. When the volatility of the stock returns were regressed against the interest rates, the result showed that interest rate changes have significant effect on stock market volatility in the Fiji stock exchange market.
2.3.2 Foreign Exchange Rate and Volatility
The rate of foreign exchange affects stock prices and volatility through transmission mechanism across international financial markets as well as through co-integration and contagion effects (Edwards and Samuel, 2001; Bekaert and Harvey, 2002 and 2003). The volatility transmission effect through foreign exchange markets may vary among sectors of the economy and a good knowledge of the relative effects can form a basis for portfolio selection and diversification across countries Karoui (2006). Studies by Karoui (2006) using GARCH model to estimate stock returns and exchange rate volatility for a set of emerging markets for monthly data between 1997 and 2003 revealed that there were significant relationship between foreign exchange volatility and stock returns.
2.4 History and Characteristic of Stock Market Bubbles and Crashes
Stock market bubbles and melt downs date back to the speculative trading on tulip flower bulbs popularly described as Tulipmania from late 1636 to February 1637. The Mississippi scheme in France and the South Sea bubbles in England from 1719-1920 left thousands of investors bankrupt (Mackays, 1841). They were said to have been caused by prospects for quick and high profits which attracted risk-taking investors and induced prices to rise astronomically but only to suddenly nose-dived when shareholders attempted to realize their capital gains by off-loading parts of their holdings. Other stock market crashes include the Wall Street Crash of 1929, the New York Stock market crash of 1987 and the stock market bubble of 1999-2000 popularly referred to as the dot. com bubbles. There was also the American stock market bubble of 1920s that resulted in the great depression, the Dot-Com bubble of the late 1990s, the Taiwanese stocks bubble of 1987 and the Japanese stocks bubble of the 1980s, many of which were caused by speculative actions associated with emerging new technologies of the internet and e-commerce etc.
Brunnermeier (2001), posited that liquidity and free trading elevates share prices in an economy with high liquidity and low interest rates. Such a situation could develop a bubble. Theoretically, a bubble is said to occur if increase in prices consistently exceed 50% within a given period of time preceding the bubble crash. In such a situation, stock market prices are usually overvalued. Janszen (2008), described a bubble as the huge spike in asset prices that results from a perverse self reinforcing belief system, a fog that clouds the judgment of all, but the most aware participants in the market. He added that the bubble ‘is the result of that financial madness, seen only when the fog rolls away. Thus, those who are reaping the temporary benefits of the bubble would rarely abandon the madness until it is all over (a crash).
Friedman and Abraham (2006), posited that bubbles and crashes manifest occurrence in extended models which incorporates endogenous market risk premium that are based on investors’ historical losses and constant gain learning, and that when losses have been small for a long time, asset prices inflate as portfolio managers continue to add more riskier portfolios. They added that close to the point of saturation, slight losses can trigger a crash due to widening risk premium acceleration and decline in asset price. They concluded that bubbles do not repeat often as well as crash as people become cautious and slow to reaction if similar episodes were to occur.
However, some economists do not believe in the hypothesis of bubbles. They argue that financial markets are most often in equilibrium and in such cases, excess price has always been found to be zero, basing their arguments on the Netherlands experience in the 17th century which they described as mere unusual deviation in the fundamental
value (Garber, 1969). Their arguments seem to be weakened by the fact that mere unusual situations within normal distributions cannot be so sporadic in which case the stock market is not likely to witness a crash. Therefore, it can be argued that stock market bubbles seem to negate both the Random Walk Hypothesis (RWH) and thus the Efficient Market Hypothesis (EMH). This is because price movement rather than being in random are either on sharp upward when the bubble is priming or in sharp downward trend prior to the occurrence of a crash. According to Kindleberger (1991, p.20), ‘high prices that do not crash are not regarded as a bubble’. A major characteristic of bubble therefore is crash. Other occurrences are mere depressions.
2.5 Factors that Contributed to the Stock Market Bubble in Nigeria (2007-2008).
Macroeconomic policy measures and global exogenous factors contributed greatly to the Nigerian capital market bubble. The former was traceable to the call on banks in 2004 to increase their minimum capital base to 25 billion naira by December, 2005. This led to most banks approaching the capital market to source funds to shore up their capital and subsequently created awareness and stock market sensitization to all and sundry. This was the period when the price of crude oil was going up arising from the Middle East war in Iraq which contributed greatly to high foreign exchange earnings with attendant nationwide liquidity in the economy. The pending national general elections that were to follow, spurred the economy with the ejection of huge cash usually associated with pre election periods (2006-2007) which further led to increased government spending, access to liquidity for banks, individuals, corporate organizations and the public at large.
In spite of the large number of new capital issues and capital market floatation, the market was insatiable and there was a huge demand gap making securities to be oversubscribed. The period also witnessed attractive corporate profitability and steady growth in dividends payments and lots of script issues. The successful political transition,(2007), coupled with the stronger banks(at least in terms of liquidity), that emerged after the consolidation, (2006-2007), rising crude oil prices at the international markets, accumulation of huge external reserves, all combined to boost the Nigerian economy both at home and abroad. This enhanced a significant increase in investor confidence and a big morale booster on the public perception of the country’s capital market which eventually witnessed unprecedented growth evidenced through a sudden rise of market capitalization from N5.12 trillion at the end of year 2006, to N12.640 trillion as at march, 2008 when the Nigerian All Share Index rose from 33,358 to 66, 371.(CBN:2013)
Several banks resorted to the capital market to raise funds most of them giving loans to investors to purchase their stock. Evidence from the Nigerian All Share Index (ASI), shows that the index which had risen through 57,990 in December of 2007 to 58,580 at the beginning of year 2008 with a market capitalization of N10.284 trillion raised to 66,371 with market capitalization of N12.640 trillion on March 5, 2008 (Aluko, 2008). Suddenly the market was over flooded with stocks.
2.6 The Bubble Burst
At the height of the bubble, the stock market became saturated. The global financial crisis that started in the United States soon impacted on the Nigeria capital market as there was massive divestment by foreign investors who needed to off load their securities for cash repatriation. Almost at the same time, prices of crude oil suddenly nose-dived crashing from about $150 to less than $50 per barrel as a result of the global financial meltdown. Prices of stocks in the market started to decline. The weeping child of circumstance; the ‘Nigerian naira’ could not resist the trend and thus bowed to the global pressure to depreciate quickly against the major foreign currencies. Banks became uncomfortable as stocks used as security for stock margin loans fell far below expectation. The urge for the banks to quickly sell to reduce their investment losses further depressed the market resulting on investor’s apathy towards the market. This led to a tight liquidity crunch and then credit to the private sector declined drastically.
Within the following seven months, the index declined to 42,207 (36 % decline) in October 2008 and subsequently to 19,000 with market capitalization declining to N4.5 trillion in march 2009. This meant that the market had lost over N8 trillion within less than one year. The ultimate result was the collapse of the Nigeria stock market coupled with the crystallization of a huge portfolio of non performing and toxic financial assets that were mainly created through stock market margin loans.
2.7 Impact on the Nigerian Money and Capital Markets.
The major fall out was the serious depletion of capital and the attendant problem of loss of investors’ confidence which Soludo (2009), described as confidence trap which led to the loss of several trillions of naira as evidenced from the drop in the market capitalization from N12.640 trillion at the middle of 2008 to as low as N4.5 trillion during the first quarter of 2009. There was also a serious pressure on the demand for foreign exchange market coupled with capital flight through currency re-domiciliation that were intended to take advantage of global financial distortions,(Olajide,2009).
The greatest direct impact on the financial markets especially on banks and stock broking firms was the hard core toxic assets created through stock market margin loans whose default resulted directly from crashed prices. This greatly impacted on the liquidity position of banks and a high credit squeeze on the economy as the banks and other financial institutions were experiencing difficulties in the recovery of the margin loans which no doubt had implication for the money market.
2.8 The Gradual Recovery of the Nigeria Stock Market
Evidence from the literature review in this paper indicates that the markt bubbles and eventual melt down either by coincidence or through co integration were the impact of the global financial crisis as well as macroeconomic variables that greatly affected the banking sector that constitutes over 60% of the Nigeria stock market capitalization. Thus the apex monetary authorities in Nigeria focused in addressing the banking sector by a bail out in which the Central Bank of Nigeria injected over N60 billion as well making policies that were targeted at sanitizing the banking sector. The Government of the Fedreation also introduced various financial stimuli to boost the real sector especially the small and medium enterprises such as the N200 billion Commercial Agricultural Loan Scheme, strengthening Corporate Governance Code of Conduct in financial istitutions as well as the Agricultural Transformation Agenda which could have impacted on various sectors of the economy.
3.0 Research Methodology and Model Specification
The research method adopted in this study is the Ordinary Least Squares (OLS). The need for this technique is that, it is used to estimate the parameters of a single - equation model. Besides, the estimator yields estimates that are best, linear, and unbiased estimators (BLUE) with the desirable properties of unbiasedness, consistency and efficiency. However, these properties are made possible after all the assumptions of the OLS method have been fulfilled. The research will rely mainly on secondary data. The data sources include: Central Bank of Nigeria (CBN) Annual Reports and Statement of Accounts, Statistical Bulletins and the Nigerian Stock Exchange (NSE) Factbook of various issues.
3.1 Model Specification
From the research methodology and supported by the major empirical evidence of Bekaert and Harvey (1997), our model shall contain All Share Index (ASI), and the growth of the capital market which represents the Nigerian Stock Exchange (NSE) value index as the dependent variable; while gross domestic product (GDP), money supply (M2), exchange rate (EXR), capacity utilization (CAU), and inflation (INF) are the independent
macroeconomic variables.
Therefore, the equation specified for estimation is in the following functional form:
ASI = f (GDP, M2, EXR, CAU, INF)……… (3.1)
Equation (3.1) can be transformed into an econometric model as follows:
0 1 2 2 3 4 5
ASI
GDP
M
EXR
CAU
INF
……….. (3.2)
Where:
0= Intercept;
1-
5 = Coefficients of the regressors as defined above;
= Error term.A Priori :
1,
2,
3,
4 > 0;
5 < 0 .4.0 Analysis of Result
After estimation, the next important step in empirical econometrics is the interpretation of the regression results. This enables the researcher to assess how successful the estimation exercise was and hence, judge the usefulness of the estimated coefficients for policy analysis. Interpretation of regression results of this nature will be holistic, covering economic theory, statistical analysis and econometric issues. The result is, however, summarized in table 4.1 below.
4.1 Regression Result
The dependent variable is All Share Index (ASI) and 24 observations used for estimation from 1990 – 2013.
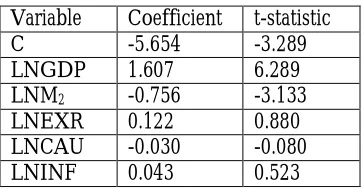
Table 4.1
Variable Coefficient t-statistic
C -5.654 -3.289
LNGDP 1.607 6.289
LNM2 -0.756 -3.133
LNEXR 0.122 0.880
LNCAU -0.030 -0.080
LNINF 0.043 0.523
From the above table, we attempt to examine the joint impact of gross domestic product (GDP), money supply (M2), exchange rate (EXR), capacity utilization (CAU), and inflation (INF) on all share index (ASI). It is
apparent that a priori, the coefficients of the explanatory variables of gross domestic product (GDP) and exchange rate (EXR) have the correct signs and in conformity with the theoretical expectations and money supply (M2) and
capacity utilization (CAU) have negative signs instead of a positive one while inflation (INF) has a positive sign instead of a negative sign. The negative sign exhibited by the money supply may be due to the fact that, a reasonable portion of the total deposit mobilized by the deposit money banks (DMBs) does not translate to the domestic economy of Nigeria by way of credit creation. The negative sign of capacity utilization is an indication of poor performance of the manufacturing sector which can be explained by low capacity utilization, poor effective demand for final products, exchange rate misalignment, and input procurement constraint; while the positive sign of inflation may not be unconnected with conspicuous consumption of Nigerians.
The result further shows that all the regressors: gross domestic product, money supply, exchange rate, capacity utilization and inflation were able to explain about 97 percent (R2 = 0.9719) of the systemic variations in all
share index (ASI) during the period under review from 1990 to 2013. The goodness of fit of the model is satisfactory showing a very good explanatory power of the model. This can be seen with the high adjusted coefficient of determination of 96.37%. The F-statistic of 117.800 was significant at the one (1) percent level of significance. The high value of F means that we can soundly reject the hypothesis of no significant linear relationship between the independent variables and dependent variable (ASI). The conclusion then, is that these five explanatory variables – GDP, M2, EXR, CAU and INF are dependable predictors of all share index (GDP) in Nigeria.
As regards the t-values, the coefficients of gross domestic product (GDP) and money supply (M2) were
statistically significant at both the five (5) percentage and ten (10) percentage levels of significance, while the remaining three: exchange rate (EXR), capacity utilization (CAU) and inflation (INF) were not significant even at the ten (10) percentage level. The Durbin Watson (DW) statistic of 2.005, however, suggests that autocorrelation is highly minimized. Therefore, we can make valid prediction(s) with the estimation result.
Finally, this research finding indicate that (i) a unit increase in gross domestic product will increase all share index by about 1.607 units. (ii) a unit increase in money supply will result to about 0.756 units decrease in all share index (iii) a unit increase in exchange rate will lead to about 0.122 units increase in all share index. Similarly, (iv) a unit increase in capacity utilization will decrease all share index by about 0.030 units, while (v) a unit increase in inflation rate will bring about 0.043 units of all share index.
5.0 Policy Implications of Findings
This empirical literature review in this paper suggests that the stock market bubbles and subsequent melt down could have arisen from market inefficiencies and government macroeconomic policies as well as possible negative and contagion effects of globalization which exposes developing countries to the impact of economic and financial crises. Reduction in money supply and capacity under-utilization as well as the liquidity squeeze during the melt has not helped the stock market growth and as such policies should be initiated to increase money supply and revitalize the manufacturing sector to stimulate the growth of the stock market.
The result of this study revealed that gross domestic product, exchange rate and inflation were positively related with All Share Index while money supply and capacity utilization were negatively related with ASI. The policy implications of these findings are that, there is a positive relation between stock market performance and economic growth in Nigeria.
The paper observes that the post melt down macroeconomic policies including the steps taken by the Central Bank of Nigeria such as the bail out of commercial banks and policies put in place to sanitize the sector would have contributed to the gradual recovery of the Nigerian stock market.
5.1 Policy Recommendations and Conclusion
There should also be policies to enhance stock market performance such as addressing the inefficiencies and weaknesses in the Nigerian financial system particularly in the banking sector which accounts for a large percentage of the Nigerian stock market capitalization by strengthening corporate governance code of conduct in financial istitutions that could boost public confidence on the banking sector as well as the stock market in Nigeria.
Besides, the government through the regulatory agencies and the capital market operators should pursue adequate sensitization of the public on the enormous potentialities derivable from investing in the capital market as well as putting in place effective supervisory and regulatory measures that could discourage unethical or sharp practices by the operators in the capital market.
References
Aggarwal, R, C. Inclan, and R. Leal (1999). Volatility in emerging stock markets. Journal of financial and quantitative analysis, 34, March, 33-55.
Aluko, M.E. (2008). The global financial meltdown. Impact on Nigeria’s capital market and foreign reserves http//www.nigeria village square.com. 17/4/09.
Bailey, R.E. (2005). The economics of financial markets. Cambridge University Press.
Barberis, N. and A. Shleifer (2003). Style investing. Journal of financial economics, 68(2), pp. 161-99.
Bekaert, G, and C. Harvey (1997). Emerging equity market volatility. Journal of financial economics, 43, January, 29-77.
Bekaert, G, and C. Harvey (2002). Research in emerging markets finance: Looking to the future, emerging markets review 3, 429-448.
Black, F. (1976). Studies of stock market volatility changes. Proceedings of the 1976 meeting of the American statistical Association, business and economics statistics session, 177-181.
Borenzstein, E, and R.G. Gelos (2000). A panic-prone pack? The behavior of emerging market mutual funds, IMF working paper 00/198.
Brunnemeier, M.K (2001). Asset pricing under assymmetric information. Bubbles,crashes, technical analysis and herding. Oxford University press Oxford, U.K.
Central Bank of Nigeria (2013). Annual bulletin and statistic.
De Santis, G, and S. Imrohoroglu (1997). Stock returns and volatility in emerging financial markets. Journal of international money and finance, 16, August, 561-579.
Edwards, S. J. and Samuel, (2001). Volatility dependence and contagion in emerging equity markets, Journal of development economics 66, 505-532.
Fama, E. and K. French (1988). Permanent and temporary components of stock prices. Journal of political economy, 96, 246-273.
Fama, E. and G. W. Schwert (1977). Asset returns and inflation. Journal of financial economics, 5, 55-69.
Froot, K, P. O’Connell, and M. Seasholes (2001). The portfolio flows of international investors. Journal of financial economics, 59, February, 151-193.
Frank, K. Reilly (1979). Investment analysis and portfolio management. University of Illinois. The Dryden Press, Hinsdale.
Fama E.F. (1970). Efficient capital markets: A review of theory and empirical work., Journal of finance, 25(2), pp. 383-417.
Garber, Peter (1989). “Tulipmania” Journal of political economy, Vol 97 (3) PP 535 – 60.
Garber, P.M. (1994). Famous first bubbles. Journal of economic perspectives vol. 4 ( 2) PP.35 – 54. Gujarati, N. D. (2005). Basic econometrics. McGraw-Hill, New York.
Janszen, E. (2008). The next bubble priming the markets for tomorrow’s big crash. Harpers Magazine Foundation. Jayasuriya, S. (2002). Does stock market liberalization affect the volatility of stock returns? Evidence from emerging
market economies.
Kaminsky, G.R. Lyons and S. Schmukler (2000). Fragility, liquidity and risk: The behavior of mutual funds during crisis. Working paper, January.
Karolyi G.A. (2001). Why stock return volatility really matters. preliminary and incomplete version, Feb 2001. Kindleberger, C.P. (1978). Manias, panics and crashes: A history of financial crises. London: Macmillan.
Kim E.H., Singal V. (1993). Opening up of stock markets by emerging economies: Effect on portfolio flows and volatility of stock prices and portfolio investment in developing countries 383-403.
Levine, R. and S. Zervos (1998). Capital market liberalization and stock market development. World Development, 26, July, 1169-1183.
Mackay, C. (1841). Extraordinary popular delusions and the madness of crowds. Project Gutenberg.http//.wikipedia.org.23/3/09.
Mala R. and Reddy, M. (2007). Measuring stock market Volatility in an emerging economy. International research journal of finance and economics.
Nwokoma N.I (2002). Stock market performance and macroeconomic indicators nexus in Nigeria: An empirical investigation The Nigerian Journal of economics and social studies, 44, (2) pp. 231-251.
Olajide B. (2009). Nigerian banks and the financial crisis era; Money watch, The Guardian http//.www.ngr guardiannews.com.
Reinhart, V. (2000). How the machinery of international finance funds with sand in its Wheels. Review of international economics, 8 February, 74-85.
Schwert G. W. (1989). Why does stock market volatility change overtime? Journal of finance, 44, p. 1115-1153. Soludo C. (2009). Global financial and economic crisis. How vulnerable is Nigeria http://www.cenbank.org. Shiller, A. (2000). Inefficient markets: An introduction to behavioral finance, Oxford University Press.