Introduction
Idiopathic central serous chorioretinopathy (CSC) is a disease first described by Albrecht von Graefe in 1866 as “recurrent central retinitis”. It is characterized by detach-ment of the retinal neuroepithelium from the pigdetach-ment epi-thelium with the accumulation of clear fluid in the macular region (7). The disease mainly affects middle-aged males (20 to 50 years of age) (7). It is the cause of a sudden, mild decrease of visual acuity, micropsia, metamorphopsia and defects in the centre of the visual field. Generally, the di-sease has a good prognosis. It depends on the resorption of fluid and thus the normalization of visual functions. The final result is dependant on the eventual damage of the neural part of the retina by fluid accumulation in the acute phase of the disease. Unfavourable prognosis is attributed to recurrence of attacks or less frequently, to the prolonged or chronic course of the disease. This leads to irreversible structural changes of the macula with a permanent decrease of visual acuity. Absorption of the fluid is in many cases spontaneous within a few weeks. The therapy usually used in chronic CSC, comprises of nonsteroidal antiinflamatory drugs, vasoprotectives, resorbients, vitamins, systemic beta-blockers or acupuncture (34). One of the treatment methods
of acute idiopathic CSC in strictly indicated cases is direct laser photocoagulation at the source of the fluid leakage from the choroid under the retina. This significantly reduces the duration of ablation of the neuroretina and prevents de-velopment of chronic changes due to CSC with irreversible anatomical and functional damage (3, 17, 30, 37).
Many authors describe diminished contrast sensitivity (CS), colour discrimination and focal or multifocal electro-retinography (mfERG) in acute idiopathic CSC not only when best corrected visual acuity (BCVA) decreases, but also when it remains satisfactory (1, 2, 5, 10, 14, 21, 25, 35). Some studies refer co-existing alteration of the retinal func-tion within the central 40° area on the fellow, unaffected eye of the patients (10, 21). Others observe that its ab-normalities extend beyond the clinically observed fundus changes mainly in clinically affected eyes (26) or, only in af-fected eyes limited to the pathological retinal region (35). The persistence of colour vision defects, decreased CS, de-creased central retinal sensitivity on microperimetry and subnormal or low-normal signals from central retinal re-gion by means of mfERG was described also after spontane-ous resolution of unilateral CSC either only on the affected eyes (28, 33), or also in clinically uninvolved, fellow eyes of patients (2, 10, 13, 19, 20, 31). Changes in the foveal
pho-ORIGINAL ARTICLE
VISUAL FUNCTIONS AFTER LASER PHOTOCOAGULATION IN CENTRAL
SEROUS CHORIORETINOPATHY
Dagmar Hejcmanová, Markéta Macháčková, Eva Rencová, Georgia Kyprianou, Hana Langrová
Charles University in Prague, Faculty of Medicine and University Hospital Hradec Králové, Czech Republic: Department of Ophtalmology
Summary:The authors evalute the visual functions of patients with unilateral central serous chorioretinopathy (CSC) and compare them with their non-affected eye and with a control group. Fourteen patients with CSC treated with direct laser-photocoagulation were examined preoperatively and followed-up, up to 2 years postoperatively. Baseline best corrected vi-sual acuity (BCVA) and contrast sensitivity (CS) of both eyes of patients was significantly lower in comparison with the controls. BCVA and CS in affected eyes were significantly lower compared to the fellow eye of patients. The final BCVA and CS of patients did not differ significantly from the controls, except CS of affected eyes in the spatial frequency of 3.69 c/deg. Two years after laser treatment, there were only nonsignificant differences of both photopic full-field electroretino-graphy (phERG) and multifocal electroretinoelectroretino-graphy (mfERG) responses between the treated, the nonaffected eye of the patients and the control group with exception of a significantly longer P1 implicit time in the parafoveolar region in af-fected eyes. Colour discrimination was normal in 85.8% of afaf-fected eyes of the patients. Despite a significant improvement of macular function in CSC eyes, functional examination methods do not prove complete resolution of function 2 years after laser-treatment.
toreceptor layer in CSC may cause the persistent functional deficit and predict visual recovery after macular reattach-ment in CSC patients (29).
The aim of our study was to evaluate the functional and anatomic retinal changes in patients with the first attack of unilateral CSC within a time period of two years after the treatment with direct laser photocoagulation and compare them with the fellow, unaffected eye of the same patients and with an age-similar normally-sighted control group.
Material and Methods
Fourteen patients (14 males) of median age 44 years (range 35 to 51 years) with the first attack of unilateral acu-te idiopathic CSC were treaacu-ted at the Department of Oph-thalmology of the Charles University in Hradec Králové. Diagnosis was set approximately three weeks from the on-set of the disease (range 1 to 8 weeks). In five cases the right eye was affected (36 %) and in nine cases (64 %) the left eye. In all cases, it was the first attack of the disease without any other concurrent pathology of the affected eye and of the fellow eye. The patients had undergone a routine ophthalmologic examination, fundus photography of both eyes at the standard 30° (Zeiss, Germany). Fluorescein an-giography (FAG) was performed to localize the leak points at the level of the retinal pigment epithelium (RPE). The patients did not suffer with potential relevant systemic di-seases.
All patients underwent direct laser photocoagulation using diode integrated green laser with a wavelength of 532 nm (Integre SP, Laserex, USA). The laser burns were ap-plied to the point where the earliest hyperfluorescent spot was seen in the earliest phase of the FAG. In this way, the laser area could be confined to the source of hyperfluores-cence without excess affection of the detached surface of the neuroepithelium that remained unaffected by the laser. The distance between the laser points and the centre of the macula was strictly kept to at least 500 μm, the point size was 200 μm, and the laser was applied for 0.2 seconds with 130–290 mW.
Both eyes of patients were examined at the beginning of the disease and two years after treatment. The affected eyes were examined in addition 2 months and one year after la-ser photocoagulation. Best corrected visual acuity, contrast sensitivity and optical coherence tomography (OCT) were tested at all visits, colour vision and electroretinography were performed 2 years after the treatment.
The control group comprised of 20 healthy eyes (10 ma-les) with a median age of 48.5 years (range 49 to 53 years) with no potential relevant eye or systemic disease. Exami-nations were performed at all visits by the same ophthal-mologists. The Institutional Ethics Committee approved the study protocol and the reported investigations were in accordance with the principles of the current version of the Helsinki Declaration. All individuals gave their informed consent prior to their inclusion in the study.
The threshold BCVA was measured under controlled lighting conditions using high-contrast (97 %) optotype logMAR charts (Small medical technique, Czech Repub-lic). The distance for examination was 4 meters. Each of the 14 rows of the chart for testing visual acuity between 0.1 (20/200) and 2.0 (20/10) contained 10 Landolt rings, each with a predefined space in one of eight directions. Their size in the subsequent rows had a logarithmic progression. The number of correct answers was noted and the method of Ferris et al. (4) was used for the calculation of the thres-hold.
The CS was tested using a computerized Contrast Sen-sitivity 8010 System (Neuroscientific Corp., Farmingdale USA). The distance for CS measurement was 2.2 m so that a range of spatial frequencies from 0.74 to 29.55 c/deg was achieved. The size of the monitor appeared as 5 deg x 3.5 deg in the centre of the visual field. CS was measured by the method of ascending and descending limits for six spa-tial frequencies: two low (0.74; 1.97 c/deg), two intermedi-ate (3.69; 7.39 c/deg) and two high frequencies (14.77 and 29.55 c/deg) (15). The background illumination was set to 85 cd m-2. The contrast sensitivity was evaluated in [dB] = 20*log (CS). The eyes were refracted for CS examination, the median pupil size was 4.0 mm (3.5–4.5 mm).
OCT Stratus (Zeiss, Germany) was used for evaluation of the central retinal thickness of the affected eyes of pa-tients. The macula was examined using “Macular thickness analysis” in 6 radial scans and the central retinal area of 6 mm in diameter was evaluated. As a central retinal thick-ness we considered the thickthick-ness in 1 mm zone.
The colour vision was examined using Farnsworth D-15 and Lanthony D-15 desaturated tests (X-Rite, Grand Rapids USA). The Panel D-15 total error score and colour confusion index were calculated using the calculation pro-posed by Lanthony (16). The colour confusion index (CCI) was calculated as relationship between the actual and the normal total colour difference score (TCDSactual/TCDSnormal) (36).
Electroretinograms (ERG) were recorded from the cor-nea with DTL fiber electrodes (UniMed Electrode Supplies, England). The reference and ground skin electro-des (gold cup electroelectro-des) were attached to the ipsilateral temples and forehead respectively. The pupils were fully di-lated (0.5 % tropicamide and 10 % phenylephrine) and the patients were adapted to light. The eyes were refracted for multifocal ERG.
The mfERG stimulus was generated on a 20-inch ViewSonic monitor with a frame rate of 75 Hz positioned 30 cm from the subject’s eye. MfERG traces were recorded from the central 60oof the retina with a resolution of 61-scaled hexagons according to the ISCEV guidelines (9, 24, 32). The luminance of the stimulus was 160 cd s m-2for the white flashes and 1.4 cd s m-2for the black ones and the lumi-nance of the surrounding screen area was set to 80 cd m-2. A red cross was presented for fixation. The recordings were sampled at 1033 Hz, amplified (x 200 000) and band pass filtered (10–100 Hz). We evaluated amplitudes and implicit times of the positive peak component (P1) of the first order kernel analysis for 5 concentric rings centred on the fovea. For statistical analysis we used a nonparametric Mann-Whitney and Kruskal-Wallis tests and a p≤0.05 was consi-dered statistically significant.
Results
Restoration of the detached RPE was reached in 14 eyes of 14 patients (100 %) after laser treatment. One laser burn was enough to restore the neuroepithelium of the retina in
seven patients (50 %). For four other patients (28.6 %) 2 or 3 burns were applied. In three cases (21 %) we had to repe-at the process once more after 3 to 5 months and thereaf-ter more repetitions were not necessary. Recurrences were not noted in any patient and fellow eyes of all patients re-mained unaffected within the time period of two years.
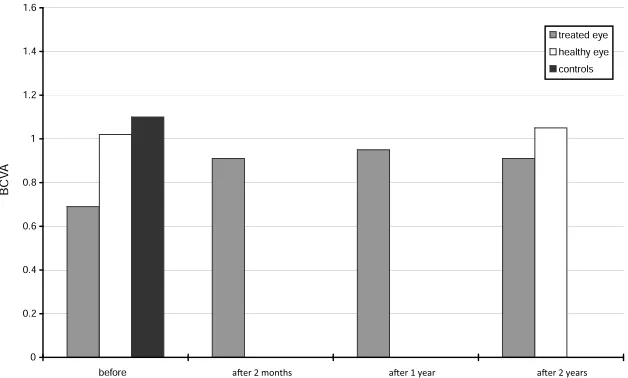
Median BCVA of the control group was 1.1 (0.83–1.51). The course of BCVA of the affected eye of patients before and after treatment with the two-year follow-up period in comparison with the normal limits is shown in Fig. 1. The median BCVA of the affected eyes of patients was 0.69 (0.31–0.85) before treatment. After the treatment, BCVA improved significantly (p<0.001) to 0.91 (0.59–0.98) at 2-months follow-up, and further to 0.95 (0.52–1.11) after 1-year in affected eyes, but still remained significantly lower compared to the controls (p=0.03 and p=0.04). The final median BCVA of 0.91 (0.61–1.25) did not differ significant-ly from the controls. Baseline median BCVA of the fellow eye of patients was 1.02 (0.64–1.33), at 2 years follow-up it increased significantly (p<0.05) to 1.05 (0.94–1.45). Base-line BCVA of both eyes of patients was significantly lower in comparison with that of the controls (p<0.001 for the
af-Fig. 1: Best corrected visual acuity (BCVA). BCVA of controls and both eyes of patients measured at all examinations. The columns represent their median values.
spatial frequencies
0.74 1.97 3.69 7.39 14.77 29.55
RCS before therapy 23.25 36.00 38.62 26.62 13.12 7.49
RCS after 2 years 28.50 40.68 42.94 39.75 27.75 11.43
FE before therapy 28.31 38.25 42.56 39.00 28.31 11.43
FE after 2 years 30.18 41.25 44.62 41.47 27.89 12.56
controls: P 0.05 26.62 39.31 43.06 35.42 24.76 10.85
controls: P 0.95 34.70 43.87 47.73 45.21 33.96 17.65
The baseline and final median values of contrast sensitivity [dB] of central serous chorioretinopathy (CSC) and the fel-low eyes (FE) of patients and normal range of CS in 6 spatial frequencies (90 % CL).
fected eyes, and p<0.01 for fellow eyes) whereas the final BCVA of both eyes of patients was only nonsignificantly lower compared to controls.
The baseline and final CS of both eyes of patients and its normal values are summarized in Table 1. Before treat-ment, the CS of the affected eyes was significantly lower in comparison with both the clinically unaffected, fellow eye of patients (p<0.01 at a frequency of 1.97 c/deg, and p< 0.001 at all other spatial frequencies) and with the control group (p<0.001 at all spatial frequencies). Moreover, baseli-ne CS in the fellow, clinically uninvolved eyes of patients was also significantly lower when compared to the controls (p<0.05 to p<0.001). The decrease of CS in fellow eyes of patients was most pronounced at intermediate spatial fre-quencies and smallest at the highest frequency. After treat-ment the CS improved significantly and the final CS of both eyes of patients reached normal values, with the exception of significantly lower CS at a spatial frequency of 3.69 c/deg for the affected eyes. The course of recovery of CS in the af-fected eye within the whole follow-up period is shown in Fig. 2. At 2 months after laser photocoagulation, the CS impro-ved significantly (p<0.001) but still remained significantly lower at all frequencies (p<0.05 and p<0.001) in comparison with the controls. Despite a further significant increase after one year at the majority of frequencies (p<0.05 to p<0.001), CS remained significantly lower (p<0.05) at intermediate frequencies in comparison with the controls. In the second year CS remained practically stable.
OCT examination confirmed a statistically significant reduction (p<0.001) of central retinal thickness in the af-fected eyes of patients from an initial median value of 293
μm (range 140 μm – 548 μm) to a median value of 190 μm (range 125 μm – 277 μm) two months after the laser pho-tocoagulation. At the one year follow-up examination, the central retinal thickness further decreased and reached the normal limits with median thickness of 150 μm (range 106
μm – 184 μm) and remained stable at 2-years of follow-up examination.
Two years after therapy, the colour discrimination was normal in the affected eyes of 12 patients (86 %) and in the fellow eyes of all patients (100 %) with a total mean error score = 0 using the Lanthony Panel D-15 desaturated test. In two patients (14 %), the Farnsworth D-15 test was normal, whereas the Lanthony D-15 desaturated test detected colour vision impairment in the blue region with a total error score of 56 and 136, and CCI of 1.39 and 1.96 respectively.
Two years after treatment, the amplitudes of light adapted 3.0 ERG reached the median value of 35 μV (27–58 μV) for the a-wave, 141 μV (111–207 μV) for the b-wave and 121
μV (90–167 μV) for the 3.0 flicker ERG in the affected eyes of the patients. The amplitudes of both ph-ERG responses were similar in fellow, clinically uninvolved eyes as shown in Fig. 3. The statistical analysis showed only nonsignificant differences in comparison with the control group. Implicit times of both ph-ERG responses were also within the nor-mal range in both eyes of all patients (data not shown).
Figs. 4a and 4b summarize the averaged mfERG ampli-tudes and implicit times of the P1 component of the first order kernel analysis for all 5 retinal areas for both eyes of all 14 patients at two years follow-up after laser treatment in comparison with the controls. In affected eyes, the altera-tion of the average median P1 amplitudes was statistically nonsignificant over the entire central retina when compa-red both to the fellow eyes of patients and to the controls. The average median P1 implicit times were also nonsignifi-cantly prolonged compared to patients fellow eyes and con-trols, with the exception of a significantly longer P1 implicit time in the retinal region between 1.8° and 7° of eccentrici-ty in affected eyes compared to the controls (p=0.049). However one patient had low average P1 amplitudes in all 5 annular retinal regions (ring 1: 29.8; ring 2: 10.2; ring 3: 4.1; ring 4: 2.78 and ring 5: 1.76 nVdeg-2) and in one patient
Fig. 4 a,b: Multifocal ERG (mfERG). Box plot with mfERG a) amplitudes [μV] and b) implicit times [msec] of the P1 component of the first order kernel analysis for 5 concentric rings around the fovea. The horizontal lines represent the me-dian values, the boxes display the 25% and 75% percentiles and the error bars show the minimum and maximum data va-lues.
we found low activity in the central 14° area (ring 1: 19.3; ring 2: 29.4; ring 3: 30.1; ring 4: 21.4 and ring 5: 16.5 nVdeg-2) in the affected eyes. In the fellow eyes of all 14 patients, all average mfERG responses were within the normal range.
Discussion
In our prospective study with a 2-year follow-up period we included patients with a first attack of unilateral CSC who had undergone direct laser photocoagulation of the fo-cal leakage sources. We evaluated the macular changes of the affected eyes and compared them with the fellow, unin-volved eyes of the same patients and with an age-similar control group.
Our study shows that the average standardized thres-hold BCVA of both eyes of the patients was significantly lower than that of the control group at the beginning of the disease. Frisen and Frisen (6) studied BCVA and micropsia in patients with macular oedema and pointed out that a BCVA of 1.0 could be reached even with a loss of 44 % of the total amount of fibres in independent pathways joining foveolar cones with visual cortex centre. This suggests that even a BCVA of 1.0 can imply a marked decrease of the central visual functions and thus such a visual acuity should not be accepted as normal without a detailed analysis.
Within two months after laser treatment the BCVA of affected eyes significantly improved and this improvement gradually continued. Two years after the procedure, the average BCVA was similar to that of the unaffected eye of the patient. Additionally, by that time the BCVA of both eyes of the patient was only nonsignificantly lower than that of the control group. Nevertheless in the affected eyes of two patients the BCVA remained low, in the first 0.59 and in a second 0.63, which was consistent with lower levels of CS at high spatial frequencies (13, 31). In the quiescent phase of CSC (the period after the settling of pre-viously detached neuroepithelium), the defects in the photo-receptor layer might have been the cause of the persistently decreased BCVA (6, 29) even though FAG and classical OCT do not show a variation from normal findings.
Another easily evaluated parameter of the eyes’ distin-guishing ability is examination of CS. A patient can have normal values of BCVA with high contrast optotypes but significantly abnormal with low contrast. It has been ob-served that the perception of contrast was disturbed only in high angle critical details and not in low ones. Therefore, introduction of another variable (contrast) into the exami-nation of visual functions can be very useful (31). At the be-ginning of CSC, the average CS of both eyes of the patient was greatly decreased compared to the control group in our study. The decrease was greater in the affected eyes. The study of Lu (18) also showed that 40 % of the fellow eyes of the patient group showed a slight CS decrease at mid-high spatial frequencies, although other visual functional tests showed no abnormality. These fellow eyes may be at risk for CSC. Within two months after the procedure, CS values of
the affected eye rapidly increased, and the final CS of both eyes of patients reached normal values, except for a spatial frequency of 3.69 c/deg where the values were significantly lower in the affected eyes. Khosla et al. (12) followed up the changes in BCVA and CS of patients after laser photocoa-gulation and noted that 3 months after treatment, BCVA ra-pidly improved while CS in many cases remained decreased even although the BCVA was 1.0. They also noted that a fol-low-up period of three months is too short for the evalua-tion of whether the decrease in CS returned to normal values.
Robertson and Ilstrup (30) showed a statistically signi-ficant reduction of recurrences within a 1,5 years follow-up period when laser photocoagulation was used. This was also verified by a long-term study by Yap (37). Contrast sen-sitivity did not seem to recover in all eyes after CSC even if visual acuity had returned to normal. Maaranen (20) there-fore points out that contrast sensitivity testing is recom-mended for patients complaining of visual impairment in spite of good visual acuity.
OCT is an objective means for quantitative assessment of central retinal thickness. The significant decrease and normalization of the retinal thickness of affected eyes at one-year follow-up is consistent with a complete resolution of subretinal fluid in all our patients. Similar results were described by Iida et al. (11). On the other hand, Moschos et al. (26) described that retinal thickness remained abnor-mal despite of total resolution of subretinal fluid.
Two-years after laser coagulation, we detected colour vi-sion defects in the blue area in only 14.2 % of affected eyes; all fellow eyes had normal colour discrimination. In our study, the percentage of eyes with dyschromatopsia was smaller than those published by other authors. Bartos et al (2) found long-term colour vision deterioration in 20 % of patients after a single attack of CSC after conservative treatment or laser coagulation. Maaranen (20) found long-term defects in the blue region in 67 % of affected eyes and in 49 % of contralateral eyes of patients even if VA had re-covered to normal, which may be due to earlier subclinical CSC as the authors the speculated. However dyschroma-topsia and relative scotomas can occur as a result of defects in the photoreceptor layer even after resolution of subreti-nal fluid despite normal fundoscopic, FAG and classical OCT findings (27, 29).
and CS at high spatial frequencies as mentioned above. There were no fundus abnormalities in the other 12 af-fected eyes and all 14 fellow eyes of patients. The implicit times of mfERG response were significantly longer in the parafoveolar retinal region between 1.8° and 7° eccentricity and within the normal range in the rest of stimulated retina in affected eyes and in the whole posterior pole of fellow eyes of patients. The alteration of the implicit time in the parafoveolar area in resolved CSC could be caused by alte-ration of second-order kernel responses due to inner retinal dysfunction (14).
Conclusions
We conclude that there was an incomplete resolution of functions in central part of the retina in affected eyes with CSC. Even although the fundoscopic findings were normal in 86 % of affected eyes two years after therapy, there re-mained a mild alteration of CS in the middle spatial fre-quency (3.69 c/deg) and prolonged implicit times of mfERG in the parafoveolar area. On the other hand, we noted a full recovery of all tested parameters in the clinically unaffected fellow eyes.
References
1. Baran NV, Gürlü VP, Esquin H. Long-term macular function in eyes with central serous chorioretinopathy. Clin Experiment Ophthalmol 2005;33(4):369–372. 2. Bartos D, Kondrova J, Stibor V, Bartosova L, Rousova A. Changes in
psychovi-sual function after central serous chorioretinopathy. Cesk Slov Oftalmol 1998;54(3):166–173.
3. Elsner H, Pörksen E, Klatt C, et al. Selective retina therapy in patients with central serous chorioretinopathy. Graefes Arch Clin Exp Ophthalmol. 2006;244(12): 1638–1645.
4. Ferris FL, Krasoff A, Bresnick GH, Bailey I. New visual acuity charts for clinical research. Am J Ophthalmol 1982;94:91–96.
5. Folk JC, Thompson HS, Han DP, Brown CK. Visual function abnormalities in central serous retinopathy. Arch Ophthalmol 1984;102(9):1299–1302. 6. Frisén L, Frisén M. How good is normal visual acuity? Albrecht Von Graefes
Arch Klin Exp Ophthalmol.1981;215(3):149–157.
7. Gass JDM. Pathogenesis of disciform detachment of the neuroepithelium, Idiopathic central serous chorioretinopathy. Am J Ophthalmol 1967;63:587–615. 8. Genter CR 2nd, Kandel GL, Bedell HR. The minimum angle of resolution vs
angle of regard function as measured with different targets. Ophthalmic Physiol Opt. 1981;1:3–13.
9. Hood DC, Bach M, Brigell M. ISCEV guidelines for clinical multifocal electro-retinography (2007 edition). Doc Ophthalmol 2008;116(1):1–11.
10. Chappelow AV, Marmor MF. Multifocal electroretinogram abnormalities persist following resolution of central serous chorioretinopathy. Arch Ophthalmol 2000;118(9):1211–1215.
11. Iida T, Yannuzzi LA, Spaide RF, Borodoker N, Carvalho CA, Negrao S. Cystoid macular degeneration in chronic central serous chorioretinopathy. Retina 2003; 23(1):1–7.
12. Khosla PK, Rana DD, Tewari HK, Azad RU, Talvar D. Evaluation of visual func-tion following argon laser photocoagulafunc-tion in central serous retinopathy. Ophthal Surg Las 1997; 28: 8693–8697.
13. Koskela P, Laatikainen L, von Dickhoff K. Contrast sensitivity after resolution of central serous retinopathy. Graefes Arch Clin Exp Ophthalmol 1994;232(8): 473–476.
14. Lai TY, Lai RY, Ngai JW, Chan WM, Li H, Lam DS. First and second-order ker-nel multifocal electroretinography abnormalities in acute central serous chorio-retinopathy. Doc Ophthalmol 2008;116(1):29–40.
15. Langrová H, Hejcmanová D, Peregrin J. Reproducibility of contrast sensitivity measurements. Cesk Slov Oftalmol 1996;52: 52–57.
16. Lanthony P. [Evaluation of the desaturated Panel D-15. I. Method of quantifica-tion and normal scores]. J Fr Ophtalmol 1986;9(12): 843–847.
17. Leaver P, Williams C. Argon laser photocoagulation in the treatment of central serous retinopathy. Br J Ophthalmol 1979;63(10): 674–677.
18. Lu N, Zhang C. Contrast sensitivity study in fellow eyes of patients with central serous chorioretinopathy. Zhongguo Yi Xue Ke Xue Yuan Xue Bao. 1992;14(2): 85–88.
19. Maaranen TH, Mäntyjärvi MI. Contrast sensitivity in patients recovered from central serous chorioretinopathy. Int Ophthalmol 1999;23(1): 31–35. 20. Maaranen TH, Tuppurainen KT, Mäntyjärvi MI. Color vision defects after
central serous chorioretinopathy. Retina 2000;20(6): 633–637.
21. Marmor MF, Tan F. Central serous chorioretinopathy: bilateral multifocal electro-retinographic abnormalities. Arch Ophthalmol 1999;117(2):184–188. 22. Marmor MF, Zrenner E. Standard for clinical electroretinography (1999 update).
International Society for Clinical Electrophysiology of Vision. Doc Ophthalmol 1998–1999;97(2):143–156.
23. Marmor MF, Fulton AB, Holder GE, Miyake Y, Brigell M, Bach M. International Society for Clinical Electrophysiology of Vision. ISCEV Standard for full-field cli-nical electroretinography (2008 update). Doc Ophthalmol. 2009;118(1):69–77. 24. Marmor MF, Hood DC, Keating D, Kondo M, Seeliger MW, Miyake Y.
Guide-lines for basic multifocal electroretinography (mfERG). Doc Ophthalmol 2003; 106(2):105–115.
25. Miyake Y, Shiroyama N, Ota I, Horiguchi M. Local macular electroretinographic responses in idiopathic central serous chorioretinopathy. Am J Ophthalmol 1988;106(5):546–550.
26. Moschos M, Brouzas D, Koutsandrea C. Assessment of central serous choriore-tinopathy by optical coherence tomography and multifocal electroretinography. Ophthalmologica 2007;221(5):292–298.
27. Ojima Y, Masanori H, Sasahara M. Three-dimensional imaging of the foveal pho-toreceptor layer in the sentral serous chorioretinopathy using high-speed optical coherence tomography. Ophthalmology 2007;114(12):2197–2207.
28. Ozdemir H, Karacorlu SA, Senturk F, Karacorlu M, Uysal O. Eye. 2008;22(2): 204–208.
29. Piccolino FC, de la Longrais RR, Ravera G, et al. The foveal photoreceptor layer and visual acuity loss in central serous chorioretinopathy. Am J Ophthalmol. 2005;139(1):87–99.
30. Robertson DM, Ilstrup D. Direct, indirect, and laser photocoagulation in the ma-nagement of central serous chorioretinopathy. Am J Ophthalmol 1983;95:457–466. 31. Sjöstrand J, Frisén L. Contrast sensitivity in macular disease. A preliminary
re-port. Acta Ophthalmol (Copenh) 1977;55:507–514.
32. Sutter EE, Tran D. The field topography of ERG components in man-I. The pho-topic luminance response. Vision Res 1992;32(3):433–446.
33. Suzuki K, Hasegawa S, Usui T, et al. Multifocal electroretinogram in patients with central serous chorioretinopathy. Jpn J Ophthalmol 2002;46(3):308–314. 34. Taban M, Boyer DS, Thomas EL. Chronic central serous chorioretinopathy:
pho-todynamic therapy. Am J Ophthalmol 2004;137:1073–1080.
35. Vajaranant TS, Szlyk JP, Fishman GA, Gieser JP, Seiple W. Localized retinal dys-function in central serous chorioretinopathy as measured using the multifocal electroretinogram. Ophthalmology 2002;109(7):1243–1250.
36. Vingrys AJ, King-Smith PE. A quantitative scoring technique for panel tests of color vision. Invest Ophthalmol Vis Sci 1988;29(1):50–63.
37. Yap EY, Robertson DM. The long-term outcome of central serous chorioretino-pathy. Arch Ophthalmol 1996;114:689–692.
Corresponding author:
Dagmar Hejcmanova, MD. PhD, University Hospital Hradec Králové, Czech Republic: Department of Ophtalmology, Sokolská 158, 500 05 Hradec Králové, Czech Republic; e-mail: hejcmanovad@lfhk.cuni.cz
![Fig. 2: Contrast sensitivity (CS). Median values of contrast sensitivity [dB] measured at each examination in the affectedeyes of patients and their comparison with normal range of CS (90 % CL).](https://thumb-us.123doks.com/thumbv2/123dok_us/8842950.1796084/4.595.140.454.502.694/contrast-sensitivity-contrast-sensitivity-measured-examination-affectedeyes-comparison.webp)
![Fig. 3: Photopic ERG (ph-ERG). Amplitudes of both ph-ERG responses. The columns represent their median values [μV].](https://thumb-us.123doks.com/thumbv2/123dok_us/8842950.1796084/5.595.122.449.270.667/fig-photopic-amplitudes-responses-columns-represent-median-values.webp)
