Ann. Geophys., 31, 1131–1142, 2013 www.ann-geophys.net/31/1131/2013/ doi:10.5194/angeo-31-1131-2013
© Author(s) 2013. CC Attribution 3.0 License.
EGU Journal Logos (RGB)
Advances in
Geosciences
Open Access
Natural Hazards
and Earth System
Sciences
Open AccessAnnales
Geophysicae
Open AccessNonlinear Processes
in Geophysics
Open AccessAtmospheric
Chemistry
and Physics
Open AccessAtmospheric
Chemistry
and Physics
Open Access DiscussionsAtmospheric
Measurement
Techniques
Open AccessAtmospheric
Measurement
Techniques
Open Access DiscussionsBiogeosciences
Open Access Open Access
Biogeosciences
DiscussionsClimate
of the Past
Open Access Open Access
Climate
of the Past
Discussions
Earth System
Dynamics
Open Access Open Access
Earth System
Dynamics
DiscussionsGeoscientific
Instrumentation
Methods and
Data Systems
Open Access
Geoscientific
Instrumentation
Methods and
Data Systems
Open Access DiscussionsGeoscientific
Model Development
Open Access Open Access
Geoscientific
Model Development
DiscussionsHydrology and
Earth System
Sciences
Open AccessHydrology and
Earth System
Sciences
Open Access DiscussionsOcean Science
Open Access Open Access
Ocean Science
DiscussionsSolid Earth
Open Access Open Access
Solid Earth
DiscussionsOpen Access Open Access
The Cryosphere
Natural Hazards
and Earth System
Sciences
Open Access
Discussions
Cross-tail current evolution during substorm dipolarization
A. T. Y. Lui
Johns Hopkins University Applied Physics Laboratory, Laurel, MD 20723-6099, USA Correspondence to: A. T. Y. Lui ([email protected])
Received: 7 March 2013 – Revised: 7 May 2013 – Accepted: 24 May 2013 – Published: 27 June 2013
Abstract. We examine evolution of the cross-tail current dur-ing substorm current disruption/dipolarization usdur-ing obser-vations from two satellites in the near-Earth magnetotail at the downtail distances of 8–9RE. By choosing times when these two satellites are separated, mainly in the north–south distance in the tail current sheet, precise determination of current density in the layer embedded between these satel-lites can be obtained with Amp`ere’s law. Two such events are examined and several common features are found. The current densities in the layer embedded by the two satel-lites were reduced by∼40–70 % during substorm dipolar-ization. The changes in current densities have the fast kinetic timescale, i.e., in seconds, implying a kinetic process for cur-rent disruption/dipolarization. The estimated power within the current layer was mainly dissipative in the dawn–dusk direction and mainly dynamo in the Sun–tail direction that is needed to drive the north–south substorm current system in the ionosphere. Remote sensing of the energization site with the ion sounding technique shows that the energization site was initially earthward of the satellite and moved down the tail at later times. Breakdown of the frozen-in condition oc-curred intermittently during the disturbance interval. These features provide important clues to the substorm onset pro-cess.
Keywords. Magnetospheric physics (Storms and sub-storms)
1 Introduction
A space plasma phenomenon that exhibits impulsive energy releases is the space disturbance known as a substorm. This disturbance was originally conceived from evolution of au-roral displays in the polar region (Akasofu, 1964). It is now viewed as a prototype of many impulsive events in the plasma universe. A major feature of substorms on Earth is called
“dipolarization”, in which the magnetic field configuration in the nightside of the magnetosphere changes from a sheet-like magnetic field geometry to one resembling a dipole. The for-mer arises from the development of strong cross-tail current and the change in dipolarization can be explained in terms of a reduction of the cross-tail current during a substorm. It is generally accepted that this current reduction is linked to the development of a westward electrojet in the ionosphere dur-ing a substorm through the diversion of the cross-tail current in the magnetosphere to the ionosphere.
There are two major paradigms proposed for substorms, namely, near-Earth current disruption and magnetic recon-nection. The former paradigm envisions one or more plasma instabilities in the typical radial distance of∼6–12REin the near-Earth region to be activated to cause a substorm onset. The initial disturbance subsequently triggers an avalanche of instability excitation spreading down the tail in multiple sites. The latter paradigm envisions the onset of magnetic recon-nection at the typical radial distance of∼15–30RE in the midtail region. This activity gives rise to fast plasma flows towards Earth, leading subsequently to near-Earth dipolar-ization and substorm onset. Since the initial disturbance lo-cation is distinctly different in these paradigms, a NASA mission called Time History of Events and Macroscale In-teractions during Substorms (THEMIS) was launched on 17 February 2007 with the primary goal of resolving the controversy between these two paradigms by placing five identically-instrumented satellites along the tail axis to deter-mine incontrovertibly the propagation direction of substorm disturbances in the magnetotail (Angelopoulos, 2008). The apogees of these five satellites line up once every 4 days. Three inner probes have apogees at∼10REwhile two outer ones have apogees at∼20 and∼30RE.
In a recent article, Lui (2011) examined magnetic field ob-servations of a substorm interval from two THEMIS satellites in the near-Earth region (radial distance of∼8RE) separated
1132 A. T. Y. Lui: Cross-tail current evolution during substorm dipolarization
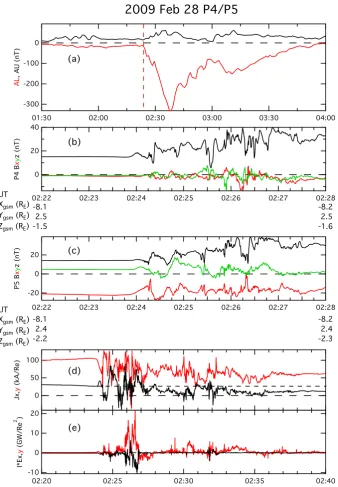
Fig. 1. Observations of the current disruption/dipolarization event on 28 February 2009: (a) the AU/AL indices; (b) and (c) the magnetic field components in GSM coordinates at P4 and P5 (different colors are used for different components, as indicated by the label), and current densities in the layer embedded by P4 and P5; and (d) and (e) power calculated from the product of current densities and the electric field averaged over the two satellite measurements.
in the north–south direction by ∼0.7RE and with nearly identical projections on the equatorial plane. The substorm onset is indicated by both ground-based magnetic activity from magnetic stations and auroral activity from all-sky-camera station. The current densities in the near-Earth region during the current disruption/dipolarization (CDD) interval were found to vary in a timescale of seconds. The current densities were eventually reduced by∼40–45 % within the
In this study, we first provide additional confirmation that the observed anisotropy of energetic ions in the event re-ported by Lui (2011) is genuinely due to remote sensing of energization site and not due to plasma flow. The amount of dissipation/dynamo power in that CDD event is also pre-sented. Another CDD event from THEMIS observations is presented here to show that the results obtained earlier are not unique to just one event.
2 Observations
THEMIS data used in this study are magnetic field from the fluxgate magnetometer (FGM) (Auster et al., 2008), elec-tric field from the elecelec-tric field instrument (EFI) (Bonnell et al., 2008), plasma parameters and distribution functions from the Electrostatic Analyzer (ESA) (McFadden et al., 2008), and energetic particle fluxes from the Solid State Telescope (SST) (Angelopoulos, 2008). FGM measures magnetic field and its low frequency fluctuation up to 64 Hz. EFI provides waveform and spectral three-axis measurements of the ambi-ent electric field from DC up to 8 kHz, with a single, integral broadband channel extending up to 400 kHz. ESA measures three-dimensional distribution function from a few eV up to 26 keV for electrons and up to 20 keV for ions in 3 s spin period. SST obtains three-dimensional distribution function from 35 keV to 6 MeV for ions and from 30 keV to 6 MeV for electrons in 3 s spin period.
2.1 28 February 2009 event
A near-Earth CDD event on 28 February 2009 was examined in Lui (2011). Figure 1 shows some salient features of this event. A substorm onset indicated by the AU/AL indices oc-curred at 02:24 UT. The substorm was a moderate size one judging from the minimum AL value of−331 nT for this ac-tivity. This AL activity onset is collaborated well with the auroral breakup seen at 02:24 UT by the all-sky-camera at KUUJ station (see Fig. 6 in Lui, 2011). The two THEMIS satellites, P4 and P5 both at Xgsm= −8.1RE, had nearly identical equatorial projections but separated by the distance from the neutral sheet. Their north–south separation was ∼0.7RE. Before CDD onset at 02:23:49 UT, both Bx and Bycomponents at P4 had small values (|Bx|,|By|<1.5 nT) in comparison with theBz component, indicating the close proximity of P4 to the neutral sheet. CDD onset started with a small increase in theBzcomponent, followed by large fluctu-ations with a high value of 39.7 nT and a low value of 6.4 nT during the subsequent 4 min. At 02:28 UT, its value became 32.8 nT. TheBz variations and the subsequent increase are characteristics of CDD near the neutral sheet.
P5 was further away from the neutral sheet than P4, as indicated by the high magnitude of theBxcomponent. How-ever, considerable fluctuations in theBzcomponent were de-tected. Since P4 and P5 had nearly identical equatorial
pro-jections, the current densities embedded in the layer between these two satellites can be obtained with the application of the integral form of Amp`ere’s law. Magnetic field data sam-pled with a time resolution of 0.25 s were used in this cal-culation. The changes in current densities over a larger time interval (02:20–02:40 UT) are shown in Fig. 1d. It is found thatJyincreased slightly from∼100 to 106 kA/REjust prior to the CDD onset, whileJxdecreased slightly from∼32 to 26 kA/RE. At CDD onset, there was a sharp drop inJydown to 61 kA/REaccompanied by a substantial increase inJxup to 42 kA/RE, suggesting a part ofJywas directed earthward initially. After onset, bothJx andJy varied tremendously, with occasional values larger than their values before onset. The timescale of variations was very short, i.e., in the kinetic regime of seconds. For example, at 02:24:46 UT,Jychanged from 126 to 85 kA/RE in 3 s. At 02:26:18 UT, Jy changed from−17 to 119 kA/RE in 3 s. Similar rapid changes were seen inJx. At 02:24:38 UT,Jxchanged from 2 to 34 kA/RE in 3 s. At 02:25:58 UT,Jxchanged from 42 to 4 kA/REin 3 s. The value ofJxeven became negative at several short inter-vals. At the end of the interval (02:40 UT),JyandJxsettled down to 62 and 12 kA/RE, respectively. These values repre-sent reductions of∼42 % and∼54 %.
It is important to distinguish the substorm current system from the R1/R2 current system generated by the solar wind– magnetosphere dynamo (Iijima and Potemra, 1976). In the premidnight sector, Jx for R1/R2 near the neutral sheet is positive, as shown by the observed value prior to the CDD onset. Therefore, to isolate Jx current associated with the substorm, the current value prior to CDD onset needs to be used as the base line, which is indicated by the dotted line in Fig. 1d and has the value of 26 kA/RE. With this base line, one can see thatJxfor the substorm current system due to CDD was often directed tailward. At the end of this inter-val, it became 12 kA/RE, well below its value prior to CDD onset. The averaged value of Jx in the interval 02:23:49– 02:40:00 UT is 16 kA/RE, implying an averaged tailward di-rected current of 10 kA/RE near the neutral sheet for the north–south substorm current system in the ionosphere.
The amount of power involved in the CDD can be esti-mated by forming the dot product of the current density with the electric field averaged over the two satellites. For accu-rate electric field measurements, the power calculation was done in the despun spacecarft coordinates, which is close to the GSE coordinations. Positive values of power implies dis-sipation while negative value implies dynamo action. In the y-direction, the power was mainly dissipation although there were brief intervals with a weak dynamo effect. In the x-direction, the power was mainly negative, i.e., a dynamo.
1134 A. T. Y. Lui: Cross-tail current evolution during substorm dipolarization
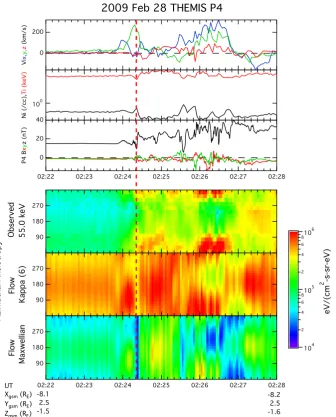
Fig. 2. Observations of current disruption/dipolarization event on 28 February 2009 from THEMIS P4. From the top to bottom are the plasma flow components in GSM coordinates (different colors are used for different components, as indicated by the label), the number density and temperature of ions, the magnetic field components in GSM coordinates (different colors are used for different components, as indicated by the label), the observed azimuthal anisotropy of 50–60 keV ions, the anisotropy expected from plasma flow with a kappa distribution of κ=6, and the anisotropy expected from plasma flow with a Maxwellian distribution.
structure or energization site showing its evolution such as in CDD events. In other words, if the observed anisotropy is not due to plasma flow and shows a significant temporal evo-lution, then the anisotropy of energetic ions observed near the neutral sheet can be used to infer the location of the particle energization site associated with CDD relative to the satel-lite P4. In order to demonstrate this anisotropy is not due to plasma flow, we have calculated the expected anisotropy of energetic ions from plasma flow and compared results with the observed anisotropy. The expected flow anisotropy for 55 keV ions due to plasma flow is calculated for a pop-ulation with kappa distribution of κ=6 and one with a
Maxwellian distribution (corresponding to κ=infinity) us-ing the observed number density, velocity, and temperature. The plasma is assumed to be isotropic in its rest frame. For a kappa distribution with a bulk flowu¯, the differential in-tensity of particles with velocity v¯ in any direction can be calculated by the following expression:
j (v)¯ = N v 2
mw3/2
0(κ+1) κ3/20(κ−1/2)
"
1+(v¯− ¯u) 2
κw2
#−(κ+1)
,
Fig. 3. Time evolution of energy fluxes for 50–60 keV ions around the satellite THEMIS P4, constructed by mapping the measured energy fluxes to the particle’s gyrocenters.
that v¯ andu¯ are vectors and the square of their difference is sum of squares of their differences in three components. For a Maxwellian distribution, the corresponding differential intensity is given by
j (v)¯ = N v 2
mπ3/2w3exp "
−(v¯− ¯u) 2
w2 #
.
The result is shown in Fig. 2. Since the observed fluxes gen-erally lie between the expected fluxes from the kappa and Maxwellian populations, the observed fluxes are consistent with a population having a kappa value larger than 6.
The vertical line marks the onset time 02:24:20 UT for sig-nificant energization and dipolarization for this event. For ∼30 s prior to this onset time, significant anisotropy was observed in association with the duskward flow of up to ∼270 km s−1. Plasma flow components became small right after the onset time. However, the observed anisotropy was enhanced significantly, contrary to the expected decrease in
anisotropy if it were due to plasma flow, as seen in the pan-els showing the anticipated anisotropy. This anticorrelation and the appearance of a time evolving structure confirm that the observed anisotropy right after the onset time is due to remote sensing of particle energization site.
1136 A. T. Y. Lui: Cross-tail current evolution during substorm dipolarization
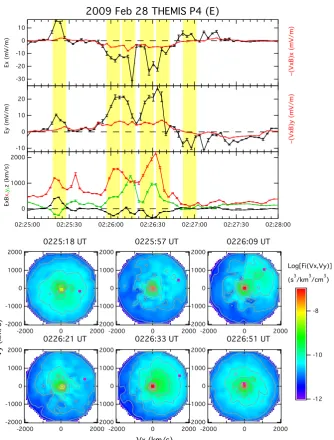
Fig. 4. Comparison between observed electric field componentsExandEyand the values expected from the frozen-in condition ofE= −V×B. The third panel shows the expected plasma flow components from the frozen-in condition. Error bars shown in the top three panels denote the standard errors of the mean. The bottom two rows show a sequence of the ion velocity distributions in the perpendicular flow componentsVxandVyfor comparison to indicate the observed velocity distributions do not match the required velocity shifts (denoted by the red dot) needed to match theE×Bplasma flows.
down the tail since tailward spreading of CDD onset is not related to any wave propagation in the near-Earth current dis-ruption paradigm.
Figure 4 shows the occasional breakdown of the frozen-in condition durfrozen-ing CDD. The observed electric field com-ponents Ex and Ey in the despun spacecraft coordinates are compared with that inferred from the measurements of plasma flowV and magnetic field B based on the frozen-in conditionE= −V×B expected for plasma behaving as a fluid under the MHD condition. Highlighted are six
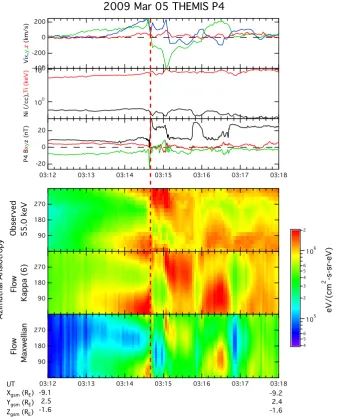
Fig. 5. Observations of the current disruption/dipolarization event on 5 March 2009. The parameters shown and the format are same as Fig. 1.
rows show the ion velocity distribution on the plane of per-pendicular velocity componentsVxandVycorresponding to the highlighted time intervals. If one compares the velocity distribution at these times and the requiredE×B velocity to satisfy the frozen-in condition, indicated by the red dot in each panel, it is evident that the observed velocity distribu-tion does not match the shift for the requiredE×Bvelocity. This further reinforces the result that frozen-in condition was broken occasionally during the CDD interval.
2.2 5 March 2009 event
1138 A. T. Y. Lui: Cross-tail current evolution during substorm dipolarization
Fig. 6. Observations of the current disruption/dipolarization event on 5 March 2009. The parameters shown and the format are same as Fig. 2.
the first minimum SML at−418 nT. The all-sky-cameras at SNKQ and KUUJ stations also showed auroral brightening starting at 03:12 UT, followed by a significant poleward ex-pansion at 03:14 UT.
For this event, both P4 and P5 had nearly the same equato-rial projections and atXgsm≈ −9RE. The two satellites were separated by∼0.7REin the z-direction. P4 was closer to the neutral sheet than P5, as indicated by the magnitude of theBx component detected by both satellites. The first indication of current reduction was noted at P5 when theBx component showed a gradual but significant decrease for∼1 min long, accompanied by a gradual increase inBzcomponent. About the same time, there was also a noticeable increase of Bz component at P4. A sharp increase of theBz component at both satellites occurred later after∼03:14 UT but lasted for
<1 min. Sustained dipolarization started at 03:16:30 UT and 03:16:25 UT for P5 and P4, respectively.
Fig. 7. Remote sensing of energization site for the current disruption/dipolarization event on 5 March 2009, with format same as Fig. 3.
began to decrease significantly, even reversing in direction briefly before settling down to a positive value. At 03:22 UT, Jy andJxhad values of 73 and 19 kA/RE, representing de-creases of∼55 % and∼68 % from their initial values, re-spectively. Similar to the previous event, the timescale of current changes is in seconds. As before, to isolateJx cur-rent associated with R1/R2 curcur-rent system, a base line of 60 kA/REis shown in Fig. 5d to visualize theJxchange as-sociated with the substorm current system due to CDD. With this base line, it can be seen thatJx was earthward initially for a brief moment (like the first event) but was almost al-ways tailward afterwards. The average value ofJxin the time interval 03:14:20–03:30:00 UT is 28 kA/RE, implying an av-eraged tailward directed current of 32 kA/RE near the neu-tral sheet for the north–south substorm current system in the ionosphere.
We also estimate the power/dynamo for this event from the dot product of the current density with the electric field averaged over the two satellites. The result shows that it was mainly dissipative in the y-direction. In the x-direction, the power was mainly negative, i.e., a dynamo. This is also sim-ilar to the result for the previous event.
Figure 6 shows the evaluation of whether the observed anisotropy of energetic ions arises from plasma flow or from remote sensing of the CDD energization site. When the en-ergy fluxes in the three anisotropy panels are compared, it can be inferred that the ion population had a kappa value larger than 6 since the observed energy fluxes were between the fluxes shown in the two calculated anisotropy. Prior to the abrupt dipolarization at P4, there was a substantial earthward–duskward anisotropy that can be related to plasma flow. However, at the time of dipolarization onset, the ob-served fluxes in the 270–360◦ angular sector far exceeded that expected from flow anisotropy for∼1.5 min. Therefore,
the observed anisotropy associated with significant time vari-ation is a result of remote sensing of the energizvari-ation site.
Figure 7 shows the sequence of projections created by mapping the observed fluxes to their respective gyrocen-ters. It can be seen that the energization site was initially earthward–duskward of the satellite. At a later time, it moved down the tail to a position mostly duskward of the satellite. The motion was not uniform though.
Figure 8 shows that the frozen-in condition was broken in-termittently during this CDD interval. During this breakdown in the highlighted time interval, the top two panels show that the observed electric field components were larger than the values inferred fromE= −V×B. Furthermore, the inferred ion velocities based on the frozen-in condition (marked by red dots in the velocity distribution plots) were also much higher than the velocity shift in the ion velocity distribu-tions during the breakdown interval. The results of these two checks are similar to those found in the previous event.
3 Summary and discussion
1140 A. T. Y. Lui: Cross-tail current evolution during substorm dipolarization
Fig. 8. Observations for the current disruption/dipolarization event on 5 March 2009. The parameters shown and the format are same as Fig. 4.
1. The changes in the current densities embedded in the layer between the two satellites during CDD were sig-nificant, with the eventual current reduction in the neighborhood of∼40–70 % from initial values of ∼ 100–170 kA/REbefore CDD onset.
2. The current densities fluctuated considerably with a timescale in the kinetic regime of seconds.
3. There was a temporal increase in theJxcomponent ac-companying the initial decrease in theJycomponent. 4. By isolating theJxcontribution from R1/R2 current
sys-tem, theJxcomponent due to CDD was found to be al-most always directed tailward.
5. With electric field measurements, the associated power/dynamo was estimated to be in tens of GW/R2E. 6. The power in the dawn–dusk direction was typically
positive, i.e., dissipation, while the power in the sun– tail direction was typically negative, i.e., dynamo.
7. Associated with the CDD onset was a short interval dur-ing which the anisotropy of energetic ions observed by the satellite close to the neutral sheet was due to remote sensing of CDD energization site and not due to plasma flow.
8. The initial location of the CDD energization site was earthward of the satellite location, i.e., earthward of the downtail distances of 8–9RE.
9. The CDD energization site was observed to move down-tail at later times.
10. Occasional breakdown of the frozen-in condition was found during CDD in which the observed electric field components far exceeded the values inferred fromE= −V×B. The velocity shifts of the observed ion ve-locity distributions were much less than inferred from V =E×B/B2.
suggests a kinetic process such as the cross-field current in-stability (Lui et al., 1991; Yoon and Lui, 1993) and short time-scale form of ballooning instability (Liu et al., 2012). These rapid variations are expected since CDD has been shown to have characteristics of turbulence, as demonstrated by fractal and multifractal analyses (Ohtani et al., 1995; Lui and Najmi, 1997; Lui, 2002) as well as scaling features of the probability distribution function (Consolini et al., 2005). The fact that bothJxandJyfluctuated considerably suggests the breakup of the cross-tail current into filamentary currents within the CDD site, as shown by particle simulation of the cross-field current instability (Lui, 2004). These are the fine structures in the substorm current system, including its asso-ciated field-aligned current based on the current continuity condition. They are likely to be related to the fine structures in auroras seen during substorm activity.
The initial increase inJxwith decrease inJy, coupled with the evidence of CDD starting earlier earthward of the satel-lite, suggests that current redirection in the x-direction may be an indication of partial replenishment of the current dis-rupted at the earthward site.
The location of CDD inferred from remote sensing of en-ergetic ions indicates that substorm onset process in the tail can occur in a region where the magnetic field normal to the neutral sheet can be very strong, ruling out the possibility of magnetic reconnection as the substorm onset process. Fur-thermore, in these two events, CDD was associated with dis-sipation in the dawn–dusk direction, an indication of energy conversion from field to particles. It was also associated with a dynamo in the sun–tail direction, an indication of the driver location near the neutral sheet for the north–south current portion of the substorm current system in the ionosphere as depicted in Lui and Kamide (2003). In their scenario, the ki-netic plasma instability is triggered when the ions become unmagnetized. During CDD, electrons move earthward with the collapsing field lines while the ions cannot keep up with the electron motion (the field line slippage condition). This produces an earthward pointing electric field and a tailward directed current simultaneously, i.e., creating a dynamo in this process.
One may note that fast transient current changes in CDD events have shorter durations than the entire dipolariza-tion interval seen locally at the satellite. This difference in timescale is expected from the substorm onset scenario pro-posed in the near-Earth current disruption paradigm, e.g., Lui et al. (1991). The kinetic plasma instability has global con-sequences since it reduces the local current density, changes the local Lorentz force to upset the prior force balance, and causes a collapse of the stretched field line configuration. In addition, it induces plasma sheet thinning in adjacent regions by sending a rarefaction wave downtail. This can instigate the onset of the kinetic instability at a slightly tailward site if sufficient plasma sheet thinning is achieved later to excite the instability. The further collapse of the stretched field line configuration in this adjacent thin plasma sheet can lead to a
more sustained dipolarization earthward of this adjacent site. This situation is similar to an avalanche in which a small lo-cal disturbance can lead to a large-slo-cale one with totally dif-ferent time and spatial scales from the local disturbance.
It should be noted that since there is a time delay between onset of plasma sheet thinning due to arrival of the rarefac-tion wave and time interval required for the plasma sheet to thin down enough to excite the current disruption instability, the speed for tailward spreading of current disruption cannot be equated to the rarefaction wave speed.
Acknowledgements. This work was supported by the NSF grant ATM-0852508 and NASA grant NNX12AP62G to The Johns Hopkins University Applied Physics Laboratory, and by NAS5-02099 for THEMIS mission support. We acknowledge NASA con-tract NAS5-02099 and V. Angelopoulos for use of data from the THEMIS mission through AIDA at Institute of Space Science, Na-tional Central University in Taiwan; C. W. Carlson and J. P. Mc-Fadden for use of ESA data; D. Larson and R. P. Lin for use of SST data; J. W. Bonnell for use of EFI data; and K.-H. Glassmeier, U. Auster and W. Baumjohann for use of FGM data provided un-der the lead of the Technical University of Braunschweig and with financial support through the German Ministry for Economy and Technology and the German Center for Aviation and Space (DLR) under contract 50 OC 0302.
Guest Editor M. Balikhin thanks N. Ganushkina and one anony-mous referee for their help in evaluating this paper.
References
Akasofu, S.-I.: The development of the auroral substorm, Planet. Space Sci., 12, 273–282, 1964.
Angelopoulos, V.: The THEMIS mission, Space Sci. Rev., 141, 453–476, doi:10.1007/s11214-008-9336-1, 2008.
Auster, H. U., Glassmeier, K. H., Magnes, W., Aydogar, O., Baumjohann, W., Constatntinescu, D., Fischer, D., Fornacon, K. H., Georgescu, E., Harvey, P., Hillenmaier, O., Kroth, R., Ludlam, M., Narita, Y., Nakamura, R., Okrafka, K., Plaschke, E., Richer, I., Schwarzl, H., Stoll, B., Valavanoglou, A., and Wiedemann, M.: The THEMIS fluxgate magnetometer, Space Sci. Rev., 141, 235–264, 2008.
Bonnell, J. W., Mozer, F. S., Delory, G. T., Hull, A. J., Ergun, R. E., Cully, C. M., Angelopoulos, V., and Harvey, P. R.: The electric field instrument (EFI) for THEMIS, Space Sci. Rev., 141, 303– 341, doi:10.1007/s11214-008-9469-2, 2008.
Consolini, G., Kretzschmar, M., Lui, A. T. Y., Zimbardo, G., and Macek, W. M.: On the magnetic field fluctuations during magne-tospheric tail current disruption: A statistical approach, J. Geo-phys. Res., 110, A07202, doi:10.1029/2004JA010947, 2005. Gjerloev, J. W.: A Global Ground-Based Magnetometer Initiative,
EOS, 90, 230–231, 2009.
Iijima, T. and Potemra, T. A.: The amplitude distribution of field-aligned currents at northern high latitudes observed by Triad, J. Geophys. Res., 81, 2165–2174, 1976.
trig-1142 A. T. Y. Lui: Cross-tail current evolution during substorm dipolarization
gers substorm onset?, J. Geophys. Res., 117, A11220, doi:10.1029/2012JA018161, 2012.
Lui, A. T. Y.: Multiscale phenomena in the near-Earth magneto-sphere, J. Atmos. Solar-Terr. Phys., 64, 125–143, 2002. Lui, A. T. Y.: Potential plasma instabilities for substorm expansion
onset, Space Sci. Rev., 113, 127–206, 2004.
Lui, A. T. Y.: Reduction of the cross-tail current during near-Earth dipolarization with multi-satellite observations, J. Geophys. Res., 116, A12239, doi:10.1029/2011JA17107, 2011.
Lui, A. T. Y. and Kamide, Y.: A fresh perspective of the substorm current system and its dynamo, Geophys. Res. Lett., 30, 1958, doi:10.1029/2003GL017835, 2003.
Lui, A. T. Y. and Najmi, A.-H.: Time-frequency decomposition of signals in a current disruption event, Geophys. Res. Lett., 24, 3157–3160, 1997.
Lui, A. T. Y., Chang, C.-L., Mankofsky, A., Wong, H.-K., and Winske, D.: A cross-field current instability for substorm expan-sions, J. Geophys. Res., 96, 11389–11401, 1991.
McFadden, J. P., Carlson, C. W., Larson, D., Angelopoulos, V., Lud-lam, M., Abiad, R., Elliott, B., Turin, P., and Marckwordt, M.: The THEMIS ESA plasma instrument and in-flight calibration, Space Sci. Rev., 141, 277–302, doi:10.1007/s11214-008-9440-2, 2008.
Ohtani, S., Higuchi, T., Lui, A. T. Y., and Takahashi, K.: Magnetic fluctuations associated with tail current disruption: fractal analy-sis, J. Geophys. Res., 100, 19135–19145, 1995.