Ann. Geophys., 27, 1951–1960, 2009 www.ann-geophys.net/27/1951/2009/
© Author(s) 2009. This work is distributed under the Creative Commons Attribution 3.0 License.
Annales
Geophysicae
Development of substorm bulges during different solar wind
structures
I. V. Despirak1, A. A. Lubchich1, A. G. Yahnin1, B. V. Kozelov1, and H. K. Biernat2 1Polar Geophysical Institute, Apatity, Russia
2Space Research Institute, Graz, Austria
Received: 27 August 2008 – Revised: 23 March 2009 – Accepted: 13 April 2009 – Published: 4 May 2009
Abstract. Using data from WIND spacecraft, we inves-tigated the difference in substorm bulge development dur-ing different types of solar wind flow: solar wind recur-rent streams (RS), corotating interaction regions (CIR), mag-netic clouds (MC), and the region of interaction of magmag-netic clouds with undisturbed solar wind (Sheath). The RS/CIR and MC/Sheath structures were examined for the periods December 1996–July 1997; January 2000–December 2000; October 2001. All available auroral substorms observed by the Ultra Violet Imager onboard the Polar spacecraft during these periods were studied. It is shown that the largest latitu-dinal and longitulatitu-dinal sizes of the auroral bulge expansions are during CIR and Sheath intervals. We found a difference in auroral bulge parameters for MC- and RS-associated sub-storms. In contrast to substorms associated with RS, the lati-tudinal size of the auroral bulge during MC is smaller, but longitudinal size is larger. As consequence, the ratio be-tween longitudinal and latitudinal sizes for MC-associated substorms is also larger. We suggest that the latter feature is explained by different configuration of the near-Earth mag-netotail during RS and MC.
Keywords. Magnetospheric physics (Auroral phenomena; Solar wind-magnetosphere interactions; Storms and sub-storms)
1 Introduction
It is variations in the solar wind conditions that majorly gov-ern the development of substorm disturbances. The substorm poleward expansion, as well as auroral bulge formation and dynamics, are determined by the amount of energy accumu-lated in the magnetospheric lobes, which, in turn, depends on
Correspondence to: I. V. Despirak ([email protected])
the solar wind parameters (Shukhtina et al., 2005; Miyashita et al., 2003). The progress of substorm activity down the magnetospheric tail, which is displayed in the ionosphere as a substorm poleward expansion up to high geomagnetic latitudes, is controlled by the solar wind velocity VX, and
the southward componentBZof the interplanetary magnetic
field (Gussenhoven, 1982; Zverev et al., 1979; Dmitrieva and Sergeev, 1984; Yahnin et al., 2004). At the same time, it has been shown that at high latitudes, substorms occur more frequently during solar minimum conditions (Dmitrieva and Sergeev, 1984; Despirak et al., 2008), and correlate with the solar wind recurrent streams (Sergeev et al., 1979). This means that substorm expansion is not governed solely byVX
andBZIMF but also by the structure of solar wind flow.
Solar wind flow may be different depending on the state of solar activity. Thus during solar minimum, the recurrent streams (RS) originating from coronal magnetic holes, char-acterized by 27-day recurrence, are predominant (Krieger et al., 1973; Pudovkin, 1996). During solar maximum, most common are sporadic flows associated with coronal mass ejections (CME) (Wang and Sheeley, 1994; Webb and Howard, 1994). Near the Earth they are observed as mag-netic clouds (MC) (e.g., Burlaga et al., 1982). Ahead of both MC and RS, the regions of interaction with undisturbed solar wind (Sheath and CIR) are known to form, which are char-acterized by high density, increased pressure and strong IMF variability.
1952 I. V. Despirak et al.: Development of substorm bulges Sheath, and CIR, differ in intensity, recovery phase duration,
etc. (e.g., Huttunen et al., 2006; Pulkkinen et al., 2007; Yer-molaev and YerYer-molaev, 2006). Therefore, we will search for distinctions in the development of substorms occurring dur-ing both geomagnetic storms connected with the MC, Sheath and CIR, and rather quiet “non-storm” periods of RS.
The purpose of this study is to clear up how four different solar wind structures (MC, Sheath, CIR, and RS) affect the auroral bulge development. We use the optical data of sub-storm development from the Polar satellite which are com-pared with interplanetary medium parameters measured by the Wind satellite.
2 Data
The auroral bulge development is studied by Polar UVI data in the LBHL band (1600–1800 ˚A). A special procedure is used for determination of the boundary and the size of the auroral bulge from the Polar UVI images. The luminosity of the UV aurora is divided into 25 intervals according to
I=I0·101·n, whereI0∼3.2 photons cm−2s−1,1=0.1, andn
is the interval number. A background level of the auroral oval luminosity for every considered substorm was determined as the luminosity observed before the substorm onset at the on-set meridian. The auroral bulge area is defined as the area where the auroral luminosity is at the level next above the background. Typically, under relatively quiet (non-storm) conditions, this corresponds to level of the photon flux of 10–25 photons cm−2s−1. However, under storm-time condi-tions the selected level for the auroral bulge determination can reach up to 200 photons cm−2s−1. Further, the onset
lat-itude (L0)is determined as the lower latitude at the selected luminosity level of the first UV aurora spot during the sub-storm. The same selected luminosity level is used to con-trol the auroral bulge expansion (note, that for this only spots connected with the onset one was considered, not the other, separated spots at different locations). The same luminos-ity level is used to define the maximal latitude of the bulge development (Lm)as well as maximal latitudinal (LF)and
longitudinal dimensions of the bulge (Ld).
As assumed, the storms and substorms are different mag-netospheric/ionospheric dynamical processes (e.g., Tsurutani and Gonzalez, 2006). If a substorm occurs during the storm time, it has the same typical signatures as a substorm devel-oping during non-storm conditions. Namely, on the Polar UVI auroral images one can see: (1) the burst of luminous spot, (2) expansion of spot to the pole and in longitude, and (3) decay of spot. Development of substorm bulge during the storm time has the same time scale as “usual” substorms, i.e., from 10 min up to an hour. Therefore we will determine the parameters of auroral bulge during storm-time conditions in the same way as for “usual” substorms, of course, taking into account the higher background level of the auroral oval luminosity during storm-time conditions.
The solar wind and interplanetary magnetic field parame-ters were taken from the WIND satellite data (SWE and MFI data with 1 min resolution were used). The X-component of the solar wind velocityVX, the southward IMF component BS, and dawn-dusk component of the interplanetary electric
fieldEW are chosen as measure of the solar wind/IMF
influ-ence. We used the values of these parameters averaged over two hours up to the time of maximum substorm development, i.e., V¯X=N−1·
N P
i=1
VXi, B¯S=N−1· N P
i=1
BSi (BSi=−BZi, for
BZi≤0, and BSi=0, otherwise), and E¯W=N−1· N P
i=1 EW i
(EW i=EY i≡[Vi×Bi]Y, for EY i≥0, and EW i=0,
other-wise), whereN∼120. Two hours averaging interval was cho-sen to include both the growth phase∼1 h (see, e.g., McPher-ron, 1970) and expansive phase ∼1 h (see, e.g., Akasofu, 1964) up to maximum substorm development, since energy input from the solar wind to the magnetosphere may continue during substorm explosive phase as well, if the interplanetary magnetic field (IMF) keeps the southward direction.
The magnetic clouds (MC) are characterized as regions, where the magnetic field strength is higher than the average, the density is relatively low, the magnetic pressure strongly exceeds the ion thermal pressure, the magnetic field direc-tion changes through the cloud by rotating parallel to a plane which is highly inclined with respect to the ecliptic (Burlaga et al., 1982).
In front of the magnetic cloud there is a region of inter-action with undisturbed solar wind (Sheath). This region is characterized by an increase in pressure, temperature, and density of the solar wind.
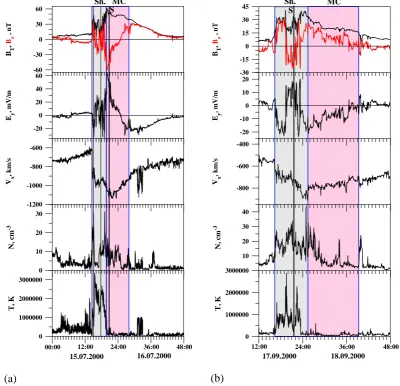
Two examples of magnetic cloud observation are shown in Fig. 1. On the left panels, one can see the SW and IMF data during the passage of second magnetic cloud of the Bastille Day event (15–16 July 2000). Here we have used the Geotail satellite data from OMNI set because of a temporary gap in the WIND data during this event. On the right panels, the WIND data during MC on 17–18 September 2000 are given. The events of magnetic clouds as well as the start and finish times of their observation were taken from: http: //lepmfi.gsfc.nasa.gov/mfi/mag cloud pub1.html. All auro-ral substorms observed by Polar during 15 MCs for the year 2000, in October 2001, December 1996 and from January to July 1997 were studied. All substorms were divided into 2 groups: substorms observed during the passage of the mag-netic clouds (21 events, 1st group), of the Sheath (11 events, 2nd group). For 6 magnetic clouds, substorms have been observed from Polar during both Sheath and MC, whereas for 5 (4) events substorms have been observed only during the passage of one structure: MC (Sheath). In 3 cases from 21 events of 1st group the substorms occurred in the begin-ning of the magnetic cloud when, e.g., a substorm growth phase was realized during the Sheath interval and an expan-sive phase occurred at the time of MC passage. In the other
I. V. Despirak et al.: Development of substorm bulges 1953
The corrected Fig.1:
0 1000000 2000000 3000000
T, K
0 10 20 30
N, cm
-3
-20 0 20 40 60
Ey
, m
V
/m
-1200 -1000 -800 -600
Vx
, k
m
/s
-60 -30 0 30 60
BT
,
Bz
,
nT
00:00 12:00 24:00 36:00 48:00
15.07.2000 16.07.2000
S Sh. MC
(a)
0 1000000 2000000 3000000
T,
K
10 20 30 40
N,
c
m
-3
-20 -10 0 10 20
Ey
, m
V
/m
-800 -600 -400
Vx
, km
/s
-30 -15 0 15 30 45
BT
,
Bz
, n
T
12:00 24:00 36:00 48:00
17.09.2000 18.09.2000
Sh. MC
S
[image:3.595.95.496.66.452.2](b)
Fig. 1. Total magnetic fieldBT (black line) and north-south componentBZof IMF (red line), Y-component of the interplanetary electric
fieldEY, X-component of the solar wind velocityVX, solar wind proton densityN and proton temperatureT for two cases of MC/Sheath
observation close to 1 AU. The intervals of observation of MC and Sheath are marked by pink and grey colour, respectively. Vertical blue lines mark the start and finish of MC/Sheath structures. The times of substorm observation onboard the Polar spacecraft are marked by vertical black dashed and solid lines, where the solid line correspond to the time of maximum development of substorm, for which the Polar UVI data are shown below, in Fig. 3.
cases from 1st group the substorms have been observed no less than 2 h after the MC beginning. All substorms of 2nd group occurred in the middle or nearer to the end of Sheath region. For the examples shown in Fig. 1, the times of sub-storms observation by Polar during Sheath/MC structures are indicated by vertical black lines.
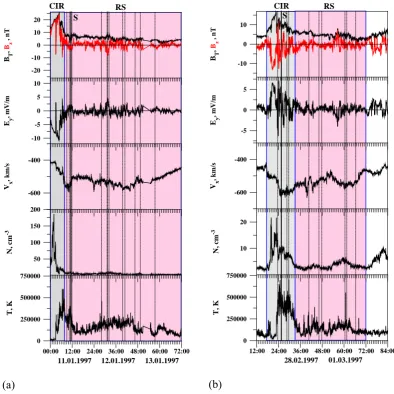
Recurrent streams are determined as high-speed streams, which reappear in each solar rotation, thus giving 27-days periodicity in the occurrence of these streams. The recur-rent streams are characterized by increased solar wind veloc-ity (|VX|>500 km/s), and lower (than the average) density;
the duration of these streams is∼3–4 days (e.g., Pudovkin, 1996). In front of the recurrent stream there is a region of the
interaction with slower streams (CIR). CIR is determined as a region with magnetic field and plasma compression (Balogh et al., 1999).
Two examples of recurrent stream observation are shown in Fig. 2. The left (right) panels correspond to the recur-rent stream passing on 11–13 January 1997 (27 February–1 March 1997). The start and finish time for the CIR and RS regions passage are determined by visual data inspection ac-cording to their properties.
1954 I. V. Despirak et al.: Development of substorm bulges
24
0 250000 500000 750000
T, K
50 100 150 200
N,
c
m
-3
-10 -5 0 5 10
Ey
, mV
/m
-600 -400
Vx
, km
/s
-20 -10 0 10 20
BT
,
Bz
, n
T
00:00 12:00 24:00 36:00 48:00
11.01.1997 12.01.1997
60:00 72:00
CIR RS
13.01.1997
S
(
a)
0 250000 500000 750000
T, K
10 20
N,
c
m
-3
-5 0 5
Ey
, m
V
/m
-600 -400
Vx
, k
m
/s
-10 0 10
BT
,
Bz
, n
T
12:00 24:00 36:00 48:00 60:00
28.02.1997 01.03.1997
72:00 84:00
CIR RS
S
(
b)
[image:4.595.98.493.61.456.2]Figure 2.
Fig. 2. The format is the same as in Fig. 1, but for the RS/SIR events. The pink and grey colours mark the intervals of observation of RS and
CIR, respectively.
groups: substorms observed during the passage of the recur-rent streams (72 events, 1st group), and of the CIR (26 events, 2nd group). The majority of selected substorms occur at least 2 h after the beginning of corresponding structure.
The total durations of the selected intervals are equal to about 440, 190, 320, and 130 h for the RS, CIR, MC, and Sheath structures, respectively.
3 Results
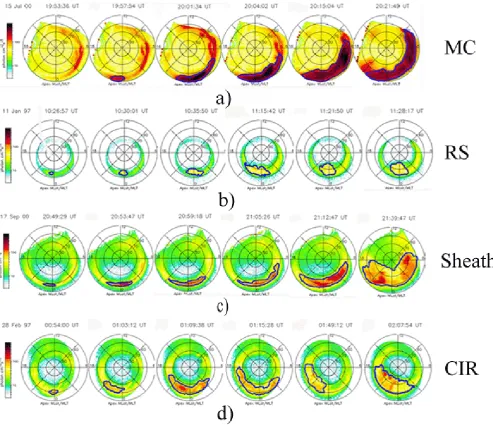
In Fig. 3 examples of auroral bulge development during the passage of 4 different solar wind structures, given in Figs. 1– 2, are shown. In Fig. 3a, the substorm development during MC of 15 July 2000 (shown in Fig. 1a), is presented; in Fig. 3b – the one during RS of 11 January 1997 (shown in Fig. 2a), in Fig. 3c – the one during Sheath of 17
Septem-ber 2000 (shown in Fig. 1b), and in Fig. 3d – the one dur-ing CIR of 28 February 1997 (shown in Fig. 2b). The blue curve delimits the bulge region on each auroral image. In Figs. 1–2 the vertical black solid lines indicate the time of maximum substorm development. The substorm of 15 July 2000 occurred during the main phase of the magnetic storm, under the extremely large values of the solar wind velocity, southward IMF, and dawn-dusk component of the IEF (see Fig. 1a). For this case the background level of the auro-ral oval luminosity before the substorm onset was equal to 158 photons cm−2s−1.
In Table 1 the parameters of auroral bulge for these 4 examples are given. There are the latitudes and sizes of the bulge and the ratio between bulge sizes. We note that the bulge latitudinal size is not equal to the difference be-tween the onset and maximum latitudes. This is because this size is measured at the moment of maximum substorm
I. V. Despirak et al.: Development of substorm bulges 1955
25
[image:5.595.50.544.61.486.2]Figure 3.
Fig. 3. Examples of substorm development by Polar UVI data during the passage of different solar wind structures: magnetic cloud (a),
recurrent stream (b), Sheath (c) and CIR (d). On each auroral image the blue curve delimits the bulge region.
development. A comparative analysis of these examples shows that the auroral bulge was formed at very low geo-magnetic latitudes during MC, whereas three further exam-ples refer to the “high latitudinal” substorms, for which the poleward edge of the auroral bulge propagated up to very high latitudes (∼80◦CGLAT). The event shown on the up-per panel of Fig. 3a is an example of substorm develop-ment under extremely high values of solar wind parame-ters (VX∼–1022 km/s, BZ∼–35 nT) and the auroral bulge
dynamics during magnetic storm main phase (Dst∼–198).
For this extreme event the ratio between longitudinal and latitudinal sizes of the bulge is maximal. It will be shown below that for the other substorms of the MC category the ratio between bulge sizes is also higher in comparison with
that for substorms of the RS category. The substorm pre-sented on Fig. 3b developed underVX∼–550 km/s andBZ∼–
1.5 nT during a non-storm interval (Dst∼–28). The
sub-storms illustrated on the bottom panels (3c and 3d) devel-oped under high values of solar wind parameters (VX∼–
705 km/s and−585 km/s;BZ∼–12.5 nT and−5.5 nT). The
Sheath-associated substorm (Fig. 3c) was observed at the “initial” phase of storm (Dst∼–61), whereas CIR-associated
substorm (Fig. 2d) occurred during the storm main phase (Dst∼–67).
As seen from Table 1, the latitudinal and longitudinal di-mensions of the auroral bulge of substorms, occurred dur-ing MC, Sheath, RS, and CIR, are different. This difference manifests more clearly in Fig. 4, where these dimensions are
1956 I. V. Despirak et al.: Development of substorm bulges
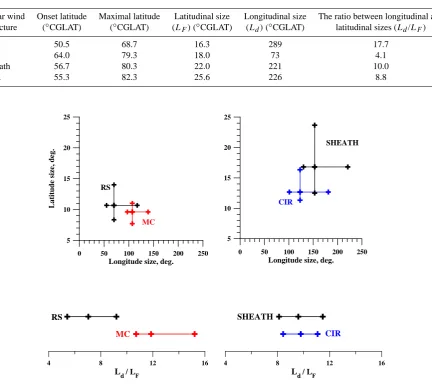
Table 1. Latitudes and sizes of the auroral bulge and ratio between bulge sizes for four solar wind structures (MC, RS, Sheath and CIR).
Solar wind Onset latitude Maximal latitude Latitudinal size Longitudinal size The ratio between longitudinal and
structure (◦CGLAT) (◦CGLAT) (LF)(◦CGLAT) (Ld)(◦CGLAT) latitudinal sizes (Ld/LF)
MC 50.5 68.7 16.3 289 17.7
RS 64.0 79.3 18.0 73 4.1
Sheath 56.7 80.3 22.0 221 10.0
CIR 55.3 82.3 25.6 226 8.8
26
0 50 100 150 200 250
Longitude size, deg.
5 10 15 20 25
Latitude size,
deg.
RS
MC
0 50 100 150 200 250
Longitude size, deg.
5 10 15 20 25
SHEATH
CIR
4 8 12 16
Ld / LF RS
MC
4 8 12 16
Ld / LF CIR SHEATH
[image:6.595.57.535.90.166.2]Figure 4.
Fig. 4. The median values, first and third quartiles of distribution of auroral bulge parameters for MC and RS (left column), Sheath and
CIR (right column). The upper panels show the latitudinal and longitudinal sizes, and the bottom panels present the ratio of longitudinal to latitudinal sizes.
compared. Here are presented the median values of latitu-dinal and longitulatitu-dinal sizes, first and third quartiles of their distributions. On the left panel, one can see the longitudinal and latitudinal bulge sizes and their ratios for the substorms during MCs and RS’s, on the right panel – those for CIR- and Sheath-associated substorms. For RS-associated substorms, the latitudinal size of the auroral bulge is, in average, larger than for MC-associated substorms. An opposite relationship holds true for the longitudinal sizes, the average value be-ing higher for MC-associated substorms. The effect becomes more evident if we examine the ratio of latitudinal and lon-gitudinal dimensions of the bulge for RS and for MC events. This ratio is rather stable and always less for MC than for RS events. In particular, this ratio for MC-associated substorm shown in Fig. 3a is 4.4 times less than that for RS-associated one given in Fig. 3b. For Sheath and CIR conditions, the
sizes of the bulge are very large: the latitudinal sizes are comparable to the bulge sizes for RS-associated substorms, whereas the longitudinal sizes are comparable or larger than those for MC-associated substorms.
It is considered how the solar wind parameters influence on the latitudinal location of auroral bulge edges for MC-, CIR-, Sheath-, and RS-associated substorms. In Fig. 5 are shown the onset and maximum latitudes versus the solar wind parameters. The panels, from left to right, present the latitudes dependences on the solar wind velocity|VX|, on the
southward IMF componentBS, and on the dawn-dusk
com-ponent of the interplanetary electric field. The upper (bot-tom) panel in Fig. 5 shows the dependencies for magnetic cloud (CIR), the second (third) panel shows the dependencies for recurrent streams (Sheath). As one can see from Fig. 5, the difference between the onset and maximum latitudes for
I. V. Despirak et al.: Development of substorm bulges
The corrected Fig.5:
1957300 400 500 600 700 800 9001000
|VX|, km/s 50 55 60 65 70 75 80 85 Latitudes , deg.
0 6 12 18 24 30 36
B S, nT
50 55 60 65 70 75 80 85 Latitude s, de g.
0 5 10 15 20 25 30 35 40
EW, mV/m 50 55 60 65 70 75 80 85 L a ti tu des , d eg.
(a) MC
400 500 600 700
|V X|, km/s
50 55 60 65 70 75 80 85 Latitudes, deg.
0 1 2 3 4 5
B S, nT
50 55 60 65 70 75 80 85 L a titudes , d eg.
0 1 2 3
EW, mV/m 50 55 60 65 70 75 80 85 La titudes, deg.
(b) RS
300 400 500 600 700 800 900 1000
|VX|, km/s 50 55 60 65 70 75 80 85 Lati tu des , d eg.
0 2 4 6 8 10 12 14
BS, nT 50 55 60 65 70 75 80 85 Latitudes , deg.
0 2 4 6 8 10
E W, mV/m
50 55 60 65 70 75 80 85 La ti tu des, deg .
(c) Sheath
300 400 500 600 700
|V X|, km/s
50 55 60 65 70 75 80 85 Lat it u d es, deg.
0 4 8 12
B S, nT
50 55 60 65 70 75 80 85 Latitude s, de g.
0 1 2 3 4
E W, mV/m
[image:7.595.100.497.81.636.2]50 55 60 65 70 75 80 85 Latitu des, d e g.
(d) CIR
Fig. 5. Onset (blue symbols and line) and maximum (red symbols and line) latitudes of auroral bulge depending on the radial component of
1958 I. V. Despirak et al.: Development of substorm bulges all types of substorms increases with the increase of all
con-sidered interplanetary parameters. The onset latitude de-creases in all cases. For RS, CIR, and Sheath-associated sub-storms the maximum latitude increases with the increase of all solar wind parameters. However, for MC-associated sub-storms the maximum latitude decreases with the increase of the solar wind velocity|VX|. The dependence onBSandEW
is not evident because of strong impact of the outlier points with extremely large values ofBS andEW. However, it is
possible to assert that in the MC category of substorms the maximum latitude increases slowly with the increase ofBS
andEW in comparison with the RS category. Indeed,
exclu-sion of two outlier points leads to increase of the slope of the fit from 0.02 to 0.65 for dependence onBS and from−0.02
to 0.97 for dependence onEW, whereas for substorms in the
RS category the slope is equal to 1.31 and 2.46 for depen-dence onBS andEW, respectively. It is also seen that the
auroral bulge developed at higher latitudes during recurrent streams than during magnetic clouds.
4 Discussion
We found a difference in auroral bulge “geometry” for MC-and RS-associated substorms. The auroral bulges of sub-storms that are observed during magnetic clouds are, in aver-age, wider in longitude and narrower in latitude than those re-lated to recurrent streams (Fig. 4). In addition, we found that during MC, the ratio of latitudinal and longitudinal dimen-sions of the bulge is rather stable and always less than that for RS. In other words, during MC the auroral bulge has a relatively small latitudinal size, for it is more extended along longitude.
The reason for such different “geometry” of the auroral bulge may be in different configuration of the geomagnetic tail during the MC and RS. As a rule, the magnetic clouds, as well as the Sheath and CIR, are associated with geomagnetic storms (e.g., Wilson, 1987; Tsurutani et al., 2006), while during the passage of recurrent streams, the storms do not typically occur. This is the case for the events examined in this study: all MC-associated substorms here considered were observed against a geomagnetic storm background, at either storm main phase or recovery phase (Dst∼–110); the
substorms that occurred during Sheath, referred to the be-ginning of storm (Dst∼–40); the substorms observed
dur-ing recurrent streams corresponded to non-storm conditions (Dst∼–18); the CIR-associated substorms referred to either
non-storm intervals (Dst∼–20) or to CIR-associated storm
development (Dst∼–67).
The configuration of the geomagnetic tail strongly changes under storm conditions. As shown by Pulkkinen et al. (2006), the storm-time geomagnetic tail is more stretched. Pulkkinen et al. (2006) considered the substorms occurred during the passage of MC on 22 October 2001 and showed that under MC-associated storms, an intense thin current sheet forms
that occupies a wider MLT sector of the near Earth tail. The formation of an intense thin current sheet provides favourable conditions for driving magnetic reconnection in this region, which may be a cause of substorm (e.g., Yahnin et al., 2006). Therefore, the substorm can develop in a wider longitudinal sector, without propagating far down the magnetospheric tail. Different “geometry” of auroral bulge under MC and RS conditions, can explain the fact that substorms at high lati-tudes predominantly occur during the period of solar mini-mum (Dmitrieva and Sergeev, 1984; Despirak et al., 2008). It is known that substorm expansion to high latitudes is as-sociated with large values of the solar wind velocity and of the southward IMFBS component (Gussenhoven, 1982;
Dmitrieva and Sergeev, 1984; Weatherwax et al., 1997; Zverev et al., 1979). However, during magnetic clouds even if the values of|VX|andBS are extremely high, the auroral
bulge develops at low latitudes. The bulge area is a measure of magnetic flux at the ionospheric level, the flux through the bulge being equal to that stored in the tail before the substorm onset (Shukhtina et al., 2005). On the other hand, this stored flux is proportional to the solar wind electric field, driving reconnection on the magnetopause. Yahnin et al. (2004) showed that for the fixed values of the solar wind electric field and of IMFBS, the auroral bulge area is nearly the same
in the periods of solar minimum and solar maximum. Still, as one can see, the auroral bulge “geometry” is different. Dur-ing MCs, the substorm can develop in a wider longitudinal sector, and then larger bulge area (associated with large re-connected magnetic flux under high values of|VX|andBS)
does not necessarily mean a substorm expansion to very high latitudes. During RS’s, the auroral bulge “geometry” is dif-ferent: the bulge is more extended in latitude and narrower in longitude; the ratio of the longitudinal and latitudinal sizes several times decreasing. Thus the RS-associated bulge of the same area will develop at higher latitudes. In addition, as shown in this study, the substorms during MCs start at lower latitudes than those during RS’s (Fig. 5, see also Yahnin et al., 2004; G´erard et al., 2004). Under solar minimum (maxi-mum) conditions, it is RS’s (MCs) that majorly contribute to geomagnetic activity (e.g., Richardson et al., 2000). Accord-ingly, substorms at high latitudes predominantly occur in the periods of solar minimum. They are very rare in the periods of solar maximum.
It should be noted that the “high-latitude” substorms can also occur during Sheath events. However, they do not con-tribute much to the overall picture of high-latitude substorm occurrence under solar maximum conditions, since the du-ration of such events is short compared to that of magnetic cloud events (Despirak et al., 2008).
The area of the auroral bulges associated with Sheath and CIR is the largest. Such bulges are most extended in both lat-itude and longlat-itude. Perhaps, this is due to the influence of the compressed, highly dense solar wind plasma (Yermolaev et al., 2005). The auroral bulge area can considered as a mea-sure of the magnetic flux dissipated in the magnetotail during
I. V. Despirak et al.: Development of substorm bulges 1959 substorm and also a measure of energy dissipation both in the
magnetotail and ionosphere (Yahnin et al., 2006). Hence one can expect that larger dissipated flux and also larger energy dissipation in the magnetotail must occur during substorms associated with Sheath and CIR than during substorms in the course of MC when the input energy and driving are largest. This result is in accordance with the conclusion of the recent paper by Palmroth et al. (2007). In this paper, the solar wind – magnetosphere coupling efficiency as response to the so-lar wind dynamic pressure impulses was investigated. It was shown, that the magnetosphere uses the energy of a weaker driver more efficiently, whereas during the stronger drivers the energy is more inefficiently used. However, the consid-eration of this effect is beyond the scope of the present paper and requires further investigations.
5 Conclusion
The auroral bulge “geometry” differs for substorms occur-ring duoccur-ring the solar wind recurrent streams and magnetic clouds. This is evidenced by difference in the ratio of auroral bulge longitudinal and latitudinal dimensions. In particular, during MC conditions the auroral bulge is confined in lati-tude and extended in longilati-tude. We relate this to storm-like configuration of the near-Earth magnetotail, which is very stretched in wide range of MLT.
Acknowledgements. Polar and WIND data used in this study were
taken from the official Internet sites of UVI, SWE, MFI (http:// cdaweb.gsfc.nasa.gov/cdaweb/istp public/; http://uvisun.msfc.nasa.
gov/UVI/brwseimages.html). We are grateful to G. Parks,
K. Ogilvie, and R. Lepping, the heads of the experiments conducted with these instruments. The work was supported by the Presidium of the Russian Academy of Sciences (RAS) through the basic re-search program “Solar activity and physical processes in the Sun-Earth system” and by the Division of Physical Sciences of RAS through the program ”Plasma processes in the solar system”. The study is part of a joint Russian-Bulgaria project “The influence of solar activity and solar wind streams on the magnetospheric distur-bances, particle precipitations and auroral emissions” of PGI RAS and STIL-BAS under the program for fundamental space research between RAS and BAS.
Topical Editor R. Nakamura thanks M. M. E. Palmroth and an-other anonymous referee for their help in evaluating this paper.
References
Akasofu, S.-I.: The development of the auroral substorm, Planet. Space Sci., 12, 273–282, 1964.
Balogh, A., Gosling, J. T., Jokipii, J. R., Kallenbach, R., and Kunow, H.: Corotating interaction regions. Proceedings. ISSI Workshop, Bern (Switzerland), 6–13 June 1998, Space Sci. Rev., 89(1–2), XIV + 411, 1999.
Burlaga, L. F., Klein, L., Sheeley Jr., N. R., Michels, D. J., Howard, R. A., Koomen, M. J., Schwenn, R., and Rosenbauer, H.: A
mag-netic cloud and a coronal mass ejection, Geophys. Res. Lett., 9, 1317–1320, 1982.
Despirak, I. V., Lubchich, A. A., Biernat, H. K., and Yahnin, A. G.: Poleward expansion of the westward electrojet depending on the solar wind and IMF parameters, Geomagnetism and Aeronomy, 48, 284–292, 2008.
Dmitrieva, N. P. and Sergeev, V. A.: The appearance of an auroral electrojet at polar cap latitudes: The characteristics of the phe-nomenon and the possibility of its use in predicting large-scale high-speed solar wind streams, Magnitosfernye Issledovaniia, 3, 58–66, 1984 (in Russian).
G´erard, J.-C., Hubert, B., Grard, A., Meurant, M., and Mende, S. B.: Solar wind control of auroral substorm onset locations observed with the IMAGE-FUV imagers, J. Geophys. Res., 109, A03208, doi:10.1029/2003JA010129, 2004.
Gonzalez, W. D., Gonzalez, A. L. C., and Tsurutani, B. T.: Dual-peek solar cycle distribution of intense geomagnetic storms, Planet. Space Sci., 38(2), 181–187, 1990.
Gussenhoven, M. S.: Extremely high latitude auroras, J. Geophys. Res., 87, 2401–2412, 1982.
Huttunen, K. E. J., Koskinen, H. E. J., Karinen, A., and Mursula, K.: Asymmetric development of magnetospheric storms during mag-netic clouds and sheath regions, Geophys. Res. Lett., 33, L06107, doi:10.1029/2005GL024894, 2006.
Krieger, A. S., Timothy, A. F., and Roelof, E. C.: A coronal hole and its identification as the source of a high velocity solar wind stream, Solar Phys., 29(2), 505–525, 1973.
McPherron, R. L.: Growth phase of magnetospheric substorms, J. Geophys. Res., 75, 5592–5599, 1970.
Miyashita, Y., Machida, S., Liou, K., Mukai, T., Saito, Y., Meng, C.-I., and Parks, G. K.: Relationship between magnetotail variations and auroral activities during substorms, J. Geophys. Res., 108, 1022, doi:10.1029/2001JA009175, 2003.
Palmroth, M., Partamies, N., Polvi, J., Pulkkinen, T. I., McComas, D. J., Barnes, R. J., Stauning, P., Smith, C. W., Singer, H. J., and Vainio, R.: Solar wind–magnetosphere coupling efficiency for solar wind pressure impulses, Geophys. Res. Lett., 34, L11101, doi:10.1029/2006GL029059, 2007.
Pudovkin, M. I.: Solar wind, Soros Educational Journal, 12, 87–94, 1996 (in Russian).
Pulkkinen, T. I., Ganushkina, N. Y., Tanskanen, E. I., Kubyshkina, M., Reeves, G. D., Thomsen, M. F., Russel, C. T., Singer, H. J., Slavin, J. A., and Gjerloev, J.: Magnetospheric current sys-tems during stormtime sawtooth events, J. Geophys. Res., 111, A11S17, doi:10.1029/2006JA011627, 2006.
Pulkkinen, T. I., Partamies, N., Huttunen, K. E. J., Reeves, G. D., and Koskinen, H. E. J.: Differences in geomagnetic storms driven by magnetic clouds and ICME sheath regions, Geophys. Res. Lett., 34, L02105, doi:10.1029/2006GL027775, 2007. Richardson, I. G., Cliver, E. W., and Cane, H. V.: Sources of
ge-omagnetic activity over the solar cycle: Relative importance of coronal mass ejections, high-speed streams, and slow solar wind, J. Geophys. Res., 105, 18203–18213, 2000.
Sergeev, V. A., Yakhnin, A. G., and Dmitrieva, N. P.: Substorm in the polar cap – the effect of high-velocity streams of the solar wind, Geomagnetism and Aeronomy, 19, 1121–1122. 1979 (in Russian).
1960 I. V. Despirak et al.: Development of substorm bulges
the loading-unloading substorm scheme, Geophys. Res. Lett., 32, LI7107, doi:10.1029/2005GL023779, 2005.
Tsurutani, B. T. and Gonzalez, W. D.: A new perspective on the relationship between substorms and magnetic storms, Adv. Geosci., V 8: Solar Terrestrial (2006), edited by: Ip, W.-H. and Duldig, M., published by World Scientific Co., Pte. Ltd., Singa-pore, p. 25–45, 2006.
Tsurutani, B. T., Gonzalez, W. D., Gonzalez, A. L. C., Guarnieri, F. L., Gopalswamy, N., Grande, M., Kamide, Y., Kasahara, Y., Lu, G., Mann, I., McPherron, R., Soraas, F., and Vasyli-unas, V.: Corotating solar wind streams and recurrent geo-magnetic activity: A review, J. Geophys. Res., 111, A07S01, doi:10.1029/2005JA011273, 2006.
Wang, Y.-M. and Sheeley Jr., N. R.: Global evolution of interplan-etary sector structure, coronal holes, and solar wind streams dur-ing 1976–1993: Stackplot displays based on solar magnetic ob-servations, J. Geophys. Res., 99, 6597–6608, 1994.
Weatherwax, A. T., Rosenberg, T. J., Maclennan, C. G., and Doolit-tle, J. H.: Substorm precipitation in the polar cap and associated Pc 5 modulation, Geophys. Res. Lett., 24, 579–582, 1997. Webb, D. F. and Howard, R. A.: The solar cycle variation of coronal
mass ejections and the solar wind mass flux, J. Geophys. Res., 99, 4201–4220, 1994.
Wilson, R. M.: Geomagnetic response to magnetic clouds, Planet. Space Sci., 35, 329–335, 1987.
Yahnin, A. G., Despirak, I. V., Lyubchich, A. A., and Kozelov, B. V.: Solar wind control of the auroral bulge expansion, Proceed-ings of the 7th International Conference on Substorms, 31–34, Helsinki, 2004.
Yahnin, A. G., Despirak, I. V., Lubchich, A. A., Kozelov, B. V., Dmitrieva, N. P., Shukhtina, M. A., and Biernat, H. K.: Relation-ship between substorm auroras and processes in the near-earth magnetotail, Space Sci. Rev., 122, 97–106, 2006.
Yermolaev, Yu. I., Yermolaev, M. Yu., Zastenker, G. N., Zelenyi, L. M., Petrukovich, A. A., and Sauvand, J.-A.: Statistical studies of geomagnetic storm dependencies on solar and interplanetary events: a review, Planet. Space Sci., 53, 189–196, 2005. Yermolaev, Yu. I. and Yermolaev, M. Yu.: Statistic study on the
ge-omagnetic storm effectiveness of solar and interplanetary events, Adv. Space Res., 37, 1175–1181, 2006.
Zverev, V. L., Starkov, G. V., and Feldstein, Y. I.: Influences of the interplanetary magnetic field on the auroral dynamics, Planet. Space Sci., 27, 665–667, 1979.