www.ann-geophys.net/28/1/2010/
© Author(s) 2010. This work is distributed under the Creative Commons Attribution 3.0 License.
Annales
Geophysicae
Temperature decrease in the extratropics of South America in
response to a tropical forcing during the austral winter
G. V. M ¨uller
Centro de Investigaciones Cient´ıficas y Transferencia de Tecnolog´ıa a la Producci´on, Diamante (CICYTTP-CONICET), Entre R´ıos, Argentina
Received: 9 June 2009 – Revised: 30 October 2009 – Accepted: 4 December 2009 – Published: 8 January 2010
Abstract. This paper focuses on the dynamic mechanisms
that create favorable conditions for the occurrence of frosts that affect large areas of Argentina and are denominated gen-eralized frosts (GF). The hemispheric teleconnection patterns linked to extreme cold events affecting central and northeast-ern Argentina during winter are identified. The objective is to determine whether the conditions found in previous studies for the composite of winters with extreme (maximum and minimum) frequency of GF occurrence respond to typical characteristics of the austral winter or they are inherent to those particular winters. Taking the mean winter as basic state in the 1961–1990 period, a series of numerical exper-iments are run using a primitive equation model in which waves are excited with a thermal forcing. The positions of the thermal forcing are chosen according to observed con-vection anomalies in a basic state given by the austral winters with extreme frequency of GF occurrence.
The wave trains excited by anomalous convection situated in specific regions may propagate across the Pacific Ocean and reach South America with the appropriate phase, creat-ing the local favorable conditions for the occurrence of GF. However, the anomalous convection is, by itself, not suffi-cient since the response also depends on the basic state con-figuration. This is proved by placing the forcing over the re-gion of significant anomalous convection for maximum and minimum frequency of GF occurrence and the response was very different in comparison to the mean winter. It is con-cluded that the conditions for a greater GF frequency of oc-currence are inherent to these particular winters, so that such conditions are not present in the average winter.
Keywords. Meteorology and atmospheric dynamics
(Cli-matology; General circulation; Middle atmosphere dynam-ics)
Correspondence to: G. V. M¨uller ([email protected])
1 Introduction
During the past decades there have been great advances in understanding the mechanisms associated to temperature de-crease in the extratropics of South America. Papers such as Krishnamurti et al. (1999), Marengo et al. (1997), Gar-reaud (2000), Vera et al. (2002), Pezza and Ambrizzi (2005), M¨uller and Berri (2007), among others, show the synoptic and dynamic characteristics of the cold outbreaks. The frosts which occur during these air irruptions can cause great dam-ages to the agriculture of the regions affected, with a high im-pact on regional and national economies, mainly when these irruptions are very intense and/or persistent and of great lat-itudinal penetration. Therefore, it is important the diagnosis and forecasting of such events as well as to determine the pre-cursory mechanisms through atmospheric teleconnections.
In relation to that, many papers have analyzed the linear response of a stratified atmosphere to a tropical thermal forc-ing, demonstrating the existence of a relationship between the warm anomalies in the tropics and circulation patterns in the extra-tropics. For example, Marengo et al. (2002) showed that quasi stationary Rossby waves coming from the western tropical Pacific during the austral winter, rep-resent an important mechanism in the tropical-extratropical interaction which affects weather and climate in southeast-ern South America (SSA). In particular, the results of M¨uller et al. (2008) suggest that stationary Rossby waves may be the main mechanism linking anomalous tropical convection in the western Pacific Ocean with the extreme cold events in Argentina during the austral winter. The association of tropical convection and a specific basic state can generate the appropriate environment to guide towards South Amer-ica the Rossby waves that have been triggered by the tropAmer-ical forcing. The basic state used for these experiments is a com-posite of the austral winters with maximum and minimum frequency of occurrence of generalized frosts (GF). These are composed, respectively, by the winters where the number of GF is one standard deviation unit above (+σ )and below
tive temperature anomalies over the whole Wet Pampa region (M¨uller et al., 2008). The simulated atmospheric circulation field favors a southerly anomalous wind component, which is the synoptic situation that causes frosts due to the cold and dry air advection. The result of the experiment in the −σ basic state with the heat source located at the same position as in the previous experiment, shows a different configura-tion. The surface temperature anomalies are negative to the northeast of the region and are positive over the remaining area. The low level circulation does not create a favorable condition for the occurrence of frosts because part of the Wet Pampa is dominated by a south-southeasterly wind compo-nent that brings maritime air into the region. The results suggest that stationary Rossby waves may be an important mechanism linking anomalous tropical convection with the extreme cold events in the Wet Pampa.
The numerical experiments in the +σ basic state (M¨uller et al., 2008) indicate that the extension of the anticyclonic region and the cold advection over SSA when the heat forc-ing is placed over the western Pacific Ocean, are similar to that observed by M¨uller et al. (2005) during the +σ winters. However, the amplitudes seem to be insufficient to generate the mass field and motion field anomalies observed by M¨uller et al. (2005) from a composite of GF selected within the +σ winters. Instead, when the heat forcing is placed over the western South Indian Ocean, the expected wave pattern ob-served during these events is achieved. The results obtained by M¨uller and Ambrizzi (2007) indicate the existence of a double train of Rossby waves which propagate along the sub-tropical and polar jets, respectively, whose phases coincide just before reaching South America. This pattern generates a strong polar air advection over the southern cone of the con-tinent with the consequent decrease in surface temperature accompanied by large areas with GF in the region. This in-teresting feature of these wave trains phase coincidence just before reaching South America, besides of being observed in the composite of winters with maximum frequency of GF occurrence (M¨uller et al., 2005), it was also observed in the composite of the most persistent GF events (higher than two consecutive days of GF, M¨uller and Berri, 2007). These au-thors grouped the GFs according to their persistence, which is defined as the number of consecutive days that follows the first day of the event and comply with the GF condition.
The question which arises from the analyses of the ex-treme winter composite with respect to the frequency of GF occurrence is whether the obtained features are inherent to
2 Data and methodology
The numerical simulations utilize the same model as in the previous study by M¨uller et al. (2008) and M¨uller and Am-brizzi (2007) for the +σ and −σ basic states. The Inter-mediate Global Circulation Model (IGCM) used in the nu-merical experiment was developed by Hoskins and Simmons (1975) and has been extensively used in teleconnection stud-ies (see Ambrizzi and Hoskins, 1997, and references there). The IGCM is spectrally truncated with a total zonal wave number T42, it has 12 vertical sigma levels, an also includes horizontal and vertical diffusion and Newtonian cooling. For the initial condition the NCEP-NCAR Reanalysis Project is used, available on a 2.5◦×2.5◦resolution grid, and provided by NOAA-CIRES. The input variables that the model uses are geopotential height, zonal and meridional wind and tem-perature.
The utilized thermal forcing has an elliptical horizontal structure and the vertical heating profile that follows a co-sine function with maximum amplitude at 400 hPa. The ex-periments consider the forcing given by a heat source in the Pacific Ocean which simulates the observed convection in the+σ and−σcomposites obtained by M¨uller et al. (2008). They are calculated as outgoing longwave radiation (OLR) anomalies with respect to the 1974–1996 mean value, pro-vided by NOAA-CIRES. Another experiment considers the forcing located in the Indian Ocean, following M¨uller and Ambrizzi (2007), which simulates the Rossby wave patterns previously observed in +σcomposite by M¨uller et al. (2005). Theory shows that the response to the tropical heating is baroclinic in the vicinity of the forcing and barotropic far from the source (Ambrizzi and Hoskins, 1997). This can be seen through vertical cross-section analysis for a given lati-tude. The numerical results obtained by M¨uller and Ambrizzi (2007) and M¨uller et al. (2008), indicated that the response of the heating source placed in the different latitudes and lon-gitudes shows an equivalent barotropic Rossby wave for the +σ and−σ basic states and there was no baroclinic insta-bility development during the days integration period. The results of the experiments are shown on the day the solution acquires quasi stationary pattern. In the experiments on the Pacific Ocean it takes 10 days and for the Indian Ocean ex-periment it takes 14 days.
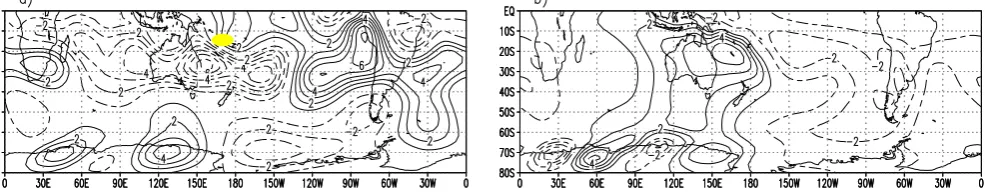
Figure 1
: Stream function anomalies (1x10
-6m
2s
-1) at 250 hPa (a) and 850 hPa (b), on day 10 of
integration, corresponding to the mean winter state basic experiment with a forcing at 170ºE-15ºS (see
gray dot in the figure)
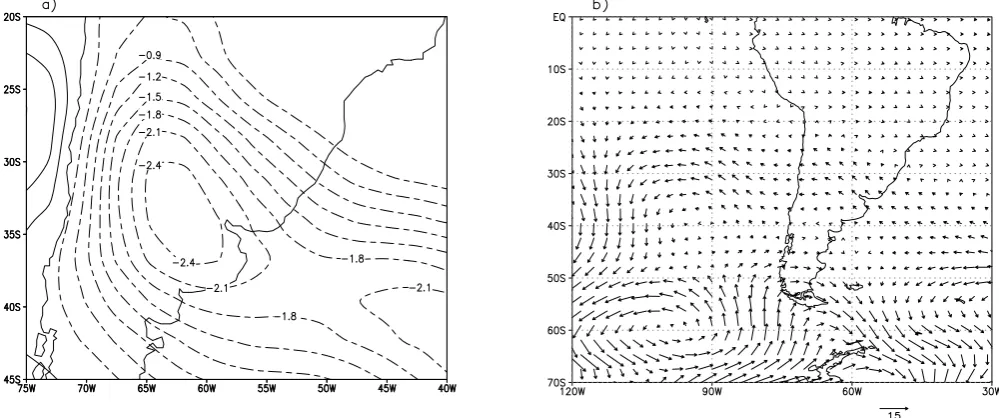
Fig. 1. Stream function anomalies (1×10⁻⁶m2s−1)at 250 hPa (a) and 850 hPa (b), on day 10 of integration, corresponding to the mean winter state basic experiment with a forcing at 170◦E–15◦S (see dot in the figure).
3 Results
This section presents the results obtained in the different nu-merical simulations in the mean winter basic state and are compared to those obtained by the simulations using the +σ and−σ basic states. With respect to these basic states, it is necessary to mention that the +σ and−σ experiments were previously analyzed for the forcing in the Indian Ocean by M¨uller and Ambrizzi (2007), and for the forcing in the Pa-cific Ocean by M¨uller et al. (2008). However, the discussion in the latter was focused mainly on +σ basic state, reason why in this paper the results for the simulations in−σbasic state are presented as a complement to the mean winter basic state.
3.1 Experiment with Pacific Ocean forcing
The OLR anomaly field for the +σ winters composite ob-tained by M¨uller et al. (2008) shows two main regions of anomalous tropical convection in the Southern Hemisphere, with significant values, which are situated in the Indian and western Pacific Oceans, respectively. On the other hand, in the −σ winters composite there are regions with negative OLR anomalies in the Southern Pacific Ocean and the main one is located at 120◦E–15◦S (M¨uller et al., 2008). This
section presents the experiments in the mean winter basic state with the same forcing observed in the Pacific Ocean in the +σ and−σ composites. These forcing corresponds to the anomalous convection observed at 170◦E–15◦S in the +σ winters and at 120◦E–15◦S in the−σ winters. Follow-ing M¨uller et al. (2008) the anomaly patterns to be shown from the numerical results are obtained from the difference between the day 10 of integration and day 0, which represent the basic state before the heating forcing is initiated.
3.1.1 Experiment with forcing in 170◦E–15◦S
Figure 1a shows the anomalies of the stream function aloft with large amplitude in the western part hemisphere and a phase opposition between the tropics and subtropics in the South Pacific Ocean. To the extreme south-southwest of the continent, an anticyclonic anomaly is located approximately
Figure 2
: Surface temperature anomalies (ºC) on day 10 of integration corresponding to the mean
winter basic state experiment with the forcing at 170ºE-15ºS
Fig. 2. Surface temperature anomalies (◦C) on day 10 of integration corresponding to the mean winter basic state experiment with the forcing at 170◦E–15◦S.
at 90◦W. This same anomaly is observed in the 850 hPa field (Fig. 1b) which extends its influence over the entire southern cone. Consequently, negative surface temperature lies are observed over eastern Argentina and positive anoma-lies to the west (Fig. 2). The circulation generated by this configuration is clear in the 850 hPa wind anomalies pattern (Fig. 3b). The region with southerly advection is circum-scribed to eastern Argentina. In this figure is appreciated that the response to the tropical heating is baroclinic in the vicin-ity of the forcing and barotropic far from the source, with was previously mentioned (Sect. 2). In the left panel (Fig. 3a) a positive meridional wind anomaly is observed at 250 hPa covering the same area of the country. It is part of a wave train that propagates from the source region in the western Pacific Ocean towards the South Atlantic Ocean, with an-other wave train identified at subtropical latitudes. They to-gether form a double wave train that propagates across the Pacific Ocean, in agreement with the results found by other authors for the Southern Hemisphere winter (e.g. Ambrizzi
Figure 3
: Meridional wind component anomalies (ms
-1) at 250 hPa (a) and wind vector anomaly at 850
hPa (b), on day 10 of integration, corresponding to the mean winter basic state experiment with the
forcing at 170ºE-15ºS (see gray dot in the figure)
Fig. 3. Meridional wind component anomalies (ms−1)at 250 hPa (a) and wind vector anomaly at 850 hPa (b), on day 10 of integration, corresponding to the mean winter basic state experiment with the forcing at 170◦E–15◦S (see dot in the figure).
Figure 4
: Stream function anomalies (1x10
-6m
2s
-1) at 250 hPa (a) and 850 hPa (b), on day 10 of
integration, corresponding to -σ basic state experiment with the forcing at 170ºE-15ºS (see gray dot in
the figure)
Fig. 4. Stream function anomalies (1×10⁻⁶m2s−1)at 250 hPa (a) and 850 hPa (b), on day 10 of integration, corresponding to−σ basic state experiment with the forcing at 170◦E–15◦S (see dot in the figure).
et al., 1995), which demonstrate that the jets act as wave guides. This pattern aloft does not resemble the one simu-lated for the basic state +σ, nor does with the low level cir-culation (see Fig. 2 from M¨uller et al., 2008). The difference is given by the origin of the anomalous wind over the region of interest. Although the meridional wind anomalies for both experiments (+σand mean winter) are from the south, in the one observed for the mean winter basic state the polar air crosses an extended maritime region before reaching the Wet Pampa (Fig. 3), while in the +σexperiment the flow is mainly continental and therefore drier (see Fig. 2 from M¨uller et al., 2008).
It is interesting to compare the simulation of the mean win-ter basic state with that of the equivalent experiment in−σ. The movement field aloft of the simulation in the mean win-ter basic state shows a similar configuration to the equivalent experiment in−σ(see Fig. 4a and Fig. 1a). This similarity is also observed at low levels particularly in the southernmost part of the continent, where an anticyclonic anomaly is ob-served over Patagonia. However, the relative position of this anomaly differs in both experiments; in the mean winter ba-sic state it is localized west of the continent (Fig. 1b) while is over the continent in−σ basic state (Fig. 4b). This anomaly creates a circulation with a southeast component and advec-tion of maritime air, and therefore, a more humid situaadvec-tion over the Wet Pampa region. They are not the most favorable conditions for the occurrence of frost. However, the northern
region of the Wet Pampa will have favorable conditions for the formation of radiative frosts, given that another anticy-clonic anomaly is located in the central-northeastern region of Argentina (Fig. 4b). The proportion of the Wet Pampa covered by this effect is not enough to create a generalized frost, and are reduced to partial or isolated frosts (M¨uller, 2007).
3.1.2 Experiment with forcing in 120◦E–15◦S
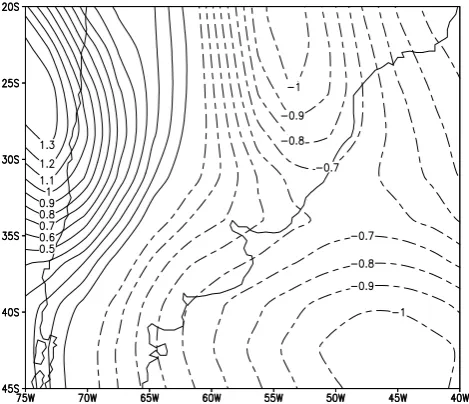
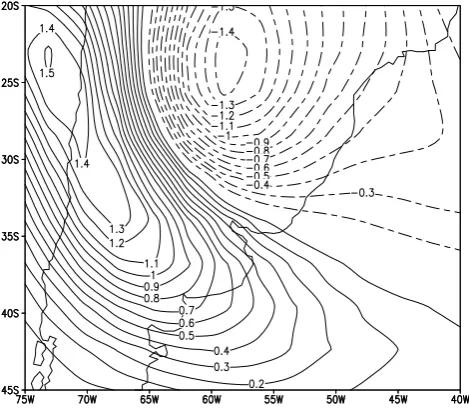
In this experiment, in the mean winter basic state, the mass field shown in Fig. 5a–b presents a negative stream function anomaly which extends over most of South America, in par-ticular at the 850 hPa level (Fig. 5b). It is interesting to com-pare with the configuration obtained with the−σ basic state of the same experiment (Fig. 6a–b). At first sight, both con-figurations are similar (Figs. 5 and 6), but taking a closer look at South America, interesting differences can be found. Figure 6a, which corresponds to 250 hPa, highlights a pat-tern clearly defined by the stream function anomalies in the Pacific Ocean along 30◦S. However, upon reaching South America, the anomalies project northeastwards, while to the south and over the continent, they are practically inexistent. At high latitudes, in the same figure, a large area is dominated by negative anomalies. Centered at 120◦W, this area extends throughout the troposphere (Fig. 6b) in coincidence with the persistent negative anomaly at 120◦W and 60◦S observed
[image:4.595.55.548.235.332.2]Figure 5
: Stream function anomalies (1x10
-6m
2s
-1) at 250 hPa (a) and 850 hPa (b), on day 10 of
integration, corresponding to the mean winter basic state experiment with the forcing at 120ºE-15ºS
(see gray dot in the figure)
[image:5.595.53.548.67.166.2]
Fig. 5. Stream function anomalies (1×10⁻⁶m2s−1)at 250 hPa (a) and 850 hPa (b), on day 10 of integration, corresponding to the mean winter basic state experiment with the forcing at 120◦E–15◦S (see dot in the figure).
Figure 6
: Stream function anomalies (1x10⁻⁶ m
2s
-1) at 250 hPa (a) and 850 hPa (b), on day 10 of
integration, corresponding to -σ basic state experiment with the forcing at 120ºE-15ºS (see gray dot in
the figure)
[image:5.595.50.550.218.317.2]
Fig. 6. Stream function anomalies (1×10⁻⁶m2s−1)at 250 hPa (a) and 850 hPa (b), on day 10 of integration, corresponding to−σ basic state experiment with the forcing at 120◦E–15◦S (see dot in the figure).
Figure 7
: Surface temperature anomalies (ºC) on day 10 of integrations, corresponding to -
σ
basic
estate experiment with the forcing at 120ºE-15ºS
Fig. 7. Surface temperature anomalies (◦C) on day 10 of integra-tions, corresponding to−σbasic estate experiment with the forcing at 120◦E–15◦S.
by other authors during the austral winter, e.g. Mo and Hig-gins (1998).
Over the continent and at low levels (850 hPa), a negative anomaly affects the northeast of the Wet Pampa, as can be seen in Fig. 6b. This is linked to the negative surface temper-ature anomalies over northeastern Argentina (Fig. 7). In this
Figure 8
: Surface temperature anomalies (ºC) on day 10 of integration, corresponding to the
mean winter basic state experiment with the forcing at 120ºE-15ºS
Fig. 8. Surface temperature anomalies (◦C) on day 10 of integra-tion, corresponding to the mean winter basic state experiment with the forcing at 120◦E–15◦S.
simulation of the −σ basic state, the temperature decrease in the northeast of the Wet Pampa would eventually cause frosts. However, given their spatial extension, they cannot be considered generalized frosts, but rather partial or iso-lated frosts as studied by M¨uller (2007). This is in contrary to what it is observed in Fig. 8 for the mean winter basic
[image:5.595.49.284.374.580.2] [image:5.595.308.543.374.579.2]Figure 9
: Meridional wind component anomalies (ms
-1) at 250 hPa (a) and wind vector anomaly at 850
hPa (b), on day 10 of integration, corresponding to the mean winter basic state experiment with the
forcing at 120ºE-15ºS (see gray dot in the figure)
Fig. 9. Meridional wind component anomalies (ms−1)at 250 hPa (a) and wind vector anomaly at 850 hPa (b), on day 10 of integration, corresponding to the mean winter basic state experiment with the forcing at 120◦E–15◦S (see dot in the figure).
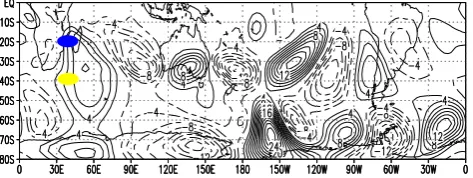
Figure 10
: Meridional wind component anomalies (ms
-1) at 250 hPa on day 14 of integration,
corresponding to the mean winter basic state experiment with the forcing at 40ºE-20ºS and 45ºE-40ºS
(see gray dots in the figure)
Fig. 10. Meridional wind component anomalies (ms−1)at 250 hPa on day 14 of integration, corresponding to the mean winter basic state experiment with the forcing at 40◦E–20◦S and 45◦E–40◦S (see dots in the figure).
state, with negative temperature anomalies over most of Wet Pampa. These anomalous temperature values are explained by the west-southwesterly advection (Fig. 9b), which mainly affects Atlantic Ocean coast of Argentina. In Fig. 9b is ap-preciated that the response to the tropical heating is baro-clinic in the vicinity of the forcing and barotropic far from the source, such as in the Fig. 3b. The left panel in Fig. 9 shows the meridional wind anomalies with a wave train that propagates following the subtropical jet until the eastern Pa-cific Ocean, continuing then its trajectory towards the south of South America. This pattern for the mean winter is sim-ilar to the one shown in M¨uller et al. (2008, Fig. 9a) for the same experiment in the −σ basic state, except that in the mean winter experiment a positive meridional wind anomaly covers the south of South America (Fig. 9a).
It is worth mentioning that the OLR anomaly field for the +σ winters composite shows in 120◦E–15◦S a region where convection is inhibited (see Fig. 1a, M¨uller et al., 2008). Hence, the equivalent experiment in the +σbasic state lacks physical meaning since it will not create a perturbation in the forcing position.
3.2 Experiment with Indian Ocean forcing
The numeric experiment for the mean winter basic state, with the forcing in the same position as in M¨uller and Ambrizzi
(2007), is presented. The first forcing coincides with one of the South American teleconnection points (40◦E–20◦S), i.e. the region immediately upstream of the subtropical jet stream principal maximum over the tropical Indian Ocean. It must be pointed out that, since the forcing is located in the tropical region, it would be simulating a heat source due to deep convection. Instead, the second forcing located in mid latitudes (45◦E–40◦S), it is simply used in order to create a perturbation of the basic state, known as a wave maker. This forcing should not be considered as isolated sources at mid latitudes but rather as a thermal gradient, in other words the purpose of the forcing is to increase the thermal gradient. Following M¨uller and Abrizzi (2007) the anomaly patterns to be shown from the numerical results are obtained from the difference between the day 14 of integration and day 0, which represent the basic state before the heating forcing is initiated.
The results in Fig. 10 show a double wave train which propagates independently along the subtropical and polar jet streams with no phase coincidence. Waves propagating at high latitudes follow a purely zonal trajectory and further south than the analysis of M¨uller and Ambrizzi (2007) for the +σ and−σ basic states. However, the one corresponding to subtropical latitudes curves its trajectory approximately over the central Pacific Ocean, entering South America at mid lat-itudes and continuing in the northeast direction.
The configuration found in the mean winter simulation is similar to the one obtained for the composite of observed events with 1 day persistence of GF, or less persistent GF events (see Fig. 4 from M¨uller and Berri, 2007). The main difference is the value of the anomalies which in the observed composite is twice than those simulated, as well as the lati-tude of propagation. The observed wave train enters the con-tinent in southwestern South America, while in the simulated case it does further north (Fig.10). This indicates that, al-though the result of the experiment coincides in the typical arc shaped trajectory that enters the South American conti-nent causing the widely discussed cold outbreaks, it does not seem to be sufficient to cause the GF. According to the obser-vations, the GF generated under similar conditions to those
[image:6.595.45.549.72.179.2] [image:6.595.50.287.241.330.2]Figure 11
: Surface temperature anomalies (ºC) (a) and wind vector anomaly (ms
-1) at 850 hPa (b), on
day 14 of integration, corresponding to the mean winter basic state experiment with the forcing at
40ºE-20ºS and 45ºE-40ºS
Fig. 11. Surface temperature anomalies (◦C) (a) and wind vector anomaly (ms−1)at 850 hPa (b), on day 14 of integration, corresponding to the mean winter basic state experiment with the forcing at 40◦E–20◦S and 45◦E–40◦S.
simulated – at least with respect to the propagation pattern –, need to acquire an amplitude and intensity such that, besides entering through the southwest of the continent, would be able to guarantee the duration of the system. The mentioned large scale features will facilitate a continuous southerly ad-vection, inducing extended advective frosts.
On the other hand, it is interesting to point out that the characteristics of the propagation trajectories in the mean winter (Fig. 10) are opposed to those obtained in the +σ ex-periment of M¨uller and Ambrizzi (2007). In that case, the purely zonal trajectory corresponds to the subtropical lati-tude wave train, while the waves which propagate in po-lar latitudes (see Fig. 5a from M¨uller and Ambrizzi, 2007) acquire a certain meridional component near the continent. In the present simulation the surface temperature anomalies are negative (Fig. 11a), as well as in the +σ and−σ ba-sic states (see Figs. 7 and 9a from M¨uller and Ambrizzi, 2007), although the anomalous wind circulation at 850hPa over the Wet Pampa region is mainly from the eastern sector (Fig. 11b). Therefore, the temperature decrease would not trigger frosts because the advection is mainly of moist air.
4 Discussion and conclusions
This paper investigates the role that tropical anomalous con-vection over the western Pacific Ocean and South Indian Ocean plays in the generation of extratropical wave patterns that cause a temperature decrease in the Wet Pampa, during the winters of the period 1961–1990. A baroclinic global cir-culation model is employed to study the response to an exci-tation caused by the presence of heat sources in the regions
where OLR anomalies are observed in the composites of the winters with maximum and minimum frequency of GF oc-currence (+σ and−σ respectively). It is assumed that such events are not caused by local conditions but they are the response to larger scale processes. It is also analyzed the an-swer to a forcing which generates a propagation pattern in agreement with the observed patterns in the composite of the most conspicuous (most frequent and more persistent) GF events. The wave patterns and the atmospheric circulation fields resulting from these simulations in the mean winter ba-sic state are compared to other baba-sic states which represent winters with the extreme frequency of GF occurrence, i.e., +σ and−σ.
When the forcing is in the Pacific Ocean, in particular at 170◦E–15◦S (which corresponds to the observed anomalous convection in the +σ basic state), the experiment in the mean winter basic state shows a Rossby wave propagation pattern different to those of the +σ and−σ basic states. The exper-iment in the +σ basic state presents a Rossby wave pattern with an arc shaped trajectory that initially moves polewards and later deflects towards the equator (M¨uller et al., 2008). This wave train reaches South America in its central part and creates a southerly wind anomaly in the southern part of the continent. Instead, the propagation pattern of the−σ basic state experiment does not agree with the preferential paths that waves follow in the Southern Hemisphere during the austral winter (M¨uller et al., 2008). This is due to the fact that two wave trains are observed which split at the re-gion of origin; the northern one reaches the South American continent at equatorial latitudes, while the other one moves towards the South Atlantic. In the mean winter basic state two wave trains are observed, but they propagate along the
of GF that distinguish them from the averaged winters. It is important to point out that this result refers to a particu-lar forcing position which can be associated with the “warm Pacific Ocean pool”, a region of frequent convective activity. The second experiment in the−σbasic state with the forc-ing 120◦E–15◦S, that corresponds to the observed anoma-lous convection in the same basic state, shows surface tem-perature anomalies that are negative to the north of the Wet Pampa and positive in its central and southern region. The low level circulation is typical of radiative frosts, but without being generalized since the anticyclonic anomaly is circum-scribed to a smaller area inside the Wet Pampa. The motion field aloft shows a wave train that follows the subtropical jet. This result is also in agreement with the Rossby wave agation theory since, in particular for short waves, the prop-agation path follows a latitudinal circle at subtropical lati-tudes. A weakening of the wind anomalies is observed when the wave train reaches South America. At this position, but at low levels, there is a northern wind anomaly that interferes with the cold air advection from the south, windward of the Andes Mountains. These wind fields are shown in M¨uller et al. (2008, Fig. 9). On the other hand, the result of the ex-periment with the same forcing but in the mean winter basic state presents a wave train similar to that of the−σ basic state, except that it reaches the continent at mid to high lat-itudes, with a southerly meridional wind anomaly. At low levels the air advection from the southwest, and the conse-quent negative temperature anomalies, seem to affect mainly the eastern sector of the study area.
The predominant Rossby wave trains of the experiments with the forcing in the Indian Ocean for the analyzed basic states show propagation at both polar and subtropical lati-tudes. The patterns found are not in phase when they reach South America, neither in the mean winter nor in the −σ simulation, as observed in the +σ simulated by M¨uller and Ambrizzi (2007). Moreover, divergence is observed between the propagation trajectories of the −σ wave trains (M¨uller and Ambrizzi, 2007), as well as complete autonomy between them in the mean winter simulation. In the case of the mean winter basic state the propagation in polar latitudes is zonal. At subtropical latitudes the propagation is zonal up to the dateline where it curves southward entering the continent at mid latitudes and continuing later to the northeast.
The differences between the +σ,−σ and mean winter ba-sic states for the Indian Ocean experiment (+σ and−σ ob-tained by M¨uller and Ambrizzi, 2007), are observed not only
perature decrease can lead to frosts in the Wet Pampa, since the low level circulation is mainly from the south-southwest, while the−σ and mean winter basic states are dominated by wind anomalies from the eastern sector. In the first case, the Wet Pampa region will have favorable conditions for advec-tive frosts because of the arrival of cold and dry air over the region. In the other two basic states the Wet Pampa region is under the influence of moist air advection which does not propitiate the occurrence of frosts.
Based on the comparative analysis between the +σ, −σ and mean winter basic states, it is concluded that the features revealed by the extreme +σ and−σ winters are characteris-tic of those parcharacteris-ticular winters and do not represent the mean winter conditions. This answers the question whether the ob-tained features are inherent to the extreme winters compos-ite with respect to the frequency of GF occurrence or they are found in the average winter, which motivated this work. Hence, the previously obtained results for +σ (M¨uller et al., 2008), besides reproducing the patterns observed by M¨uller et al. (2005), explain the dynamic mechanism which leads to the most frequent GF (M¨uller et al., 2005) and the most per-sistent GF that M¨uller and Berri (2007) define as GF that last more than three consecutive days. This conclusion is impor-tant for the short and mid term forecast of GF, since knowing the conditions of the basic state and the dominating forcing during winter it would be possible to determine the frequency and/or persistence of the GF that could affect the Wet Pampa. Acknowledgements. This work had partial support from CONICET
(PIP-114-200801-00591). The author is grateful to the reviewers for their useful suggestions that contributed to improve the quality of this work.
Topical Editor F. D’Andrea thanks A. Pezza and another anony-mous referee for their help in evaluating this paper.
References
Ambrizzi, T., Hoskins, B. J., and Hsu, H. H.: Rossby wave propaga-tion and teleconnecpropaga-tion patterns in the austral winter, J. Atmos. Sci., 52, 3661–3672, 1995.
Ambrizzi, T. and Hoskins, B. J.: Stationary Rossby-wave propaga-tion in a baroclinic atmosphere, Q. J. Meteorol. Soc., 123, 919– 928, 1997.
Garreaud, R. D.: Cold air incursions over subtropical South Amer-ica: Mean Structure and Dynamics, Mon. Weather Rev., 128, 2544–2559, 2000.
Hoskins, B. J. and Simmons, A. J.: A multi-layer spectral model and the semi-implicit method, Q. J. Roy. Meteorol. Soc., 101, 637–655, 1975.
Krishnamurti, T. N., Tewari, M., Chakraborty, D., Marengo, J. A., Silva Dias, P. L., and Satyamurti, P.: Downstream amplification: A possible precursor to major freeze events over south-eastern Brazil, Weather and Forecasting, 14, 242–270, 1999.
Marengo, J. A., Cornejo, A., Satyamurty, P., Nobre, C., and Sea, W.: Cold surges in tropical and extratropical South America: The strong event in June 1994, Mon. Weather Rev., 125, 2759–2786, 1997.
Marengo, J. A., Ambrizzi, T., Kiladis, G., and Liebmann, B.: Upper-air wave trains over the Pacific Ocean and wintertime cold surges in tropical-subtropical South America leading to Freezes in Southern and Southeastern Brazil, Theor. Appl. Climatol., 74, 243–247, 2002.
Mo, K. C. and Higgins, R. W.: The Pacific-South American modes and tropical convection during the Southern Hemisphere Winter, Mon. Weather Rev., 126, 1581–1596, 1998.
M¨uller, G. V., N´u˜nez, M. N., and Seluchi, M. E.: Relationship be-tween ENSO cycles and frost events within the Pampa Humeda region, Int. J. Climatol., 20, 1619–1637, 2000.
M¨uller, G. V., Ambrizzi, T., and N´u˜nez, M. N.: Mean atmo-spheric circulation leading to generalized frosts in Central South-ern South America, Theor. Appl. Climatol., 82, 95–112, 2005. M¨uller, G. V.: Patterns Leading to Extreme Events in Argentina:
Partial and Generalized Frosts, Int. J. Climatol., 27(10), 1373– 1387, 2007.
M¨uller, G. V. and Ambrizzi, T.: Teleconnection Patterns and Rossby Wave Propagation Associated to Generalized Frosts over Southern South America, Clim. Dynam., 29, 633–645, doi:10.1007/s00382-007-0253-x, 2007.
M¨uller, G. V. and Berri, G. J.: Atmospheric Circulation Associated with Persistent Generalized Frosts in Central-Southern South America, Mon. Weather Rev., 135(4), 1268–1289, 2007. M¨uller, G. V., Ambrizzi, T., and Ferraz, S. E.: The role of the
ob-served tropical convection in the generation of frost events in the southern cone of South America, Ann. Geophys., 26, 1379– 1390, 2008,
http://www.ann-geophys.net/26/1379/2008/.
Pezza, A. B. and Ambrizzi, T.: Dynamical Conditions and Synop-tic Tracks Associated with Different Types of Cold Surges over Tropical South America, Int. J. Climatol., 25, 215–241, 2005. Vera, C. S., Vigliarolo, P. K., and Berbery, E. H.: Cold Season
Waves over Subtropical South America, Mon. Weather Rev., 130, 684–699, 2002.