InTrans Project Reports Institute for Transportation
1-2014
Field Monitoring of Curved Girder Bridges with
Integral Abutments
Lowell Greimann
Institute for Transportation, greimann@iastate.edu Brent M. Phares
Iowa State University, bphares@iastate.edu Yaohua Jimmy Deng
Iowa State University, jimdeng@iastate.edu Gus Shryack
Iowa State University, guss@iastate.edu Jerad Hoffman
Follow this and additional works at:http://lib.dr.iastate.edu/intrans_reports Part of theCivil Engineering Commons
This Report is brought to you for free and open access by the Institute for Transportation at Iowa State University Digital Repository. It has been accepted for inclusion in InTrans Project Reports by an authorized administrator of Iowa State University Digital Repository. For more information, please contactdigirep@iastate.edu.
Recommended Citation
Greimann, Lowell; Phares, Brent M.; Deng, Yaohua Jimmy; Shryack, Gus; and Hoffman, Jerad, "Field Monitoring of Curved Girder Bridges with Integral Abutments" (2014).InTrans Project Reports. 33.
Field Monitoring of Curved Girder Bridges with Integral Abutments
Abstract
Nationally, there are questions regarding the design, fabrication, and erection of horizontally curved steel girder bridges due to unpredicted girder displacements, fit-up, and locked-in stresses. One reason for the concerns is that up to one-quarter of steel girder bridges are being designed with horizontal curvature. There is also an urgent need to reduce bridge maintenance costs by eliminating or reducing deck joints, which can be achieved by expanding the use of integral abutments to include curved girder bridges. However, the behavior of horizontally curved bridges with integral abutments during thermal loading is not well known nor
understood. The purpose of this study was to investigate the behavior of horizontal curved bridges with integral abutment (IAB) and semi-integral abutment bridges (SIAB) with a specific interest in the response to changing temperatures. The long-term objective of this effort is to establish guidelines for the use of integral abutments with curved girder bridges. The primary objective of this work was to monitor and evaluate the behavior of six in-service, horizontally curved, steel-girder bridges with integral and semi-integral abutments. In addition, the influence of bridge curvature, skew and pier bearing (expansion and fixed) were also part of the study. Two monitoring systems were designed and applied to a set of four horizontally curved bridges and two straight bridges at the northeast corner of Des Moines, Iowa—one system for measuring strains and movement under long term thermal changes and one system for measuring the behavior under short term, controlled live loading. A finite element model was developed and validated against the measured strains. The model was then used to investigate the sensitivity of design calculations to curvature, skew and pier joint conditions. The general conclusions were as follows: (1) There were no measurable differences in the behavior of the horizontally curved bridges and straight bridges studied in this work under thermal effects. For
preliminary member sizing of curved bridges, thermal stresses and movements in a straight bridge of the same length are a reasonable first approximation. (2) Thermal strains in integral abutment and semi-integral abutment bridges were not noticeably different. The choice between IAB and SIAB should be based on life – cycle costs (e.g., construction and maintenance). (3) An expansion bearing pier reduces the thermal stresses in the girders of the straight bridge but does not appear to reduce the stresses in the girders of the curved bridge. (4) An analysis of the bridges predicted a substantial total stress (sum of the vertical bending stress, the lateral bending stress, and the axial stress) up to 3 ksi due to temperature effects. (5) For the one curved integral abutment bridge studied at length, the stresses in the girders significantly vary with changes in skew and curvature. With a 10⁰ skew and 0.06 radians arc span length to radius ratio, the curved and skew integral abutment bridges can be designed as a straight bridge if an error in estimation of the stresses of 10% is acceptable.
Keywords
Bridge abutments, Curved bridges, Field studies, Finite element method, Girder bridges, Jointless bridges, Live loads, Thermal analysis, Thermal stresses, Des Moines (Iowa), bridge thermal stresses, expansion pier bearings, fixed pier bearings, horizontally curved bridges, integral abutments, —semi-integral abutments, steel-girder bridges
Disciplines
Comments
See also 2-page Techn Transfer Summary "Field Monitoring of Curved Girder Bridges with Integral Abutments" for overview of the report.
Field Monitoring of
Curved Girder Bridges with
Integral Abutments
Final Report
January 2014
Sponsored through
Federal Highway Administration (TPF-5(169)) and
About the BEC
The mission of the Bridge Engineering Center is to conduct research on bridge technologies to help bridge designers/owners design, build, and maintain long-lasting bridges.
Disclaimer Notice
The contents of this report reflect the views of the authors, who are responsible for the facts and the accuracy of the information presented herein. The opinions, findings and conclusions expressed in this publication are those of the authors and not necessarily those of the sponsors.
The sponsors assume no liability for the contents or use of the information contained in this document. This report does not constitute a standard, specification, or regulation.
The sponsors do not endorse products or manufacturers. Trademarks or manufacturers’ names appear in this report only because they are considered essential to the objective of the document.
Non-Discrimination Statement
Iowa State University does not discriminate on the basis of race, color, age, religion, national origin, sexual orientation, gender identity, genetic information, sex, marital status, disability, or status as a U.S. veteran. Inquiries can be directed to the Director of Equal Opportunity and Compliance, 3280 Beardshear Hall, (515) 294-7612.
Iowa Department of Transportation Statements
Federal and state laws prohibit employment and/or public accommodation discrimination on the basis of age, color, creed, disability, gender identity, national origin, pregnancy, race, religion, sex, sexual orientation or veteran’s status. If you believe you have been discriminated against, please contact the Iowa Civil Rights Commission at 800-457-4416 or Iowa Department of Transportation’s affirmative action officer. If you need accommodations because of a disability to access the Iowa Department of Transportation’s services, contact the agency’s affirmative action officer at 800-262-0003.
The preparation of this report was financed in part through funds provided by the Iowa Department of Transportation through its “Second Revised Agreement for the Management of Research Conducted by Iowa State University for the Iowa Department of Transportation” and its amendments.
Technical Report Documentation Page
1. Report No. 2. Government Accession No. 3. Recipient’s Catalog No.
InTrans Project 08-323
4. Title and Subtitle 5. Report Date
Field Monitoring of Curved Girder Bridges with Integral Abutments January 2014
6. Performing Organization Code
7. Author(s) 8. Performing Organization Report No.
Lowell Greimann, Brent M. Phares, Yaohua Deng, Gus Shryack, and Jerad Hoffman InTrans Project 08-323
9. Performing Organization Name and Address 10. Work Unit No. (TRAIS)
Bridge Engineering Center Iowa State University
2711 South Loop Drive, Suite 4700 Ames, IA 50010-8664
11. Contract or Grant No.
12. Sponsoring Organization Name and Address 13. Type of Report and Period Covered
Federal Highway Administration, U.S. Department of Transportation, 1200 New Jersey Avenue SE, Washington, DC 20590
TPF partners: Ohio DOT, Pennsylvania DOT, Wisconsin DOT, and Iowa DOT (lead state), 800 Lincoln Way, Ames, IA 50010
Final Report
14. Sponsoring Agency Code TPF-5(169)
15. Supplementary Notes
Visit www.intrans.iastate.edu for color pdfs of this and other research reports. 16. Abstract
Nationally, there are questions regarding the design, fabrication, and erection of horizontally curved steel girder bridges due to unpredicted girder displacements, fit-up, and locked-in stresses. One reason for the concerns is that up to one-quarter of steel girder bridges are being designed with horizontal curvature. There is also an urgent need to reduce bridge maintenance costs by eliminating or reducing deck joints, which can be achieved by expanding the use of integral abutments to include curved girder bridges. However, the behavior of horizontally curved bridges with integral abutments during thermal loading is not well known nor understood. The purpose of this study was to investigate the behavior of horizontal curved bridges with integral abutment and semi-integral abutment bridges with a specific interest in the response to changing temperatures.
The long-term objective of this effort is to establish guidelines for the use of integral abutments with curved girder bridges. The primary objective of this work was to monitor and evaluate the behavior of six in-service, horizontally curved, steel-girder bridges with integral and semi-integral abutments. In addition, the influence of bridge curvature, skew and pier bearing (expansion and fixed) were also part of the study.
Two monitoring systems were designed and applied to a set of four horizontally curved bridges and two straight bridges at the northeast corner of Des Moines, Iowa—one system for measuring strains and movement under long term thermal changes and one system for measuring the behavior under short term, controlled live loading. A finite element model was developed and validated against the measured strains. The model was then used to investigate the sensitivity of design calculations to curvature, skew and pier joint conditions. The general conclusions were as follows:
There were no measureable differences in the behavior of the horizontally curved bridges and straight bridges studied in this work under thermal effects. For preliminary member sizing of curved bridges, thermal stresses and movements in a straight bridge of the same length are a reasonable first approximation.
Thermal strains in integral abutment and semi-integral abutment bridges were not noticeably different. The choice between IAB and SIAB should be based on life – cycle costs (e.g., construction and maintenance).
An expansion bearing pier reduces the thermal stresses in the girders of the straight bridge but does not appear to reduce the stresses in the girders of the curved bridge
An analysis of the bridges predicted a substantial total stress (sum of the vertical bending stress, the lateral bending stress, and the axial stress) up to 3 ksi due to temperature effects.
For the one curved integral abutment bridge studied at length, the stresses in the girders significantly vary with changes in skew and curvature. With a 10⁰ skew and 0.06 radians arc span length to radius ratio, the curved and skew integral abutment bridges can be designed as a straight bridge if an error in estimation of the stresses of 10% is acceptable.
17. Key Words 18. Distribution Statement
bridge thermal stresses—expansion pier bearings—fixed pier bearings—horizontally curved bridges—integral abutments—semi-integral abutments—steel-girder bridges
F
IELD
M
ONITORING OF
C
URVED
G
IRDER
B
RIDGES WITH
I
NTEGRAL
A
BUTMENTS
Final Report January 2014
Principal Investigator Brent M. Phares, Director
Bridge Engineering Center, Iowa State University
Research Assistants Jerad Hoffman and Gus Shryack
Authors
Lowell Greimann, Brent M. Phares, Yaohua Deng, Gus Shryack, and Jerad Hoffman
Sponsored by
Federal Highway Administration (FHWA) TPF-5(169) and Transportation Pooled Fund partners:
Iowa DOT (lead state), Ohio DOT, Pennsylvania DOT, and Wisconsin DOT
Preparation of this report was financed in part
through funds provided by the Iowa Department of Transportation through its Research Management Agreement with the
Institute for Transportation (InTrans Project 08-323)
A report from
Bridge Engineering Center Iowa State University 2711 South Loop Drive, Suite 4700
Ames, IA 50010-8664
TABLE OF CONTENTS
LIST OF VARIABLES... xiv
ACKNOWLEDGEMENTS ... xvii
EXECUTIVE SUMMARY ... xix
CHAPTER 1 INTRODUCTION ...1
1.1 Background ...1
1.2 Objective and Scope ...1
1.3 Research Plan ...1
1.4 Report Organization ...4
CHAPTER 2 BACKGROUND/LITERATURE REVIEW ...5
2.1 Mechanics and Behavior of Horizontally Curved Girders ...5
2.2 Comparing Levels of Analysis for Horizontally Curved Bridges ...9
2.3 History of the Design Specifications for Horizontally Curved Bridges ...11
2.4 Load Distributions for Horizontally Curved Bridges ...12
2.5 Framing and Erection of Horizontally Curved Girders ...13
2.6 Integral Abutments and Horizontally Curved Girders ...14
2.7 Past Work on Thermal Loading on Horizontally Curved IABs ...15
2.8 Select Past Work on Thermal Loading on Straight IABs ...15
2.9 Past Work on Thermal Loading on Horizontally Curved Non-IABs ...17
CHAPTER 3 SURVEY OF STATES ...19
3.1 Purpose ...19
3.2 Description of Survey ...19
3.3 Information Gained ...19
CHAPTER 4 IN-SERVICE BRIDGE INSPECTIONS ...22
4.1 Bridge Location and Geometry ...22
4.2 Inspection Findings ...22
CHAPTER 5 EXPERIMENTAL PROCEDURE ...28
5. 1 Bridge Location and Geometry ...28
5.2 Long-Term Instrumentation and Data Collection Protocol ...40
5.3 Short-Term Instrumentation and Data Collection Protocol ...49
5.4 Live Load Testing ...54
CHAPTER 6 LONG-TERM EXPERIMENTAL PROCEDURE AND RESULTS ...57
6. 1 Pre-analysis ...57
6.2 Member Strains and Forces ...62
6.3 Measured Displacements ...95
CHAPTER 8 ANALYTICAL STUDY ...161
8.1 Introduction ...161
8.2 Model Development...161
8.3 Model Validation ...171
8.4 Design Loading ...180
8.5 Results and Observations ...183
CHAPTER 9 SENSITIVITY STUDY...198
9.1 Curvature and Skew Effects...198
9.2 Pier Fixity Effects ...216
CHAPTER 10 SUMMARY, CONCLUSIONS, AND RECOMMENDATIONS ...218
10.1 Long-Term Experimental Study ...218
10.2 Short-Term Experimental Study ...222
10.3 Analytical Study...224
10.4 Sensitivity Study ...226
REFERENCES ...231
LIST OF FIGURES
Figure 2.1. Three moment components in a single curved girder ...6
Figure 2.2. Normal stress in flanges due to three moment components ...6
Figure 2.3. Normal stress in flanges due to major axis bending and lateral bending ...7
Figure 2.4. Lateral flange bending (from Figure A-1 Hall et al. 1999) ...7
Figure 2.5. Four normal stress components (from Figure A-5 Hall et al. 1999) ...8
Figure 2.6. Levels of analysis (from Fig. 1 Kim et al. 2007)...13
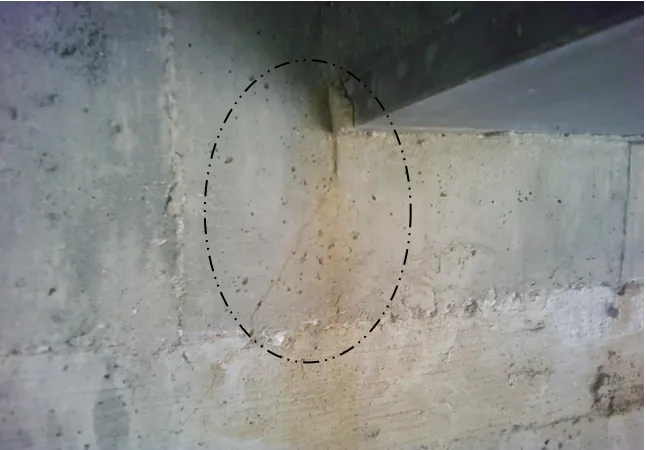
Figure 4.1. North abutment hairline crack ...23
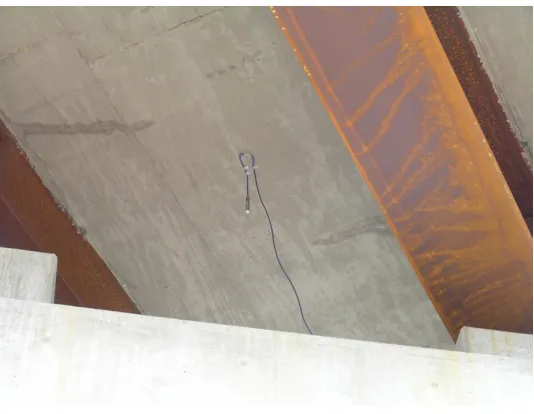
Figure 4.2. North abutment and bottom flange interface ...24
Figure 4.3. Off-ramp slab cracking ...24
Figure 4.4. Deck transverse cracking ...25
Figure 4.5. Guardrail transverse cracking ...25
Figure 4.6. Approach slab/bridge joint ...26
Figure 4.7. North abutment and bottom flange interface ...26
Figure 4.8. Calcium carbonate formation ...27
Figure 4.9. Girder-to-diaphragm welded connection ...27
Figure 5.1. NEMM bridge locations and site layout ...28
Figure 5.2. Bridge 109 plan view...29
Figure 5.3. Bridge 209 plan view...30
Figure 5.4. Bridge 309 plan view...30
Figure 5.5. Bridge 2208 plan view...31
Figure 5.6. Bridge 2308 plan view...31
Figure 5.7. Bridge 2408 plan view...32
Figure 5.8. Typical bridge cross section ...33
Figure 5.9. Local girder coordinate system ...35
Figure 5.10. Expansion pier bearing ...36
Figure 5.11. Fixed pier bearing ...37
Figure 5.12. Integral abutment – front elevation ...37
Figure 5.13. Integral abutment Section A-A ...38
Figure 5.14. Semi-integral abutment – front elevation ...38
Figure 5.15. Semi-integral abutment Section A-A ...39
Figure 5.16. Integral Abutment pile coordinate system for Bridge 309 ...40
Figure 5.17. Vibrating-wire strain gauge ...41
Figure 5.18. Expansion meter ...42
Figure 5.19. Long-range displacement meter ...43
Figure 5.20. Temperature gauge ...43
Figure 5.21. Bridge 109 instrumentation ...44
Figure 5.22. Bridge 209 instrumentation ...45
Figure 5.23. Bridge 309 instrumentation ...45
Figure 5.24. Bridge 2208 instrumentation ...46
Figure 5.25. Bridge 2308 instrumentation ...46
Figure 5.26. Reflector instrumentation ...47
Figure 5.31. Bridge 209 plan view...51
Figure 5.32. Bridge 2208 plan view...51
Figure 5.33 Bridge 2308 plan view...52
Figure 5.34. Bridge 109 plan view...52
Figure 5.35. Section 1 strain transducer locations ...53
Figure 5.36. Section 2 strain transducer locations ...53
Figure 5.37. I-girder and diaphragm strain transducer detail ...54
Figure 5.38 Truck configuration and loading ...54
Figure 5.39. (a) Plan view and (b) cross section view of load path placement ...55
Figure 6.1. Concrete member ...59
Figure 6.2. Steel member ...59
Figure 6.3. Composite concrete and steel member ...60
Figure 6.4. Resolved girder forces ...64
Figure 6.5. Four equations and four unknowns ...65
Figure 6.6. Bottom flange east strain gauge reading ...66
Figure 6.7. Top flange east strain gauge reading ...67
Figure 6.8. Top flange west strain gauge reading ...67
Figure 6.9. Bottom flange west strain gauge reading ...68
Figure 6.10. Axial strain versus time ...69
Figure 6.11. Major axis bending versus time ...69
Figure 6.12. Top flange lateral bending versus time ...70
Figure 6.13. Bottom flange lateral bending versus time ...70
Figure 6.14. Axial strain versus Teff ...71
Figure 6.15. Major axis bending versus Teff ...72
Figure 6.16. Top flange lateral bending versus Teff ...72
Figure 6.17. Bottom flange lateral bending versus Teff ...73
Figure 6.18. Strain range calculation – axial strain example ...74
Figure 6.19. Bridge 309:2308 axial strain range...77
Figure 6.20. Bridge 209:2208 axial strain range...77
Figure 6.21. Bridge 109 axial strain range ...77
Figure 6.22. Bridge 309:2308 strong axis bending strain range ...78
Figure 6.23. Bridge 209:2208 strong axis bending strain range ...78
Figure 6.24. Bridge 109 strong axis bending strain range ...78
Figure 6.25. Bridge 309:2308 lateral bending strain top flange ...79
Figure 6.26. Bridge 209:2208 lateral bending strain top flange ...79
Figure 6.27. Bridge 109 lateral bending strain top flange ...79
Figure 6.28. Bridge 309:2308 lateral bending strain bottom flange ...80
Figure 6.29. Bridge 209:2208 lateral bending strain bottom flange ...80
Figure 6.30. Bridge 109 lateral bending strain bottom flange ...80
Figure 6.31. Bridge 309:2308 axial force range ...81
Figure 6.32. Bridge 209:2208 axial force range ...81
Figure 6.33. Bridge 109 axial force range ...81
Figure 6.34. Bridge 309:2308 strong axis moment range ...82
Figure 6.35. Bridge 209:2208 strong axis moment range ...82
Figure 6.36. Bridge 109 strong axis bending moment range ...82
Figure 6.38. Bridge 209:2208 lateral bending moment top flange ...83
Figure 6.39. Bridge 109 lateral bending moment top flange ...83
Figure 6.40. Bridge 309:2308 lateral bending strain bottom flange ...83
Figure 6.41. Bridge 209:2208 lateral bending strain bottom flange ...84
Figure 6.42. Bridge 109 lateral bending strain bottom flange ...84
Figure 6.43. Abutment pile internal forces ...85
Figure 6.44. Typical internal axial strain ...86
Figure 6.45. Typical internal major axis bending strain ...87
Figure 6.46. Typical internal minor axis bending strain ...88
Figure 6.47. Typical internal torsional-warping strain ...89
Figure 6.48. Northwest abutment backwall pressure versus effective temperature ...91
Figure 6.49. Northeast abutment backwall pressure versus effective temperature ...92
Figure 6.50. Southwest abutment backwall pressure versus effective temperature ...93
Figure 6.51. Southeast abutment backwall pressure versus effective temperature ...94
Figure 6.52. Assumed backfill passive stress distribution ...94
Figure 6.53. Local abutment and pier coordinate systems...96
Figure 6.54. Bridge 309 benchmark three movements ...97
Figure 6.55. Bridge 109 total change in length ...99
Figure 6.56. Bridge 209 total change in length ...99
Figure 6.57. Bridge 309 total change in length ...100
Figure 6.58. Bridge 2208 total change in length ...100
Figure 6.59. Bridge 2308 total change in length ...101
Figure 6.60. Bridge 2408 total change in length ...101
Figure 6.61. Bridge 209 change in length per span ...103
Figure 6.62. Bridge 309 change in length per span ...103
Figure 6.63. Bridge 2208 change in length per span ...103
Figure 6.64. Bridge 2308 change in length per span ...104
Figure 6.65. Bridge 109 change in length per span ...104
Figure 6.66. Bridge 2408 change in length per span ...104
Figure 6.67. Bridge 109 deflected shape ...107
Figure 6.68. Bridge 209 deflected shape ...108
Figure 6.69. Bridge 309 deflected shape ...109
Figure 6.70. Bridge 2208 deflected shape ...110
Figure 6.71. Bridge 2308 deflected shape ...111
Figure 6.72. Bridge 2408 deflected shape ...112
Figure 6.73. Bridge 109 movement at north abutment west and east reflectors ...113
Figure 6.74. Bridge 109 movement at north pier west and east reflectors ...113
Figure 6.75. Bridge 109 movement at south pier west and east reflectors ...114
Figure 6.76. Bridge 109 movement at south abutment west and east reflectors ...114
Figure 6.77. Bridge 209 movement at north abutment west and east reflectors ...115
Figure 6.78. Bridge 209 movement at north pier west and east reflectors ...115
Figure 6.79. Bridge 209 movement at south pier west and east reflectors ...116
Figure 6.80. Bridge 209 movement at south abutment west and east reflectors ...116
Figure 6.84. Bridge 309 movement at south abutment west and east reflectors ...118
Figure 6.85. Bridge 2208 movement at north abutment west and east reflectors ...119
Figure 6.86. Bridge 2208 movement at north pier west and east reflectors ...119
Figure 6.87. Bridge 2208 movement at south pier west and east reflectors ...120
Figure 6.88. Bridge 2208 movement at south abutment west and east reflectors ...120
Figure 6.89. Bridge 2308 movement at north abutment west and east reflectors ...121
Figure 6.90. Bridge 2308 movement at north pier west and east reflectors ...121
Figure 6.91. Bridge 2308 movement at south pier west and east reflectors ...122
Figure 6.92. Bridge 2308 movement at south abutment west and east reflectors ...122
Figure 6.93. Bridge 2408 movement at north abutment west and east reflectors ...123
Figure 6.94. Bridge 2408 movement at north pier west and east reflectors ...123
Figure 6.95. Bridge 2408 movement at south pier west and east reflectors ...124
Figure 6.96. Bridge 2408 movement at south abutment east and west reflectors ...124
Figure 6.97. Bridge 109 relative displacement between fixed pier and Girder B ...125
Figure 6.98. Absolute movement of bottom flange of Girder B at north pier reflector...125
Figure 6.99. Expansion pier displacement ...126
Figure 6.100. Equivalent cantilever pile model ...127
Figure 6.101. SAHP1 weak axis bending strain versus displacement ...128
Figure 6.102. SAHP4 weak axis bending strain versus displacement ...128
Figure 6.103. SAHP6 weak axis bending strain versus displacement ...129
Figure 6.104. NAHP1 weak axis bending strain versus displacement ...129
Figure 6.105. NAHP4 weak axis bending strain versus displacement ...130
Figure 6.106. NAHP6 weak axis bending strain versus displacement ...130
Figure 7.1. Bridge 309-S1 Girder A strain (LP2) ...131
Figure 7.2. Bridge 309-S1 Girder B strain for (LP2) ...132
Figure 7.3. Bridge 309-S1 Girder C strain (LP2) ...132
Figure 7.4. Bridge 309-S1 Girder D strain (LP2) ...133
Figure 7.5. Bridge 309-S2 Girder A strain (LP2) ...133
Figure 7.6. Bridge 309-S2 Girder B strain (LP2) ...134
Figure 7.7. Bridge 309-S2 Girder C strain (LP2) ...134
Figure 7.8. Bridge 309-S2 Girder D strain (LP2) ...135
Figure 7.9. Bridge 309-S1 Girder A bottom flange strain (LP3) ...137
Figure 7.10. Bridge 309-S2 Girder A bottom flange strain (LP3) ...137
Figure 7.11. Bridge 309-S1 Girder B top flange strain (LP3) ...138
Figure 7.12. Girder B-S2 top flange strain (LP3) ...138
Figure 7.13. Bridge 309 inner diaphragm strain (LP2) ...139
Figure 7.14. Bridge 309 center diaphragm strain (LP2) ...139
Figure 7.15. Bridge 309 outer diaphragm strain (LP2) ...140
Figure 7.16. Bridge 209-S1 dynamic loading strain in Girder A...141
Figure 7.17. Bridge 209-S1 static loading strain in Girder A ...141
Figure 7.18. Superimposed static and dynamic load strains ...142
Figure 7.19. Diaphragm cross-section ...144
Figure 7.20. Two equations and two unknowns ...144
Figure 7.21. Bridge 309-S1 strong axis moments in girders (LP1) ...145
Figure 7.22. Bridge 309-S1 strong axis moments in girders (LP2) ...145
Figure 7.24. Bridge 309-S1 lateral bottom flange moments (LP3) ...147
Figure 7.25. Bridge 309-S2 lateral bottom flange moments (LP3) ...148
Figure 7.26. Bridge 309-S2 lateral top flange moments (LP3)...149
Figure 7.27. Bridge 309-S1 axial forces in girders (LP3)...150
Figure 7.28. Bridge 309-S2 axial forces in girders (LP3)...150
Figure 7.29. Bridge 309 strong axis moments in diaphragms (LP3) ...151
Figure 7.30. Bridge 309 axial forces in diaphragms (LP3) ...152
Figure 7.31. Bridge 309-S2 (LP1) ...153
Figure 7.32. Bridge 309-S1 single lane moment distributions for three truck lanes ...154
Figure 7.33. Bridge 309-S2 single lane moment distributions for three truck lanes ...154
Figure 7.34. Bridge 309-S1 moment distributions versus truck position ...155
Figure 7.35. Bridge 309-S2 moment distributions versus truck position ...155
Figure 7.36. Bridge 309 maximum moment distribution factors...156
Figure 7.37. Maximum moment distribution factors in bridges ...157
Figure 7.38. Bridge 309 Girder A ratio of Mlb/Mx ...159
Figure 8.1. Model superstructure cross section ...162
Figure 8.2. Plate girder sizes elevation view ...163
Figure 8.3. Typical pier geometry...164
Figure 8.4. Analytical model elevation view ...164
Figure 8.5. Analytical model plan view ...165
Figure 8.6. Analytical model end views ...165
Figure 8.7. Meshed diaphragms and girders ...168
Figure 8.8. Meshed changes in girder bottom flange thicknesses ...168
Figure 8.9. Typical meshed cross section with parapets ...169
Figure 8.10. Meshed girders and abutment ...169
Figure 8.11. Meshed pier ...170
Figure 8.12. Simply supported abutment (left) and pier (right) ...171
Figure 8.13. Deflected shape for outer truck position ...172
Figure 8.14. Outside path at Section 2 Girder A ...173
Figure 8.15. Center path at Section 1 Girder B...173
Figure 8.16. Laterally-deflected girders...174
Figure 8.17. Deflected shape for center truck position ...176
Figure 8.18. Composite section presented by consultant ...177
Figure 8.19. FEM center path at Section 1 ...178
Figure 8.20. FEM center path at Section 2 ...178
Figure 8.21. Girder A center path at Section 1 ...179
Figure 8.22. Girder C center path at Section 2 ...179
Figure 8.23. Design truck specifications (from Figure 3.6.1.2.2-1 AASHTO 2010) ...181
Figure 8.24. Uniform temperature distribution ...182
Figure 8.25. Temperature gradient...183
Figure 8.26. North pier Service I loads ...185
Figure 8.27. Center span Service I loads ...186
Figure 8.28. North pier Service I loads ...187
Figure 8.32. North pier Service I loads ...189
Figure 8.33. Center span Service I loads ...190
Figure 8.34. North pier load combinations ...191
Figure 8.35. Center span load combinations ...192
Figure 8.36. North pier load combinations ...193
Figure 8.37. Center span load combinations ...193
Figure 8.38. North pier load combinations ...194
Figure 8.39. Center span load combinations ...195
Figure 9.1. Bridge 309 circled locations of extracted results ...199
Figure 9.2. Stress points in girder section ...200
Figure 9.3. Critical stresses in Girder A and D at mid-center span with varying skew and curvature ...202
Figure 9.4. Critical stresses in Girder A and D at north pier with varying skew and curvature ..203
Figure 9.5. Total stresses at Points 3 and 4 of Girder A at mid-center span...205
Figure 9.6. Total and component stresses in Girder A at mid-center span due to DL+LL+T(+) 206 Figure 9.7. Total and component stresses in Girder A at mid-center span due to DL+LL+T(-) .207 Figure 9.8. Total and component stresses in Girder A at mid-center span due to DL ...208
Figure 9.9. Total and component stresses in Girder A at mid-center span due to LL ...209
Figure 9.10. Total and component stresses in Girder A at mid-center span due to T(+) ...210
Figure 9.11. Total and component stresses in Girder D at north pier due to DL+LL+T(+) ...212
Figure 9.12. Total and component stresses in Girder D at north pier due to DL ...213
Figure 9.13. Total and component stresses in Girder D at north pier due to LL ...214
LIST OF TABLES
Table 2.1. Levels of analysis (from Table 1 Nevling et al. 2006) ...10
Table 5.1. NEMM bridge geometry ...32
Table 5.2. Steel girder dimensions (all dimensions in inches) ...34
Table 5.3. Girder A composite section properties at strain gauge locations ...35
Table 5.4. Girder D composite section properties ...36
Table 6.1. Girder A strain range (in Microstrain) ...75
Table 6.2. Girder D strain range (in Microstrain) ...75
Table 6.3. Girder A force range (in kip) ...76
Table 6.4. Girder D force range (in kip-in.) ...76
Table 6.5. Measured pile internal strain ranges ...87
Table 6.6. Calculated pile internal force ranges ...89
Table 6.7. Approximation of girder axial force from abutment backwall pressure ...95
Table 6.8. Total free expansion and measured change in length ...102
Table 6.9. Calculated average axial strain versus measured average axial strain ...102
Table 6.10. Effective thermal length ...106
Table 7.1. Maximum strain (μ𝜀) at bottom of web ...135
Table 7.2. Maximum strain (μ𝜀) at top of web ...136
Table 7.3. Maximum diaphragm strains (μ𝜀) ...140
Table 7.4. Maximum DAF (%) in bottom flange strain ...142
Table 7.5. Maximum Mx in girder (kip-in.) ...146
Table 7.6. Maximum Mlb in girders (kip-in.) ...148
Table 7.7. Maximum Mlt in girders (kip-in.) ...149
Table 7.8. Maximum P in girders (kip)...150
Table 7.9. Maximum Mx in diaphragms (kip-in.) ...151
Table 7.10. Maximum P in diaphragms (kip) ...152
Table 7.11. Moment distribution factors for multi-lane live loading ...156
Table 7.12. Results from AASHTO LRFD equation C4.6.1.2.4b-1 ...159
Table 7.13 S2: Mlb/Mx (%) from field results ...159
Table 7.14. S1: Mlb/Mx (%) from field results ...160
Table 8.1. ANSYS model concrete material properties ...166
Table 8.2. ANSYS model steel material properties ...167
Table 8.3. Center load path average bottom flange strain (μ𝜀) ...174
Table 8.4. Outside load path bottom flange strain (μ𝜀) ...174
Table 8.5. Inside load path bottom flange strain (μ𝜀) ...175
Table 8.6. Ranges of measured temperatures and strains in Girders A and D at different spans and backwall pressure at abutments ...175
Table 8.7. Strain range comparison between field data and FEM results...176
Table 8.8. Uniform temperature values ...182
Table 8.9. Girder A unfactored internal forces at north pier ...184
Table 8.10. Girder A unfactored internal forces at center span ...184
Table 8.11. North pier Strength I stresses ...196
LIST OF VARIABLES
A, B, and C = gauge specific constants given by manufacturer
Ac = the area of concrete
Ap = cross-sectional area of the pile tips
As = the area of the steel
Babutment = width of the abutment
Be = effective slab width,
D = the depth of the web
DAF = dynamic amplification factor
DC = dead load for structural components
D0 = initial reading
Di = reading at time i
(EA)eff = effective axial rigidity
(EIx)eff = the effective flexural axial rigidity for X-axis bending
Ec = the linear elastic modulus of concrete
Es = the linear elastic modulus of steel
G = correction factor that converts digits to inches (provided by manufacturer)
If = moment of inertia of a flange about its smaller principal axis
Iytb = moment of inertia of the bottom flange of the steel girder for Y-axis bending
Iytf = moment of inertia of the top flange of the steel girder for Y-axis bending
IM = dynamic impact factor for live load
K = a temperature correction coefficient given by the manufacturer (digits/°C)
Kp = the coefficient of passive lateral earth pressure (psi/psi)
Kq = end-bearing soil-spring resistance
Kv = skin-friction soil-spring resistance
L = length of bridge along curve
L = length of the member
Leff = effective thermal length
Lcable = the length of the cable
Lc = the length of the concrete member
Le = equivalent cantilever length
Lg = distance between equivalent Mg moments
Lgauge = the distance from the top of the abutment to the pressure cells
Lmax = the total height of each abutment
Lp = tributary pile length for each soil-skin-friction soil-spring
Ls = the length of the steel member
LL = vehicular live load
M = resulting end moment
M and B = constants for the model 1127 gauges given by the manufacturer
Mf = lateral bending moment acting on the flanges
Mg = resulting moment at location of strain gauges
Mlat = the lateral flange moment in a girder at the brace point due to vertical loading
Mlb = lateral bending moment in the bottom flange
Mx = strong axis bending moment
MDF = moment distribution factors
N = a constant of either 10 or 12 (engineer’s discretion)
P = applied load on composite section
P = the internal axial force
Pc = applied unit load on concrete
Ps = applied unit load on steel
Pgauge = the maximum stress measured at the location of pressure cells
Pmax = the approximated maximum stress at the bottom of the abutment
Ptotal = the total approximate force applied to each abutment
R = the radius of the girder
Ri = the frequency reading produced by the gauge when the vibrating wire is
plucked
TG = force effect due to temperature gradient
TU = force effect due to uniform temperature
Y(NA) = the distance to the neutral axis measured from the center of the bottom flange
Z = depth from top of soil to location of desired stress
Δ = applied lateral end displacement
bfb = bottom flange width
bft = top flange width
d = centerline concrete slab to centerline bottom flange
fbw = tension or compression stress due to warping of the cross-section
hw = web height
tfb = bottom flange thickness
tft = top flange thickness
ts = slab thickness
tw = web thickness
x = distance from center of flange to flange tip
xi = distance from neutral axis to strain gauge i along the X-axis
yi = distance from neutral axis to strain gauge i along the Y-axis
ӯ = distance from the center of the bottom flange to the neutral axis
αc = the thermal expansion of concrete
αcable = the coefficient of thermal expansion of the cable
αeff = the effective thermal expansion coefficient of combined steel and concrete
αs = the thermal expansion of steel
δ = displacement of composite section
δc = displacement of concrete
δs = displacement of steel
εcurrent = the microstrain reading at its respective time
εreference = the microstrain reading on April 28, 2011 at 6 a.m.
εa = internal axial strain
εylt = lateral bending strain in the top flange
εylb = lateral bending strain in the bottom flange
𝜀s = static strain
𝜀d = dynamic strain
ΔDcable = the correction
ΔDuncorrected = the reading before a temperature correction
∆Lavg = the average bridge expansion computed via instrumentation data during the
surveying time interval
∆Ls = the surveying expansion referenced to April 28, 2011 at 6 a.m.
∆Ls′ = the surveying expansion at the time of the survey on April 28, 2011
ΔTair = the ambient air temperature
ΔTeff = the effective bridge temperature
ΔTc = the change in temperature of the concrete member
ΔTs = the change in temperature of the steel member
Δd = range of longitudinal movement of fixed pier or integral abutment
Δε = difference in microstrain
∆εr = resistance axial strain
σx′ = total horizontal stress
σz′ = total vertical stress
σx = strong axis bending stress
σlb = lateral bending stress in the bottom flange
σa = axial stress
ϕ′ = effective friction angle of the soil
ɣ′ = unit weight of soil
ɣp = design load factor for permanent loads
ɣTG = design load factor for temperature gradients
ɣTU = design load factor for uniform temperature
νc = Poisson’s Ratio for concrete
ACKNOWLEDGEMENTS
The research team would like to acknowledge the Federal Highway Administration for
sponsoring this Transportation Pooled Fund study: TPF-5(169). The authors would also like to thank the state pooled fund department of transportation (DOT) partners for their support:
Iowa DOT (lead state)
Ohio DOT (ODOT)
Pennsylvania DOT (PennDOT)
EXECUTIVE SUMMARY
The National Cooperative Highway Research Program (NCHRP) has shown concerns regarding the design, fabrication, and erection of horizontally curved steel girder bridges due to
unpredicted girder displacements, fit-up, and locked-in stresses, including thermal stresses. Because curved steel girder bridges are used in up to one-quarter of the nation’s steel girder bridges, having a better understanding of actual behavior – and therefore having better design methodologies – is of notable importance.
The primary objective of this work was to monitor and evaluate the behavior of six in-service, horizontally curved, steel-girder bridges with integral and semi-integral abutments and to provide design recommendations.
A national survey was conducted and a literature review was performed to capture the state-of-the-art regarding these types of structures. Also, a monitoring program was developed and deployed on six bridges located at the I-35, I-235, and I-80 interchange on the northeast side of Des Moines, Iowa to obtain strains and movements that result from long term temperature changes. An additional instrumentation system was installed to measure strains in the girders under short term loading with known truck weights and paths. The data gathered during the monitoring period of the project were post-processed to study important behavioral attributes. The sensitivity of long term thermal loading and short term live loading stresses to curvature, skew and pier bearing fixity was also studied.
The following general conclusions were made from the results of the study:
There were no measureable differences in the behavior of the horizontally curved bridges and
straight bridges studied in this work under thermal effects. For preliminary member sizing of curved bridges, thermal stresses and movements in a straight bridge of the same length are a reasonable first approximation.
Thermal strains in integral abutment and semi-integral abutment bridges were not noticeably
different. The choice between IAB and SIAB should be based on life – cycle costs (e.g., construction and maintenance).
The measured internal strain in the abutment piles due to expansion and contraction of the bridge were generally below 50% of yield stress. The equivalent cantilever method of steel pile analysis fell short of accurately predicting weak axis bending strain.
The soil pressures on the abutment backwalls were generally below the approximate passive
soil pressures.
Moment distribution factors for the short term live loading were influenced by the amount of curvature.
An analysis of the bridges predicted a substantial total stress (sum of the vertical bending stress, the lateral bending stress, and the axial stress) up to 3 ksi due to temperature effects.
CHAPTER 1 INTRODUCTION
This chapter presents the background to the project and the problems it addresses, the objective and scope of the project, and the research plan undertaken during the project. The final section of this chapter summarizes the organization of this report.
1.1 Background
A report published by The National Cooperative Highway Research Program (NCHRP) raised concerns regarding the design, fabrication, and erection of horizontally curved steel girder bridges. These concerns are centered around difficult-to-predict girder displacements, fit-up issues, and unintended locked-in stresses. Because curved steel girder bridges are used in up to one-quarter of the nation’s steel girder bridges, having a better understanding of actual behavior – and therefore having better design methodologies – is of notable importance. In order to have these concerns addressed, the NCHRP developed a research problem statement and gave it high priority for funding.
A major problem facing the nation today is the need to replace large numbers of bridges. Future engineers will need to utilize cost effective and durable designs in order to meet this challenge. Bridge joints permit relative movement between bridge deck spans and abutments; however, they must be continually maintained at a cost to the owner. Therefore, an urgent need exists to reduce bridge maintenance costs by eliminating or reducing deck joints. One way to achieve this is by expanding the use of integral abutments to include curved girder bridges.
1.2 Objective and Scope
The combined use of horizontally curved steel girder bridges and integral abutments looks to be a promising design; however, this combination is relatively new to the nation, and to Iowa. The purpose of the work summarized herein is to investigate the use of integral abutments on curved girder bridges through a monitoring and evaluation program of in-service bridges.
1.3 Research Plan
The objective of the research project was to gather information that will assist in the future design of integral-abutment, curved-girder bridges by monitoring and analyzing the behavior of curved steel girder bridges with integral abutments. There were three general task groups for this project, each of which consisted of several related tasks, as described below.
1.3.1 Task Group I: Information Collection
Task A – Technical Advisory Committee
A technical advisory committee (TAC) was formed to assist the research team regarding issues related to curved girders, integral and semi-integral abutments, and fixed and expansion bearings at piers. The TAC also assisted in establishing performance metrics that could be used to
evaluate the performance of curved-girder, integral-abutment bridges. The TAC was encouraged to provide other information they deemed useful to the research team.
Task B – Survey of Available Technologies
A survey, which was sent to all the nation’s state DOTs, was conducted to determine if integral abutments have been used for horizontally curved bridges and, if so, what were the significant findings, conclusions, or recommendations regarding these types of bridges. The survey also requested that the state bridge engineers express concerns regarding potential behavioral issues and to provide any specific information related to instrumentation and monitoring of these types of bridges.
Task C – Review of Available Engineering Literature
Although a brief literature search and review had been performed before the project officially began, a more complete review was conducted to determine the past and present use of integral abutments for horizontally curved bridges and to uncover any concerns or problems associated with this type of bridge construction. Since significant information on curved-girder, integral-abutment bridges was not initially found in the literature, two general literature searches were conducted that individually addressed horizontally curved bridges and integral-abutment bridges separately in order to formulate potential behavioral issues and to develop a more refined project scope.
Task D – Inspect Existing Curved and Chorded Girder Bridges
The re-alignment of the intersection of Interstates I-35, I-80 and, I-235 (northeast mix-master) near Des Moines, Iowa included the demolition of the old bridges and the construction of six new bridges. Several bridge types were used in the reconstruction including curved girder bridges with integral or semi-integral abutments. For this task, two I-235 curved girder bridges were inspected to determine if there was any evidence of problems associated with the use of integral abutments.
1.3.2 Task Group II: Collect and Analyze Data on the Performance of Six Bridges
roadway bridges included in the research. Bridge characteristics are presented in Chapter 5 of this report. The following tasks highlight the steps taken by this task group:
Task E – Finalize an Instrumentation Plan
Working with the Iowa DOT Office of Bridges and Structures, the research team developed preliminary instrumentation schemes for five of the six Northeast Mix-Master bridges. These schemes are shown in Chapter 5, along with pertinent bridge information. The instrumentation layouts typically consist of strain gauges on girders and other elements, temperature sensors, sensors utilized to monitor the differential girder-to-substructure displacement at expansion piers and semi-integral abutments, and techniques for monitoring the global movement of the
substructure elements. Along with the instrumentation placed on the bridges, each of the six bridges was outfitted with eight surveying-type reflectors for the purpose of performing monthly surveys of the bridges. These reflectors were placed on the exterior girders at both abutments and both piers. The survey procedure is discussed further in Chapter 5.
Task F – Monitor and Analyze the Behavior of the Selected Bridges
The bridges were monitored over a period of approximately 18 months for the long-term health assessment. During this period, the strains, temperatures, and displacements were recorded under a variety of loading conditions. In addition, the short-term health assessment was investigated by conducting a series of live load tests as described in Chapter 5.
Task G – Develop and Validate Simple Analytical Models for the Monitored Bridges
Using the collected data, simple analytical models were developed and validated. These models may be able to be extrapolated to other design conditions (e.g., geometry, soil conditions, etc.) that may provide information on other hypothetical situations.
1.3.3 Task Group III. Develop Project Conclusions and Recommendations
The focus of this task group was to summarize the entire project with a goal of developing recommendations that will assist bridge owners with decisions regarding the combined use of curved girders and integral abutments.
Task H – Establish a Meeting with the TAC
Task I – Submit Final Report
The Final Report, presented herein, summarizing the results of the research was the final step for this task group.
1.4 Report Organization
Chapter 1 introduces the project including the project background, the objective and scope of the project, and the research plan. Chapter 2 presents the literature review, discusses the design of horizontally curved, steel-girder bridges, summarizes use of integral and semi-integral
abutments, and presents circumstances in which both have been used. Chapter 3 summarizes a survey conducted of the nation’s transportation departments in regard to their current design practices for horizontally curved, steel-girder bridges with integral and semi-integral abutments. Chapter 4 summarizes a bridge inspection conducted on two partially horizontally curved bridges with integral abutments. Chapter 5 presents the experimental procedure. Chapters 6 and 7 present the results from the testing described in Chapter 5. Chapter 8 presents an analytical investigation of design loading conditions. Chapter 9 presents a sensitivity study that was performed to
CHAPTER 2 BACKGROUND/LITERATURE REVIEW
The design and analysis of straight, integral-abutment bridges (IABs) has a long and extensive history dating back as far as the 1930s. These bridges came about after the introduction of the Hardy Cross Method, and were considered a viable solution to the drawbacks of expansion joints and expansion bearings (Tennessee DOT 1996). Although there has been a tremendous amount of research on the response of straight IABs, less attention has been paid to their horizontally curved counterparts. Research on the use of integral abutments on horizontally curved bridges is scarce (Hassiotis 2006). This chapter attempts to summarize completed work on horizontally curved, integral-abutment bridges. This chapter also presents completed work on straight, integral-abutment bridges, and on horizontally curved, non-integral-abutment bridges.
2.1 Mechanics and Behavior of Horizontally Curved Girders
A single curved girder has three force components (vertical shear, radial shear, and axial load) and three moment components (strong axis bending (Mx), weak axis bending (My), and torsion
(T)). For purposes of the following discussion, only the moment components are shown in Figure 2.1. The normal stresses induced in the upper and lower flanges of a wide flange shape by these three moments are illustrated in Figure 2.2. The stress due to the positive strong axis bending (Mx) causes tension in lower flange and an equal compression in the top flange and can be
computed by the usual strength of materials approach by assuming plane sections remain plane (Figure 2.2a). Similarly, the stress due to the weak axis bending (My) causes tension on one side
and compression on the other side of both the top and bottom flanges (Figure 2.2b). Stresses due to torsion (T) are typically divided into two categories: (1) pure torsion often called
Saint-Venant’s torsion and (2) warping torsion [steel text book reference]. The pure torsion stress is a shear stress induced into the flanges and, for thin walled open sections, usually neglected. The warping torsion is resisted by equal and opposite horizontal shears in the upper and lower flanges so that the upper flange is bent laterally in one direction and the lower flanges is bent laterally in the opposite direction. Hence, the cross section is warped and is no longer planar, as assumed in elementary beam theory. The moments that induce this bending are sometimes referred to as the bi-moments and result in normal stresses in the top and bottom flanges as illustrated in Figure 2.2c.
The total lateral moment in the flanges (Mlt and Mlb in the top and bottom flange, respectively) is
the vector sum of the weak axis bending and the warping torsion bending as illustrated in Figure 2.3 and for one flange in Figure 2.4.
In NCHRP Report 424, Hall et al. (1999) describe that vertical bending is broken down into the first three components shown in Figure 2.5 all of which induce bending about the major axis, as in Figure 2.2. Component 1 represents the moment in each girder if all the girders deflected uniformly. Component 2 is the result of restoring forces in connecting members. Adjacent girder generally have different stiffnesses and different loads. Connecting members, such as the
Component 3 moments occur because the girders have different radii. The outside girder is less stiff because of its larger radius (and, generally, longer span). If the cross sectional properties are about the same, the outside girder will develop a higher component 3 stress. According to Hall, component 4 stress is the lateral bending stress equal to the sum of the warping stress from the bi-normal moment (Figure 2.2c) and the radial bending stress (Figure 2.2b) as illustrated in Figure 2.3. Hall describes also describes an amplification effect similar to the P-delta effect in columns. It is usually a second order effect caused by the increased curvature of a curved girder due to lateral bending. The amplification effect is not included in first order linear analysis methods and can be included by considering large deflection theory. An approximation of lateral flange bending can be addressed through the V-load equation, discussed subsequently.
Figure 2.1. Three moment components in a single curved girder
Figure 2.2. Normal stress in flanges due to three moment components
T
M
xM
yM
T
M
(a)
(b)
(c)
-stress
-stress
T-stress
y
x
Figure 2.3. Normal stress in flanges due to major axis bending and lateral bending
Figure 2.4. Lateral flange bending (from Figure A-1 Hall et al. 1999)
M
M
-stress
-stress
M
lt
x
lb
Figure 2.5. Four normal stress components (from Figure A-5 Hall et al. 1999)
Miller et al. (2009) state that curved beams create twisting effects, which result in warping out of plane similar to torsion. This phenomenon is referred to as a bimoment, a product of combined lateral flange bending and torsional shear. In addition, negligible second order effects, similar to P-Δ in columns, occur when the curved compression flange bows outwards, increasing the degree of curvature.
Lydzinski et al. (2008) further explain additional complications that arise when analyzing and designing I-girders in curved bridges. Complications range from the individual plates to the constructed girder as a whole. Compared to straight girders, horizontally curved I-girders are significantly different in the following ways:
Flange local buckling may differ from the outer to the inner side of the web
Local buckling is possible on the inner half of the tension flange
S-shaped bending occurs in the web, causing an increase of stress at the web-flange connection
Bending and torsion stresses are not decoupled, resulting in lateral bending behavior
Twisting can occur under individual girder self-weight, causing construction issues in framing
(FEM) analysis method. The simplest technique, line-girder method, assumes only vertical loads applied to a single girder. Engineers must determine the amount of load and location of load between girders. Component 1 is only considered during the line-girder analysis and Component 3 may be considered if the V-load method is also applied. The grid analysis considers
Components 1, 2, and 3. Warping torsion is not recognized in the grid analysis, since only St. Venant torsion is used. Again, applying the V-load method indirectly accounts for lateral flange bending. Finite element analysis is capable of determining Components 1, 2, and 3. If large-deflection theory is used, then the effects of warping stress may also be accounted for (Hall et al. 1999).
2.2 Comparing Levels of Analysis for Horizontally Curved Bridges
Several levels of analysis can be used to determine girder responses [Hall reference]. These include, but are not limited to, the line girder method, grid method, finite strip method, and finite element modeling (FEM) analysis method. The simplest technique, line-girder method, assumes only vertical loads applied to a single girder. Only Component 1 stresses are determined in the line-girder analysis. Component 2 stresses are often determined by applying wheel load distribution factors to the line-girder method results. According to Hall, component 3 and 4 may be considered if the V-load method is also applied with the line-girder method. The grid analysis considers Components 1, 2, and 3. Warping torsion is not recognized in the grid analysis. Applying the V-load method indirectly accounts for lateral flange bending. Finite element analysis is capable of determining Components 1, 2, and 3. Component 4 can be included in the 3-D finite element analysis if the lateral flange bending degrees of freedom correspond to the moments in Fig. 2.X3 are incorporated into the model. If large-deflection theory is used, then the amplification effects may also be accounted for (Hall et al. 1999).
Very few studies have thoroughly compared different methods of analysis with respect to field test results in horizontally curved bridges. Nevling et al. (2006) attempt to evaluate the level of accuracy produced for various analysis methods through conducting research on a continuous three-span bridge. Table 2.1 details the three levels of analysis performed in the study. The bridge of interest is constructed of five, Grade 50, steel plate I-girders with the outside girder having a radius of 178.5 m (585.6 ft). The non-integral abutment skews range from 60⁰ to 35⁰.
Table 2.1. Levels of analysis (from Table 1 Nevling et al. 2006)
Level Description Analysis Tool
1 Manual AASHTO Guide Specs
V-load Method
2 2D Grillage SAP2000
MDX DESCUS
3 3D FEM SAP2000
BSDI
The study made conclusions comparing the three methods of analysis against one another, as well as the methods against field data. Compared to field results, Level 1 analyses predicted larger major axis bending moments for girders closer to the applied load and smaller major axis bending moments for girders furthest from the applied load. Correlations between Level 1 and 3 analyses to field results were inconclusive with respect to lateral bottom flange bending
moments. Levels 2 and 3 predicted major axis bending moments similar to the field results. However, Level 2 predicted more accurate vertical bending moments compared to Level 1. The study concluded that Level 3 did not provide increased accuracy that was noticeable compared to Level 2 analyses. Thus, Level 2 analysis would be recommended based on the study findings.
Miller et al. (2009) also conducted a study comparing field testing to FEM. The study focused on a multi-girder, three-span, steel composite, horizontally curved I-girder bridge. Field testing consisted of attaching several strain gauges to the steel girders and diaphragms. Static and dynamic loading, similar to an HS20 truck, was applied and later replicated on a FEM. Results concluded that the FEM predicted a higher neutral axis location compared to the field results and composite section theory. The cause may be due to slippage of the shear studs in the haunches. Comparing the FEM to field results showed that larger diaphragm shear strains were found in the field than provided by FEM analysis. In addition, including pier flexibility most accurately compared to the field results. Lastly, the curved girder may require a refined mesh in the FEM to simulate for the complex strain distribution (Miller et al. 2009).
Another FEM study was performed by Lydzinski et al. (2008). The FEM replicated a continuous three-span horizontally curved I-girder bridge comparing dynamic and static loading responses. Dynamic loading concentrated on free vibrations. FEM found that plate elements adequately represented plate bending behavior and interactions in the cross framing. Refined meshing is more critical along the longitudinal direction of the bridge versus the transverse direction at a particular cross-section. Modeling the haunch with plate elements provided negligible
differences compared to using rigid links. The authors further found that the piers can be modeled using beam elements rather than complicated 3D elements. Finally, the overall conclusion of the study indicated that including the pier model flexibility is significant in estimating the behavior of the entire bridge.
suggestions explore differences between the FEMs and the V-load analysis methods. Their research focuses on a continuous three-span bridge constructed of five steel I-girders with a noncomposite deck. A field inspection of the bridge determined that the bearings were severely deteriorated and were not allowing the degrees of freedom to be released per design. Relevance of the frozen bearings was explored throughout the FEM.
The study concluded that the detailed FEM produced accurate strain readings under applied live loading. Replacing the frozen bearings with new bearings proved to be negligible because accounting for the amount of resistance provided by frozen bearings is challenging. Another conclusion found that using the V-load for positive moments was 6.8% unconservative for the exterior girders and 8.3% conservative for interior girders when compared to FEM. For negative moments, the V-load was 16.1% conservative for interior girders and 12% unconservative for exterior girders (Barr et al. 2007). These conclusions might indicate that the V-load method offers a relatively accurate preliminary method of analysis, while FEM analysis would be recommended for final design.
2.3 History of the Design Specifications for Horizontally Curved Bridges
Through the 1960s, curved steel bridges were increasingly designed and constructed as engineers realized their advantages. Because of this, a drive began towards developing the scarcely
available specifications and guidelines. This led to the Consortium of University Research Teams (CURT) project managed by the Federal Highway Association (FHWA). The CURT project completed analytical and theoretical work, which eventually helped create a preliminary set of specifications for allowable stress design (ASD) which were later accepted by AASHTO in 1976. Through additional work by AASHTO committees and the American Iron and Steel
Institute, LFD criteria were developed and transformed from the preliminary set of ASD specifications by CURT. The LFD criteria combined with the ASD criteria formed the 1980 AASHTO Guide Specs. After eight revisions, another edition was published in 1993.
The 1993 Guide Specs concepts were difficult to understand and could be easily misused by designers. The 2003 Guide Specs offer more details for discussion of the specifications and include design examples. Design for the 2003 Guide Specs includes general parameters, preliminary design, preliminary analysis, and refined design as four main categories. General parameters are broken down into two main divisions of design and construction. The design of the bridge is subdivided into general bridge geometry and limit states that incorporate: strength, fatigue, serviceability, and constructability. Criteria for preliminary design are outlined based on material strengths and girder geometries. Preliminary member sizes and framing can be
calculated in accordance to Articles 5, 6, 9, and 12 of the specifications. As outlined in previous sections, preliminary analysis of a horizontally curved girder bridge can be much more
and lateral bending must account for curvature effects. The V-load method is recommended for simplified cases outlined in the specifications. Finite element theory is recommended for more refined analysis methods if the criteria for V-load are not met. Finally, design refinement is performed as an iterative process to ensure that all components meet design requirements such as strength, serviceability, fatigue, overload, detailing, and constructability.
Linzell et al. (2004) discusses the efforts leading up to the formation of the 2003 Guide
Specifications for Horizontally Curved Highway Bridges by AASHTO, hereafter referred to as the Guide Specs. The 2003 Guide Specs encompasses load factor design (LFD) criteria, which has been eliminated by the development of the Load and Resistance Factor Design (LRFD) design provisions. In 2006, the AASHTO Bridge LRFD Design Specifications combined the specifications for straight bridges and curved bridges so that straight and horizontally curved bridges are in one manual.
2.4 Load Distributions for Horizontally Curved Bridges
Figure 2.6. Levels of analysis (from Fig. 1 Kim et al. 2007)
A study by Miller et al. (2009), previously mentioned, made conclusions from calculated dynamic amplification factors (DAF). When comparing the FEM analysis to field data analysis, the study found that the FEM overestimated the stiffness of the diaphragm to girder connection as it predicted greater transfer of loads between adjacent girders as compared to field
measurements. Consequently, load distribution was greater for the outermost girders. The field results indicated that DAF were within the limit of AASHTO recommendations.
In contrast to the research by Miller et al. (2009), Barr et al. (2007) determined that the FEM distribution factors differed by only 5% from the AASHTO (2003) standard distribution factors. This discrepancy could be due to varying degrees of complexity in each FEM.
2.5 Framing and Erection of Horizontally Curved Girders
In a dissertation from the University of Maryland, Thanasattayawibul addresses the two main types of curved girder framing, closed and open framing (Thanasattayawibul 2006). Closed framing resists torsion through the interactions of girders that are connected by diaphragms or floor beams along with lateral bracing at girder flange locations. In contrast, open bracing does not include the horizontal bracing of girder flanges. Combinations of closed and open framing can be used during construction of curved bridges. Cross frames and diaphragms act as
secondary members in straight bridges; however, they act as load-carrying members in curved bridges. The report also notes that spacing of cross frames has a significant effect on warping stresses.
In a presentation, associated with HNTB, LaViolette further highlights the importance of erecting horizontally curved members (LaViolette 2009). He explained that lateral bending is primarily caused by warping normal stresses along with wind loads, skew, and overhangs of girders during construction. Throughout construction and erection phases, many calculations must be made to account for the several stages of construction. Stability of each individual girder and the multi-girder system as a whole must be met. Often, these calculations and checks are made by performing a 3D finite element analysis to investigate each sequence of construction. Structural engineers must account for load capacities and stabilities at all stages of construction. Notable loadings to be accounted for should include self-weights and attachments, wind loads, loads induced during lifting and tie downs, girders rolling due to unbalanced loadings, and several more. Additionally, issues during erection can be prevented by properly noting the alignment. Such preventions include detailing sufficient cross framing, using falsework, properly placing holding cranes, and thoroughly following procedures outlined for pinning, bolting and tightening. A detailed set of erection drawings are extremely important. LaViolette states that drawings should include work area plans, erection sequences, temporary supports, rigging details, etc. Neglecting to follow rigorous construction plans have proven to cause catastrophic failures resulting in injuries and death.
2.6 Integral Abutments and Horizontally Curved Girders
One key factor in general bridge design can be eliminating expansion joints and expansion bearings throughout a bridge structure. The installation and maintenance of bearing joints can be problematic due to leaky joints, which result in corrosion and buildup of debris at the bearings.. Eliminating these joints can potentially decrease maintenance costs and ultimately increase the structure life. In order to eliminate joints and seals, integral abutments were introduced. Integral abutment bridges are designed without joints in the bridge deck. They are designed to
accommodate thermal movements typically by providing flexibility of the abutment piles.. These bridges are less expensive to construct, simple to detail in design, and require less maintenance (Mistry 2000).