www.biogeosciences.net/13/1863/2016/ doi:10.5194/bg-13-1863-2016
© Author(s) 2016. CC Attribution 3.0 License.
Proximate and ultimate controls on carbon and nutrient
dynamics of small agricultural catchments
Zahra Thomas1,*, Benjamin W. Abbott2,*, Olivier Troccaz2, Jacques Baudry3, and Gilles Pinay2 1AGROCAMPUS OUEST, INRA, SAS, 35000 Rennes, France
2ECOBIO, OSUR, CNRS, Université de Rennes 1, Campus de Beaulieu, 35000 Rennes, France 3INRA, UR 980, SAD-Paysage, 35000 Rennes, France
*These authors contributed equally to this work.
Correspondence to: Zahra Thomas (zthomas@agrocampus-ouest.fr)
Received: 27 June 2015 – Published in Biogeosciences Discuss.: 17 September 2015 Revised: 25 February 2016 – Accepted: 9 March 2016 – Published: 30 March 2016
Abstract. Direct and indirect effects from human activity have dramatically increased nutrient loading to aquatic in-land and estuarine ecosystems. Despite an abundance of studies investigating the impact of agricultural activity on water quality, our understanding of what determines the ca-pacity of a watershed to remove or retain nutrients remains limited. The goal of this study was to identify proximate and ultimate controls on dissolved organic carbon and nu-trient dynamics in small agricultural catchments by inves-tigating the relationship between catchment characteristics, stream discharge, and water chemistry. We analyzed a 5-year, high-frequency water chemistry data set from three catch-ments in western France ranging from 2.3 to 10.8 km2. The relationship between hydrology and solute concentrations differed between the three catchments and was associated with hedgerow density, agricultural activity, and geology. The catchment with thicker soil and higher surface roughness had relatively invariant carbon and nutrient chemistry across hydrologic conditions, indicating high resilience to human disturbance. Conversely, the catchments with smoother, thin-ner soils responded to both intra- and interannual hydrologic variation with high concentrations of phosphate (PO3−4 ) and ammonium (NH+4) in streams during low flow conditions and strong increases in dissolved organic carbon (DOC), sedi-ment, and particulate organic matter during high flows. De-spite contrasting agricultural activity between catchments, the physical context (geology, topography, and land-use con-figuration) appeared to be the most important determinant of catchment solute dynamics based on principle components analysis. The influence of geology and accompanying
topo-graphic and geomorphological factors on water quality was both direct and indirect because the distribution of agricul-tural activity in these catchments is largely a consequence of the geologic and topographic context. This link between inherent catchment buffering capacity and the probability of human disturbance provides a useful perspective for evalu-ating vulnerability of aquatic ecosystems and for managing systems to maintain agricultural production while minimiz-ing leakage of nutrients.
1 Introduction
environmental issues currently facing humanity along with loss of biodiversity (Rockström et al., 2009).
The capacity of a watershed to remove or retain nutrients is a function of biotic and abiotic conditions encountered as water flows through the soil, groundwater, riparian zone, hy-porheic zone, and stream channel itself (Brookshire et al., 2009; Seitzinger et al., 2006; Sébilo et al., 2013; Pinay et al., 2015). For catchments larger than 100 km2, riverine nu-trient fluxes are tightly associated with percentage of agri-cultural cover (Jordan et al., 1997; Omernik et al., 1981; Strayer et al., 2003). However, in drainage basins smaller than 10 km2, nutrient fluxes vary widely despite similar land cover (Brookshire et al., 2009; Burt and Pinay, 2005; Lefeb-vre et al., 2007; Groffman et al., 2006; Sebilo, et al. 2013). This breakdown in the relationship between land cover and nutrient flux represents an important ecological uncertainty since 90 % of global stream length occurs in catchments smaller than 15 km2(Bishop et al., 2008). It also highlights a practical problem because although most water quality mon-itoring takes place in large rivers, most land-management decisions are made on the parcel or small-catchment scale (Thenail et al., 2009). The diversity in headwater-catchment response to nutrient loading also represents an opportunity to identify the mechanistic controls regulating nutrient process-ing and removal.
Two non-exclusive mechanisms may account for the change in variability of nutrient fluxes along stream net-works. First, in-stream biogeochemical processes such as nutrient uptake and spiraling vary longitudinally in stream ecosystems, typically decreasing in importance as stream or-der or discharge increases (Ensign et al., 2006; Alexanor-der et al., 2009; Hall et al., 2013). Active in-stream removal or re-tention of nutrients in headwaters could decouple land use from nutrient flux. Second, catchment characteristics such as topography, stream network density, and surficial geology vary moving from uplands to lowlands (Brookshire et al., 2007; Sidle, 2006; Strayer et al., 2003; Pinay et al., 2015), potentially altering terrestrial–aquatic linkages, modulating transport and processing of carbon and nutrients. To iden-tify controls on carbon and nutrient dynamics in headwa-ter catchments, we used a multiannual, high-frequency data set of water chemistry from three contrasting catchments in western France. Based on observations of variability in head-water catchments (Burt and Pinay, 2005), we hypothesized that landscape characteristics such as topography, surficial geology, and location within a stream network would mod-ulate the impact of land use on water quality. We hypoth-esized that carbon and nutrient concentrations would show contrasting responses due to distinct sources and flow paths across scales. We expected phosphate (PO3−4 ) and ammo-nium (NH+4) to be associated with surface flow, dissolved organic carbon (DOC) with surface and subsurface flow, ni-trate (NO−3) to come primarily from the unsaturated zone and groundwater, and dissolved silica (DSi) to come from
groundwater. To test these hypotheses, we investigated both high-frequency changes in solute concentration during dis-charge events and overall catchment water quality.
2 Methods 2.1 Study area
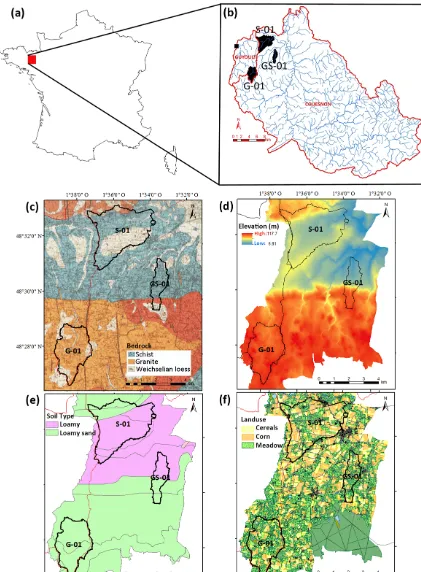
We tested our hypotheses with a 5-year data set of wa-ter chemistry from three small catchments located in the Zone Atelier Armorique long-term socio-ecological research (LTSER) area in Brittany, France (Fig. 1). The research area is located on the French Massif Armoricain (48◦360N, 1◦320W) and is underlain by granite to the south and Briove-rian schist to the north (Fig. 1c). Twenty years of meteoro-logical data were used to estimate mean temperature and cu-mulative annual precipitation (Fig. S1 in the Supplement). The climate is maritime with the average monthly tempera-ture ranging from 17.5 in July to 5◦C in December and mean annual precipitation of 965 mm, a third of which occurs from October to December (Fig. S1). Since the 1950s, the area has been subject to intense agriculture, with 90 % of arable land used for by corn and wheat and as pastureland. The study area straddles the Couesnon and Le Guyoult River basins, which discharge into the bay of Mont-Saint-Michel and the bay of Le-Vivier-sur-Mer, respectively.
2.2 Catchment characteristics and experimental design To compare the influence of catchment characteristics on car-bon and nutrient concentrations we monitored water chem-istry at three headwater catchments ranging from 2.3 to 10.8 km2, with distinct topography, geology, soil character-istics, and land use (Fig. 1; Table 1). For the purposes of this study we named catchments by near-surface geology, with the catchment G-01 occurring on granite, catchment S-01 oc-curring on schist, and catchment GS-01 straddling the bound-ary between the two geologies (detailed catchment character-istics presented in Fig. 1, Table 1, and Tables S1 and S2 in the Supplement). Soil depth, elevation, and land use vary sys-tematically between the surficial geologies, with the granite portion characterized by thicker soils (≥0.8 m), higher ele-vation (85 to 110 m), loamy sand soil type, and more per-manent or semiperper-manent pastureland (Table 1 and Fig. 1). The portion of the research area underlain by schist has shal-lower soils (0.45 to 0.7 m), a thinner weathered layer, shal-lower elevation (14.5 to 60 m), loamy soils, and a larger proportion of arable land used for corn and wheat cultivation (Fig. 1f and Table 1). The catchment situated in the transition zone between granite and schist (catchment GS-01) has contrast-ing topography (from 105 m upstream to 12.5 m at the outlet) and a mix of pasture and cultivated land.
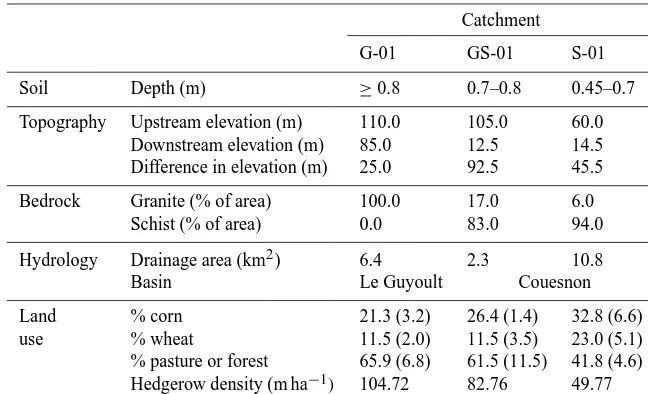
Table 1. Catchment characteristics for the catchments on granite (G-01), schist (S-01), and mixed (GS-01) substrate. Mean (standard devi-ation) of the percentage of corn, cereals, meadows, and woods on arable land use were determined from annual aerial photographs taken during the 5-year study period.
Catchment
G-01 GS-01 S-01
Soil Depth (m) ≥0.8 0.7–0.8 0.45–0.7
Topography Upstream elevation (m) 110.0 105.0 60.0 Downstream elevation (m) 85.0 12.5 14.5 Difference in elevation (m) 25.0 92.5 45.5
Bedrock Granite (% of area) 100.0 17.0 6.0
Schist (% of area) 0.0 83.0 94.0
Hydrology Drainage area (km2) 6.4 2.3 10.8
Basin Le Guyoult Couesnon
Land % corn 21.3 (3.2) 26.4 (1.4) 32.8 (6.6)
use % wheat 11.5 (2.0) 11.5 (3.5) 23.0 (5.1)
% pasture or forest 65.9 (6.8) 61.5 (11.5) 41.8 (4.6) Hedgerow density (m ha−1) 104.72 82.76 49.77
tomated sampler (Isco 3700™) controlled by a data log-ger (Campbell Scientific CR10™). Stage was continuously monitored using pressure transducers and discharge was cal-culated from rating curves determined by manual gauging with an impeller flow meter and by salt dilution (Day, 1976; Hongve, 1987). Additionally discharge was determined at the gauged station situated at the outlet of the Le Guyoult basin (station J0323010) as a part of national environmen-tal monitoring (Direction Régionale de l’Environnement, de l’Aménagement et du Logement de Bretagne, DREAL).
2.3 Water quality analyses
Water samples were collected every 12 h during baseflow for the first year, every 3 days for the following 2 years, and monthly for the last 2 years with automatic samplers. For catchments GS-01 and S-01, we programmed autosamplers to trigger more frequent sampling during discharge events, with samples taken every 30 min during the rising limb and every 3 h during the falling limb. High-frequency sampling was triggered when the water level (h)changed more than 0.3 cm in 1 min.hwas measured every minute with a mov-ing hourly mean (hmean)calculated continuously. For each minutet, the trigger level dh(t )was determined as
dh(t )=hmean−h(t ).
There were six discharge events captured by the automated samplers at GS-01 and S-01 from June 1997 to April 1998. For some of the longer events, sampling frequency slowed during the falling limb and for the largest event (April 1998) only the rising limb was sampled.
Water samples were filtered with 0.7 µm effective pore size glass fiber filters and stored at 4◦C until analysis.
Sam-ples were analyzed for DOC, NO−3, NH+4, P03−4 , dissolved silica (DSi), particulate phosphorus (PP), dissolved organic phosphorus (DOP), dissolved organic nitrogen (DON), and chloride (Cl−). DOC was analyzed with a Shimadzu total organic carbon (TOC) analyzer and nutrients were analyzed on a Lachat Quick Chem autoanalyzer. NO−3 was quantified with the modified Griess–Ilosvay method with copperized cadmium reduction, NH+4 was quantified by indophenol blue method, PO3−4 by automatic ascorbic acid method, DSi by molybdosilicate colorimetric method, and Cl−by colorimet-ric N-diethyl-p-phenylenediamine method. Total suspended sediment (TSS) was determined by filtering 1 L to 0.7 µm and weighing the filter.
2.4 Spatial data and statistical analysis
A 2 m digital elevation model (DEM) based on airborne li-dar data was used to extract morphological data used in the statistical analysis (Fig. 1d). We characterized surface rough-ness, a predictor of catchment transient storage and runoff response (Kirkby et al., 2002; Candela et al., 2005), with the mean, maximum, and minimum elevations for a grid of 10×10 m. The roughness index was calculated as
R=MeanDEM−MinDEM
MaxDEM−MinDEM
, 0< R <1.
Table 2. Spearman’s rank correlations for water chemistry parameters. Significant correlations (p< 0.05, Bonferroni-corrected) are in bold.
Catchment G-01 Q NO−3 NH+4 PO3−4 DSi DOC
NO−3 −0.06
NH+4 0.14 −0.08
PO3−4 −0.1 −0.09 0.1
DSi −0.11 0.23 0.18 0.28
DOC 0.1 −0.33 −0.12 0.48 0.14
TSS −0.04 −0.16 −0.01 0.37 0.22 0.46
Catchment GS-01 Q NO−3 NH+4 PO3−4 DSi DOC
NO3 −0.24
NH4 −0.1 0.01
PO4 0.18 −0.30 0.1
DSi −0.08 −0.13 0.04 0.05
DOC 0.49 −0.62 0.02 0.62 0.13
TSS 0.23 −0.08 0.12 0.59 −0.16 0.42
Catchment S-01 Q NO−3 NH+4 PO3−4 DSi DOC
NO3 −0.14
NH4 −0.07 −0.16
PO4 −0.48 −0.31 0.23
DSi −0.16 −0.11 0.25 0.43
DOC 0.51 −0.28 0.28 0.22 0.31
TSS 0.22 −0.17 0.13 0.18 0.23 0.48
Recherches Géologiques et Minières (BRGM) was used for the geological map of the study area.
We performed a principle components analysis (PCA) to characterize correlations in the data and identify ma-jor sources of variability in water chemistry. We included morphological parameters (geology, topography, soil depth, density of hedgerows), land use, and solute concentrations. Specifically we included bedrock (% granite and schist), land use (wheat, corn, and pastureland), stream order (Strahler, 1952), drainage area, difference in elevation between up-stream and downup-stream (dZ), and concentrations of DOC, NO−3, PO3−4 , Cl−, and DSi. We also performed Spearman’s rank correlations to test for individual correlations between water chemistry parameters. All analyses were performed in R 3.0.2 (R Core Team, 2014) with the FactoMineR package for PCA (Lê et al., 2008).
3 Results
3.1 Hydrological and land-use analysis
Hydrologic conditions varied widely across the 5 years (Ta-ble S1). The first 3 hydrological years (1 September 1995 to 31 August 1998) were 145 to 180 mm below the 20-year av-erage of 965 mm, while the last 2 years were 170 and 330 mm above average (Table S1, Fig. S1). Discharge from the three catchments was in good agreement with the Le Guyoult basin
station though there were occasional phase shifts and depar-tures, likely due to localized precipitation and differences in transient storage (Figs. S2, S3, S4, and S5).
The distribution of agricultural land was associated with soil and topographical parameters with 55 % agricultural coverage of the total land surface in catchment S-01 in the northwest part of the study area, which has flat topography and thin soils overlying schist bedrock. Conversely, catch-ments G-01 and GS-01 were dominated by pastureland and forest, with less than 38 % agricultural coverage (Fig. 1b, Ta-ble 1). The density of hedgerows also varied by a factor of 2 between catchments, with 105 m ha−1of hedgerows in catch-ment G-01 and 50 m ha−1in catchment S-01. Though there was some rotation of individual parcels between corn, wheat, and pastureland, catchment-level land use changed little over the study period, with consistent differences between the 3 catchments. For the catchment S-01, variability in land use was highest for corn and wheat (SD 6.6 and 5 %, respectively, Table 1).
3.2 Effects of catchment characteristics on water chemistry
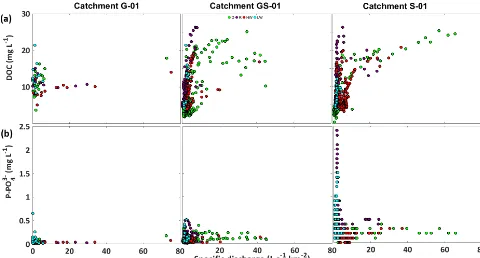
de-Figure 2. Relationship between specific discharge and (a) dissolved organic carbon, on the one hand, and (b) phosphate, on the other hand, for three headwater catchments (G-01, GS-01, and S-01) in Brittany, France. Chemistry data from daily automatic sampling supplemented by sub-daily sampling for catchments GS-01 and S-01 during discharge events (see methods for detailed sampling description). Data are colored by hydrologic period: D – discharge (April–June); LW – low water (July–September); R – recharge (October–December); HW – high water (January–March).
crease in variability and a convergence to a moderate con-centration (NO−3, NH+4, DSi, and Cl−). Solutes with sim-ilar response patterns were more tightly correlated, though significance and sometimes the sign of individual relation-ships varied somewhat by catchment (Table 2). The catch-ment G-01, which had a low gradient, high roughness, and relatively less agriculture, had more stable chemistry dur-ing both baseflow and high-flow conditions, particularly for DOC, TSS, Cl−, NO−3, and all phosphorus species (Figs. 2, 3, S7, and S8). This lower amplitude of variation in wa-ter chemistry in catchment G-01 resulted in fewer sig-nificant correlations between water chemistry parameters, and notably discharge was not significantly correlated with any solute concentrations (p> 0.05, Spearman’s rank cor-relation; Table 2). The steep and small catchment GS-01 and the highly agricultural catchment S-01 showed simi-lar patterns of solute response to discharge, though nitro-gen and phosphorus concentrations were nitro-generally lower in GS-01 than S-01 (Figs. 3 and S8). GS-01 had lower maxi-mum specific discharge (47 L s−1km−2)than catchment S-01 (66 L s−1km−2; Figs. 2 and 3).
Mean DOC concentration was highest in catchment G-01 but did not differ between catchments GS-01 and S, despite a 20 % difference in agricultural coverage (Table 1). Mean NO−3 concentration increased linearly with agricultural
cov-erage from an avcov-erage of 5 mg N L−1in G-01 to an average of 10 mg N L−1in S-01 (Fig. S9). The highest concentration and variability in PO3−4 occurred in S-01, where mean PO3−4 concentration was nearly 3 times higher than in the less agri-cultural catchments (Fig. S9).
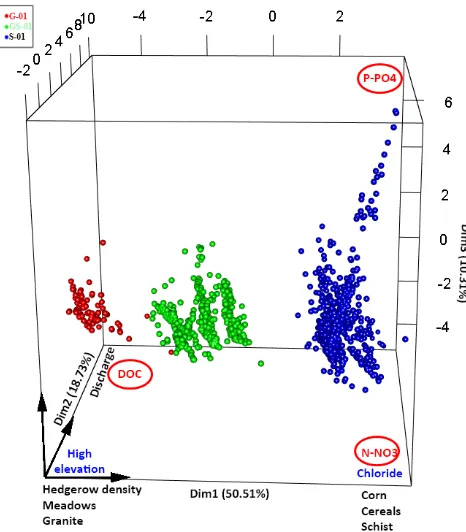
[image:6.612.58.538.66.324.2]The main departures along axis three (in the upper right cor-ner of Fig. 4) are from PO3−4 flushing events during dry years (year 1 and year 3).
3.3 Solute dynamics during discharge events
The high-frequency samples collected during six discharge events at S-01 and GS-01 revealed a primarily counterclock-wise hysteresis for DOC (higher concentration during the falling limb than at the equivalent discharge on the rising limb), a clockwise hysteresis for NO−3 and PO3−4 , and no clear pattern in NH+4 except for large variations during the rising limb of the discharge events (Fig. S10). DOC and NO−3 concentrations during discharge events were strongly negatively correlated (Figs. S11 and S12), with the elements showing nearly mirror-image responses to changes in dis-charge. NO−3 concentration was highest and DOC was low-est at or immediately after the start of the discharge event, except for GS-01 during the largest two discharge events that were sampled in April 1998 when NO−3 was higher and DOC was lower after the event (Figs. S9, S10). DOC concentration was higher during the second storm pulse than the first for that compound event. Maximum PO3−4 concentration typi-cally occurred after the NO−3 peak but before the maximum discharge, except for S-01 in November 1997. Maximum am-monium concentration occurred during the rising limb. DOC was more strongly correlated with discharge for S-01, though DOC increased for both catchments during the rising limb of the hydrograph (Fig. S10). PO3−4 concentration increased strongly at both sites at the onset of the rising limb, with sim-ilar peaks for the two subsequent discharge events in S-01 (Fig. S10).
3.4 Interannual solute dynamics
The three catchments showed distinct interannual dynam-ics for both hydrology and solute concentrations across the contrasting hydrologic years (Fig. 5). Specific discharge was consistently lowest for catchment GS-01, the steep transi-tion catchment (Fig. 5a). DOC concentratransi-tion in G-01 was invariant across the dry and wet years, whereas annual me-dian DOC in GS-01 and S-01 generally tracked discharge (Fig. 5b). Highest median DOC concentration occurred in year 3 for all catchments, which was the year of transition from dry to wet conditions and the year with the most high-flow events. Contrary to the high-frequency trends, annual NO−3 was positively associated with annual discharge for GS-01 and S-01 (Fig. 5c). Catchment G-01 was again rel-atively distinct in its behavior, with stable NO−3 concentra-tions across years (Fig. 5d). Annual PO3−4 concentration was negatively correlated with annual discharge across sites, with significantly higher concentrations in dry years (Fig. 5e). DSi was similar for catchments G-01 and S-01 but was consis-tently elevated for the steep catchment GS-01 (Fig. 5f).
4 Discussion
To quantify the influence of physical, hydrologic, and an-thropogenic controls on surface water quality, we monitored discharge and water chemistry from three agricultural catch-ments in western France for 5 years. We hypothesized that carbon and nutrient concentrations would show contrasting responses to topographic and land-use differences due to both distinct sources and transport dynamics across scales. We found that carbon and nutrient dynamics differed be-tween the three study catchments both on event and inter-annual temporal scales. However, spatially, the effect of hy-drology on solute concentration was strongly modulated by catchment characteristics such as hedgerow density, agricul-tural activity, and geology. Because the distribution of agri-cultural activity in these catchments is largely a consequence of the geologic and topographic context, these factors are the ultimate controls on the retention and release of carbon and nutrients, potentially explaining the decoupling of agricul-tural activity and water quality observed in small catchments (Burt and Pinay, 2005).
4.1 Proximate and ultimate controls on water quality
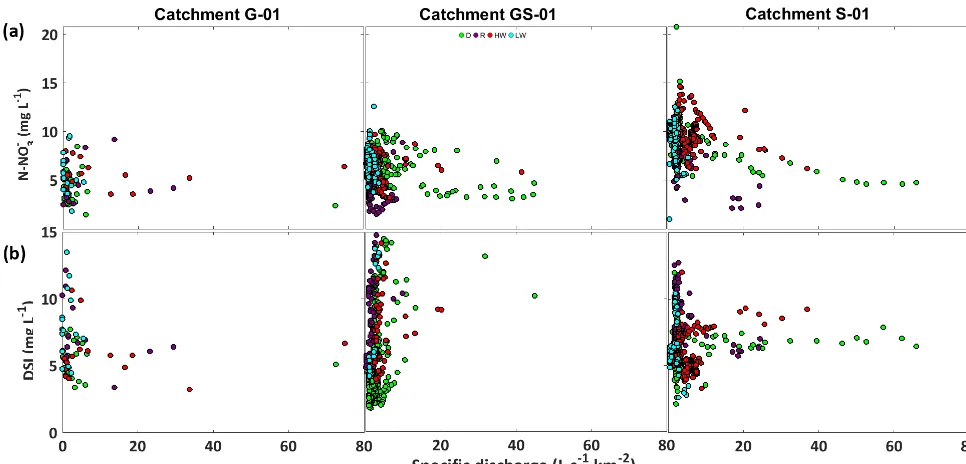
Figure 3. Relationship between specific discharge and (a) nitrate, on the other hand, and (b) dissolved silica, on the other hand, for three headwater catchments (G-01, GS-01, and S-01) in Brittany France. Chemistry data from daily automatic sampling supplemented by sub-daily sampling for catchments GS-01 and S-01 during discharge events (see “Methods” section for detailed sampling description). Data points are colored by hydrologic period (see Fig. 2 for definitions).
In addition to directly influencing catchment hydrology and nutrient retention, geology and accompanying topo-graphic and geomorphological factors exert a strong control on the distribution of human agriculture, indirectly influenc-ing nutrient loadinfluenc-ing and disturbance regime. Because farmers and land managers do not randomly select surfaces for culti-vation, land use in Brittany and throughout the world closely follows geologic and soil characteristics. Soil fertility is a function of natural weathering processes and land use (Tye et al., 2013). Spatial variability of soil moisture, which is often controlled by topography and soil properties (Yeakley et al., 1998), plays important roles in land-use distribution and organization. In our study area, the interactions between catchment context and human use have resulted in prefer-ential agricultural development of schist catchments, which unfortunately appear to be more prone to nutrient export.
In other contexts, this interaction between the risk of hu-man development and resilience to huhu-man disturbance can also mitigate impacts of agriculture (e.g. through the preser-vation of forest in steep, erodible environments; Odgaard et al., 2013), but whether it has a net increase or decrease in human impacts on aquatic ecosystems on a global scale is largely unknown (Zabel et al., 2014; Ramankutty et al., 2008). We hypothesize that the preferential development of certain surfaces would decrease in areas of intense anthro-pogenic pressure where selectivity decreases as the system reaches saturation (Li et al., 2014) but could strongly influ-ence the distribution of human activity in systems that are
expanding or contracting such as the developing world or areas of rural exodus such as much of France. Quantifying the regional effects of the selective development of more or less resilient surfaces would be possible with existing data by intersecting water chemistry data sets with soil and ge-ologic geographic information. This framework would pro-vide guidance on multiple scales for land managers seeking to improve water quality while continuing agricultural pro-duction.
4.2 Controls on chemistry across scales
Figure 4. Principle components analysis of the major sources of variability in water chemistry. Together, the first three axes explain 80 % of the total variability of the data. Principal and supplemen-tary variables are indicated respectively in black and blue. Red cir-cles indicate the poles of carbon, nitrogen, and phosphorus associ-ated with cereals and corn for N-NO−3, high discharge on granite bedrock for DOC, and both discharge and agricultural land use for P-PO3−4 . PCA scores are indicated in Table S3.
events. Various pathways and interaction between hillslope and stream are affected to a lesser extent by discharge regime (Fig. 6). Groundwater fluxes toward the stream may also con-trol nutrient concentration especially for NO−3, which is rel-atively highest in this compartment (Fig. 6).
Different mechanisms can influence short- and long-term elemental fluxes (Meybeck and Moatar, 2012; Moatar et al., 2013), explaining the contrasting short- and long-term dy-namics observed within individual catchments. For example, conditions that favor frequent flushing of soil may decrease short-term NO−3 concentration but result in larger overall fluxes. In our study, NO−3 concentration showed a nonlinear decrease with discharge on short timescales but was higher in wetter years (Fig. 5), potentially due to changing NO−3 sources. The convergence of NO−3, Cl−, and DSi concentra-tions across catchments during high-flow periods (Figs. 2, 3 and S7, S8) implies a shift from catchment-scale controls on water chemistry during low flows to larger inter-catchment controls during high flows. The upper layer of the Brioverian schist substrate beneath these drainage basins is composed of unconsolidated weathered substrate of variable thickness that could provide an inter-basin solute source during storms.
Figure 5. Discharge and carbon and nutrient concentrations during 5 contrasting hydrological years. Boxplots of (a) specific discharge, (b) dissolved organic carbon, (c) nitrate, (d) ammonium, (e) phos-phate, and (f) dissolved silica for the catchments G-01 (red box), GS-01 (green box), and S-01 (blue box). Boxplots represent me-dian, quartiles, minimum, and maximum within 1.5 times the in-terquartile range and outliers beyond 1.5 inin-terquartile range.
[image:9.612.52.285.66.332.2]Figure 6. Conceptual model of carbon and nutrient dynamics in major hydrologic compartments during transient (discharge events) and steady-state (baseflow) discharge regimes. On the left side, we represent the relative abundance of carbon, nitrogen, and phos-phate during vertical transport through soil, unsaturated zone, and groundwater. Arrows represent flow paths, which can either descend through the soil column or lead directly to the stream (represented at the bottom of the figure), which experiences fluctuations in water chemistry based on the relative contribution of these flow paths from multiple hillslopes. On the right side of the figure, schematic repre-sentations of stream chemistry during stormflow and baseflow are shown. The colors represent carbon, nitrogen, and phosphorus con-centrations, which vary depending on hydrologic conditions. See Sect. 4.2 in the “Discussion” section for more detailed interpreta-tion.
a logarithmic or linear trend, underlining the importance of soil as an active nitrogen source during high-flow periods since the NH+4 concentration in groundwater is low. These differences in short- and long-term dynamics highlight the importance of considering management goals when design-ing water quality monitordesign-ing strategies, with high-frequency monitoring during extreme flows necessary to identify peak concentrations and lower-frequency, long-term monitoring more appropriate for evaluating annual loads.
The divergent response of chemistry across temporal scales can give insight into sources and pathways of car-bon and nutrients. For catchments GS-01 and S-01, DOC increased strongly with discharge on both event and inter-annual scales (Figs. 2 and 5). However, high concentrations of DON and DOP were only observed at low flows (Fig. S7). This shift in dissolved organic matter (DOM) stoichiometry indicates a change in DOC sources, with stormflow domi-nated by plant-derived DOM from surface soils and baseflow dominated by microbial DOM from deeper soils and shal-low groundwater (Inamdar et al., 2012; Yang et al., 2015). The rapid increase in DOC concentration early in discharge events, followed by a plateau at high discharge, indicates source limitation of DOC, potentially due to changes in
con-tributing area. In colluvial soils such as our study area, ri-parian wetlands are the major source of DOC to the stream, based on13C and molecular analysis of DOC (Jeanneau et al., 2014; Lambert et al., 2014). At the beginning of a storm event, this riparian DOC is readily transported to the stream, but increased discharge connects upslope soils, which tend to be poorer in organic carbon, resulting in a plateau (Follain et al., 2007; Laudon et al., 2011). High DOC concentration in these headwater agricultural streams highlights the impor-tance of understanding carbon production and transport dy-namics in small freshwater systems (Agren et al., 2007; Cole et al., 2007).
4.3 Hedgerow density and vegetation effect on soil and shallow groundwater
We found that the effect of hydrology on solute concentration was strongly modulated by hedgerow density, which was the strongest predictor of stream chemistry in the PCA. There was less variation in carbon and nutrient concentrations for the highest hedgerow density catchment G-01. Hedgerows exert multiple controls on hydrology and biology (Mérot and Bruneau, 1993). Because vegetation is one of the major con-trols on water and energy balance, the removal or redistri-bution of vegetation with land use alters albedo and evap-otranspiration (Davin et al., 2007). Vegetation plays a cen-tral role in the interface between the atmosphere and ground-water via ground-water uptake by roots and redistribution of ground-water in the soil column, affecting soil moisture and groundwa-ter recharge. Increased transpiration (Thomas et al., 2012) and interception (Ghazavi et al., 2008) by hedgerows can decrease soil moisture on a local scale, potentially reducing the transfer of carbon and nutrients from soils to groundwa-ter or surface wagroundwa-ters. Indeed, the relatively dry soil beneath hedgerows (Caubel et al., 2001; Thomas et al., 2008) corre-sponds with lower soil and groundwater NO−3 concentration (Grimaldi et al., 2012). Enhanced NO−3 removal and reten-tion by hedgerows could be due to both increased variability in soil moisture and longer residence time, which create lo-cal microsites for denitrification (Parkin, 1987) and increase the likelihood of uptake. In our study area, hedgerow den-sity is also associated with geologic and topographic param-eters. In catchments S-01 and GS-01, where soils are more suitable for intensive agriculture, hedgerows were removed to consolidate fields during the post-war period. While our study cannot untangle the relative impacts of hedgerow den-sity and geology, it does suggest that hedgerow denden-sity can impact NO−3 mass balance on larger scales.
5 Conclusions
ele-ments. Thicker soils and higher surface roughness for catch-ments underlain by granite buffer fluctuations in water chem-istry on both event and interannual scales, potentially due to increased transient storage and residence time from higher roughness and hedgerow density. Conversely, nutrient con-centrations in catchments on schist substrates are highly sen-sitive to changes in hydrology. However, the convergence of water chemistry between catchments during discharge events suggests larger, regional influences independent of geology and topography.
Direct human impact on a catchment (fertilizer input, soil disturbance, urbanization) is asymmetrically linked with inherent catchment properties (geology, soil, topography), which together determine catchment resilience or vulnera-bility to human activity. The effect of hydrology on solute concentration is proximately controlled by catchment char-acteristics such as hedgerow density and agricultural activ-ity, but because the distribution of agricultural land use in these catchments is largely a consequence of the geologic and topographic context, these are the ultimate controls on retention and release of carbon and nutrients. This link be-tween inherent catchment buffering capacity and probability of human disturbance provides a useful perspective for eval-uating vulnerability of aquatic ecosystems and for managing systems to maintain production while minimizing leakage of nutrients.
The Supplement related to this article is available online at doi:10.5194/bg-13-1863-2016-supplement.
Author contributions. Gilles Pinay and Jacques Baudry designed the experiments. Olivier Troccaz carried them out. Zahra Thomas and Benjamin W. Abbott analyzed the data and prepared the manuscript with contributions from all coauthors.
Acknowledgements. We thank Jean Nabucet (LETG, University of Rennes 2) for the land-use maps. We also thank Pascal Pichelin and Hervé Squividant (AGROCAMPUS OUEST, UMR SAS) for maintaining and updating services and server for open access to data (http://geowww.agrocampus-ouest.fr/web/?page_id=1346) and the LTER Zone Atelier Armorique. Thanks to the BRGM for geological maps.
Edited by: R. Bol
References
Agren, A., Buffam, I., Jansson, M., and Laudon, H.: Importance of seasonality and small streams for the landscape regulation of dissolved organic carbon export, J. Geophys. Res.-Biogeo., 112, G03003, doi:29/2006jg000381, 2007.
Alexander, R. B., Böhlke, J. K., Boyer, E. W., David, M. B., Har-vey, J. W., Mulholland, P. J., Seitzinger, S. P., Tobias, C. R., Tonitto, C., and Wollheim, W. M.: Dynamic modeling of nitro-gen losses in river networks unravels the coupled effects of hy-drological and biogeochemical processes, Biogeochemistry, 93, 91–116, doi:10.1007/s10533-008-9274-8, 2009.
Bishop, K., Buffam, I., Erlandsson, M., Fölster, J., Laudon, H., Seibert, J., and Temnerud, J.: Aqua Incognita: the unknown head-waters, Hydrol. Process., 22, 1239–1242, doi:10.1002/hyp.7049, 2008.
Brookshire, E. N. J., Valett, H. M., Thomas, S. A., and Webster, J. R.: Atmospheric N deposition increases organic N loss from temperate forests, Ecosystems, 10, 252–262, 2007.
Brookshire, E. N. J., Valett, H. M., and Gerber, S.: Maintenance of terrestrial nutrient loss signatures during in-stream transport, Ecology, 90, 293–299, doi:10.1890/08-0949.1, 2009.
Burt, T. P. and Pinay, G.: Linking hydrology and biogeochem-istry in complex landscapes, Prog. Phys. Geog., 29, 297–316, doi:10.1191/0309133305pp450ra, 2005.
Candela, A., Noto, L. V., and Aronica, G.: Influence of surface roughness in hydrological response of semiarid catchments, J. Hydrol., 313, 119–131, doi:10.1016/j.jhydrol.2005.01.023, 2005.
Caubel-Forget, V., Grimaldi, C., and Rouault, F.: Contrasted dy-namics of nitrate and chloride in groundwater submitted to the influence of a hedge, C. R. Acad. Sci. Paris, 332, 107–113, 2001. Clément, J., Aquilina, L., Bour, O., Plaine, K., Burt, T. P., and Pinay, G.: Hydrological flowpaths and nitrate removal rates within a riparian floodplain along a fourth-order stream in Brittany (France), Hydrol. Process., 17, 1177–1195, 2003.
Cole, J. J., Prairie, Y. T., Caraco, N. F., McDowell, W. H., Tranvik, L. J., Striegl, R. G., Duarte, C. M., Kortelainen, P., Downing, J. A., Middelburg, J. J., and Melack, J.: Plumbing the global carbon cycle: Integrating inland waters into the terrestrial carbon budget, Ecosystems, 10, 171–184, 2007.
Davin, E. L., de Noblet-Ducoudré, N., and Friedlingstein, P.: Im-pact of land cover change on surface climate Relevance of the radiative forci, Geophys. Res. Lett., 34, 1–5, 2007.
Elser, J. and Bennett, E.: Phosphorus cycle: A broken biogeochem-ical cycle, Nature, 478, 29–31, doi:10.1038/478029a, 2011. Ensign, S. H., McMillan, S. K., Thompson, S. P., and Piehler, M. E.:
Nitrogen and phosphorus attenuation within the stream network of a coastal, agricultural watershed, J. Environ. Qual., 35. 1237– 1247, 2006.
Follain, S., Walter, C., Legout, A., Lemercier, B., and Dutin, G.: Induced effects of hedgerow networks on soil organic carbon storage within an agricultural landscape, Geoderma, 142, 80–95, 2007.
Ghazavi, G., Thomas, Z., Hamon, Y., Marie, J. C., Corson, M., and Merot, P.: Hedgerow impacts on soil-water transfer due to rainfall interception and root-water uptake, Hydrol. Process., 22, 4723–4735, doi:10.1002/hyp.7081, 2008.
Grimaldi, C., Thomas, Z., Fossey, M., Fauvel, Y., and Merot, P.: High chloride concentrations in the soil and groundwater under an oak hedge in the West of France: an indicator of evapotranspi-ration and water movement, Hydrol. Process., 23, 1865–1873, 2009.
bottom-land hedgerow in a European farming bottom-landscape, Hydrol. Pro-cess., 26, 3570–3578, doi:10.1002/hyp.8441, 2012.
Groffman, P. M., Altabet, M. A., Bohlke, J. K., Butterbach-Bahl, K., David, M. B., Firestone, M. K., Giblin, A. E., Kana, T. M., Nielsen, L. P., and Voytek, M. A.: Methods for measuring deni-trification: diverse approaches to a difficult problem, Ecol. Appl., 16, 2091–122, 2006.
Gruber, N. and Galloway, J. N.: An Earth-system perspec-tive of the global nitrogen cycle, Nature, 451, 293–296, doi:10.1038/nature06592, 2008.
Hall Jr., R. O., Baker, M. A., Rosi-Marshall, E. J., Tank, J. L., and Newbold, J. D.: Solute-specific scaling of inorganic nitrogen and phosphorus uptake in streams, Biogeosciences, 10, 7323–7331, doi:10.5194/bg-10-7323-2013, 2013.
Hongve, D.: A revised procedure for discharge measurement by means of the salt dilution method, Hydrol. Process., 1, 267–270, 1987.
Inamdar, S., Finger, N., Singh, S., ; Mitchell, M., Levia, D., Bais, H., Scott, D., and McHale, P.: Dissolved organic matter (DOM) concentration and quality in a forested mid-Atlantic watershed, USA, Biogeochemistry, 108, 55–76, doi:10.1007/s10533-011-9572-4, 2012.
Iwagami, S., Tsujimura, M., Onda, Y., Shimada, J., and Tanaka, T.: Role of bedrock groundwater in the rainfallrunoff process in a small headwater catchment underlain by volcanic rock, Hydrol. Process., 24 2771–2783, 2010.
Jeanneau, L., Jaffrezic, A., Pierson-Wickmann, A.-C., Gruau, G., Lambert, T., and Petitjean, P.: Constraints on the Sources and Production Mechanisms of Dissolved Organic Matter in Soils from Molecular Biomarkers, Vadose Zone J., 13, 1539–1663, doi:10.2136/vzj2014.02.0015, 2014.
Jordan, T. E., Correll, D. L., and Weller, D. E.: Relating nutrient dis-charges from watersheds to land use and streamflow variability, Water Resour. Res., 33, 2579–2590, doi:10.1029/97WR02005, 1997.
Kirkby, M., Bracken, L., and Reaney, S.: The influence of land use, soils and topography on the delivery of hillslope runoff to chan-nels in SE Spain, Earth Surf. Proc. Landforms, 27, 1459–1473, doi:10.1002/esp.441, 2002.
Kolbe T., Marçais J., Thomas Z., Abbott B.W., de Dreuzy J.R., Rousseau-Gueutin P., Aquilina L., Labasque, T., and Pinay G.: Dominance of local flows and extended transit times in shallow aquifers, J. Hydrol., in press, 2016.
Lambert, T., Pierson-Wickmann, A.-C., Gruau, G., Jaffrezic, A., Petitjean, P., Thibault, J. N., and Jeanneau, L.: DOC sources and DOC transport pathways in a small headwater catchment as revealed by carbon isotope fluctuation during storm events, Biogeosciences, 11, 3043–3056, doi:10.5194/bg-11-3043-2014, 2014.
Laudon, H., Berggren, M., Agren, A., Buffam, I., Bishop, K., Grabs, T., Jansson, M., and Kohler S.: Patterns and dynamics of dis-solved organic carbon (DOC) in Boreal streams: the role of processes, connectivity, and scaling, Ecosystems, 14, 880–893, doi:10.1007/s10021-011-9452-8, 880-893, 2011.
Lê, S., Josse, J., and Husson, F.: FactoMineR: An R Package for Multivariate Analysis, J. Stat. Softw., 25, 1–18, 2008.
Lefebvre, S., Clément, J.-C., Pinay, G., Thenail, C., Durand, P., and Marmonier, P.: 15n-nitrate signature in low-order streams: effects
of land cover and agricultural practices, Ecol. Appl., 17, 2333– 2346, doi:10.1890/06-1496.1, 2007.
Li, Y., Yang, X., Cai, H., Xiao, L., Xu, X., and Liu, L.: Topograph-ical Characteristics of Agricultural Potential Productivity dur-ing Cropland Transformation in China, Sustainability, 7, 96–110, doi:10.3390/su7010096, 2014.
Mérot, P. and Bruneau, P.: Sensitivity of bocage landscapes to sur-faces run-off: application of the Kirkby index, Hydrol. Process. 7, 167–173, doi:10.1002/hyp.3360070207, 1993.
Meybeck, M. and Moatar, F. Daily variability of river con-centrations and fluxes: indicators based on the segmenta-tion of the rating curve, Hydrol. Process., 26, 1188–207, doi:10.1002/hyp.8211, 2012.
Moatar, F., Meybeck, M., Raymond, S., Birgand, F., and Curie, F.: River flux uncertainties predicted by hydrological variability and riverine material behavior, Hydrol. Process., 27, 3535–46, doi:10.1002/hyp.9464, 2013.
Molenat, J., Gascuel-Odoux, C., Ruiz, L., and Gruau, G.: Role of water table dynamics on stream nitrate export and concentration in agricultural headwater catchment (France), J. Hydrol., 348, 363–378, 2008.
Odgaard, M. V., Bøcher, P. K., Dalgaard, T., Moeslund, J. E., and Svenning, J.-C.: Human-driven topographic effects on the distri-bution of forest in a flat, lowland agricultural region, J. Geogr. Sci., 24, 76–92, doi:10.1007/s11442-014-1074-6, 2013. Omernik, J. M., Abernathy, A. R., and Male, L. M.: Stream nutrient
levels and proximity of agricultural and forest land to streams: Some relationships, J. Soil Water Conserv., 36, 227–231, 1981. Parkin, T. B.: Soil microsites as a source of denitrification
variabil-ity, Soil Sci. Soc. Am. J., 51, 1194–1199, 1987.
Pinay, G., Peiffer, S., De Dreuzy, J. R., Krause, S.,Hannah, D. M.,Fleckenstein, J. H., Sebilo, M., Bishop, K., and Hubert-Moy, L.: Upscaling Nitrogen Removal Capacity from Local Hotspots to Low Stream Orders’ Drainage Basins, Ecosystems, 18, 1101– 1120, 2015.
Ramankutty, N., Evan, A. T., Monfreda, C., and Foley, J. A.: Farm-ing the planet: 1. Geographic distribution of global agricultural lands in the year 2000, Global Biogeochem. Cy., 22, GB1003, doi:10.1029/2007GB002952, 2008.
R Core Team: R: A language and environment for statistical com-puting. R Foundation for Statistical Computing, Vienna, Austria, http://www.R-project.org/ (last access: 22 March 2016), 2014. Rockström, J., Steffen, W., Noone, K., Persson, Å., Chapin, F. S.,
Lambin, E. F., Lenton, T. M., Scheffer, M., Folke, C., Schellnhu-ber, H. J., Nykvist, B., de Wit, C. A., Hughes, T., van der Leeuw, S., Rodhe, H., Sörlin, S., Snyder, P. K., Costanza, R., Svedin, U., Falkenmark, M., Karlberg, L., Corell, R. W., Fabry, V. J., Hansen, J., Walker, B., Liverman, D., Richardson, K., Crutzen, P., and Foley, J. A.: A safe operating space for humanity, Nature, 461, 472–475, doi:10.1038/461472a, 2009.
Rosemond, A. D., Benstead, J. P., Bumpers, P. M., Gulis, V., Komi-noski, J. S., Manning, D. W. P., Suberkropp, K., and Wallace, J. B.: Experimental nutrient additions accelerate terrestrial car-bon loss from stream ecosystems, Science, 347, 1142–1145, doi:10.1126/science.aaa1958, 2015.
Seitzinger, S., Harrison, J. A., Böhlke, J. K., Bouwman, A. F., Lowrance, R., Peterson, B., Tobias, C., and Drecht, G. V.: Denitrification across landscapes and waterscapes: a synthesis, Ecol. Appl., 16, 2064–2090, doi:10.1890/1051-0761(2006)016[2064:DALAWA]2.0.CO;2, 2006.
Sidle, R. C.: Field observations and process understanding in hy-drology: essential components in scaling, Hydrol. Process., 20, 1439–1445, doi:10.1002/hyp.6191, 2006.
Strahler, A. N.: Dynamic basis of geomorphology, Geol. Soc. Am. Bull., 63, 923–938, 1952.
Strayer, D. L., Beighley, R. E., Thompson, L. C., Brooks, S., Nils-son, C., Pinay, G., and Naiman, R. J.: Effects of Land Cover on Stream Ecosystems: Roles of Empirical Models and Scaling Is-sues, Ecosystems, 6, 407–423, doi:10.1007/PL00021506, 2003. Thenail, C., Joannon, A., Capitaine, M., Souchère, V.,
Migno-let, C., Schermann, N., Di Pietro, F., Pons, Y., Gaucherel, C., Viaud, V., and Baudry, J.: The contribution of crop-rotation organization in farms to crop-mosaic patterning at lo-cal landscape slo-cales, Agr. Ecosyst. Environ., 131, 207–219, doi:10.1016/j.agee.2009.01.015, 2009.
Thomas, Z., Molénat, J., Caubel, V., Grimaldi, C., and Mérot, P.: Simulating soil-water movement under a hedgerow surrounding a bottomland reveals the importance of transpiration in water balance, Hydrol. Process., 22, 577–585, doi:10.1002/hyp.6619, 2008.
Thomas, Z., Ghazavi, R., Merot, P., and Granier, A.: Modelling and observation of hedgerow transpiration effect on water balance components at the hillslope scale in Brittany, Hydrol. Process., 26, 4001–4014, doi:10.1002/hyp.9198, 2012.
Tye, A. M., Robinson, D. A., and Lark, R. M.: Grad-ual and anthropogenic soil change for fertility and car-bon on marginal sandy soils, Geoderma, 207, 35–48, doi:10.1016/j.geoderma.2013.05.004, 2013.
Vitousek, P. M., Mooney, H. A., Lubchenco, J., and Melillo, J. M.: Human Domination of Earth’s Ecosystems, Science, 277, 494– 499, doi:10.1126/science.277.5325.494, 1997.
Yang, L., Chang, S. W., Shin, H. S., and Hur, J.: Tracking the evolu-tion of stream DOM source during storm events using end mem-ber mixing analysis based on DOM quality, J. Hydrol., 523, 333– 341, doi:10.1016/j.jhydrol.2015.01.074, 2015.
Yeakley, J. A., Swank, W. T., Swift, L. W., Hornberger, G. M., and Shugart, H. H.: Soil moisture gradients and controls on a southern Appalachian hillslope from drought through recharge, Hydrol. Earth Syst. Sci., 2, 41–49, doi:10.5194/hess-2-41-1998, 1998.