www.biogeosciences.net/13/2123/2016/ doi:10.5194/bg-13-2123-2016
© Author(s) 2016. CC Attribution 3.0 License.
Projecting the release of carbon from permafrost soils using a
perturbed parameter ensemble modelling approach
Andrew H. MacDougall and Reto Knutti
Institute for Atmospheric and Climate Science, ETH Zurich, Zurich, Switzerland Correspondence to: Andrew H. MacDougall ([email protected])
Received: 14 October 2015 – Published in Biogeosciences Discuss.: 10 December 2015 Revised: 26 February 2016 – Accepted: 3 April 2016 – Published: 12 April 2016
Abstract. The soils of the northern hemispheric permafrost region are estimated to contain 1100 to 1500 Pg of carbon. A substantial fraction of this carbon has been frozen and there-fore protected from microbial decay for millennia. As anthro-pogenic climate warming progresses much of this permafrost is expected to thaw. Here we conduct perturbed model exper-iments on a climate model of intermediate complexity, with an improved permafrost carbon module, to estimate with formal uncertainty bounds the release of carbon from per-mafrost soils by the year 2100 and 2300 CE. We estimate that by year 2100 the permafrost region may release between 56 (13 to 118) Pg C under Representative Concentration Path-way (RCP) 2.6 and 102 (27 to 199) Pg C under RCP 8.5, with substantially more to be released under each scenario by the year 2300. Our analysis suggests that the two parameters that contribute most to the uncertainty in the release of carbon from permafrost soils are the size of the non-passive fraction of the permafrost carbon pool and the equilibrium climate sensitivity. A subset of 25 model variants are integrated 8000 years into the future under continued RCP forcing. Under the moderate RCP 4.5 forcing a remnant near-surface per-mafrost region persists in the high Arctic, eventually devel-oping a new permafrost carbon pool. Overall our simulations suggest that the permafrost carbon cycle feedback to climate change will make a significant contribution to climate change over the next centuries and millennia, releasing a quantity of carbon 3 to 54 % of the cumulative anthropogenic total.
1 Introduction
Soils of the northern hemispheric permafrost region are es-timated to contain between 1100 and 1500 Pg C of organic matter (Hugelius et al., 2014), roughly twice the quantity of carbon held in the pre-industrial atmosphere. As anthro-pogenic climate warming progresses, permafrost soils are ex-pected to thaw exposing large quantities of organic matter to microbial decay, releasing CO2 and CH4to the atmosphere (Schuur et al., 2015, 2008). Quantifying the strength and timing of this permafrost carbon cycle feedback to climate change has been a paramount goal of Earth system mod-elling in recent years (Zhuang et al., 2006; Koven et al., 2011; Schaefer et al., 2011; Schneider von Deimling et al., 2012; MacDougall et al., 2012; Burke et al., 2012, 2013; Schaphoff et al., 2013; Schneider von Deimling et al., 2015; Koven et al., 2015). However, large uncertainties in the physical and chemical properties of permafrost soils, as well as the simplified representation of permafrost processes in models, have lead to a large spread in the projected release of carbon from permafrost soils (Schuur et al., 2015, for recent review). These model estimates range from 7 to 508 Pg C released from permafrost soils by year 2100 (Zhuang et al., 2006; MacDougall et al., 2012). New assessments of the size and susceptibility to decay of the permafrost carbon pool have re-cently become available (Hugelius et al., 2014; Schädel et al., 2014). These new studies are the first to formally quantify the uncertainty of permafrost carbon pool metrics based on field measurements and laboratory experiments. These new explicit constraints on uncertainty make it possible to propa-gate these uncertainties through models to place formal con-strains on the release of carbon from permafrost soil.
ex-plore key questions about the effect of the permafrost carbon pool on climate change. The questions we will investigate are as follows. (1) How much carbon will be released from permafrost soils by the years 2100 and 2300, and what are the uncertainty bounds on these estimates? (2) Which of the uncertain parameters identified by Schädel et al. (2014) and Hugelius et al. (2014) contribute the most to uncertainty in the release of carbon from permafrost soils? (3) How much time will pass before the permafrost carbon pool comes into equilibrium with the anthropogenically perturbed climate? The following paragraphs briefly review how uncertainty is treated in the framework of Earth system models and the ex-pected lifetime of anthropogenic climate change.
For the purposes of analyzing incubation experiments and modelling of soil respiration, soil carbon is conventionally conceptualized as a small number of carbon pools each with an characteristic resistance to decay (e.g. Schmidt et al., 2011). A recent analysis of incubation experiments con-ducted with permafrost soils broke the permafrost carbon into a small (>5 %) fast pool with an overturning time on the order of half a year, a moderate-sized slow pool (∼5 to 60 %) with an overturning time on the order of a decade, and a large passive pool with and overturning time estimated at over a century to greater than 2500 years (Schädel et al., 2014). This multi-pool framework will be used to inform the modelling of the release of carbon from permafrost soils pre-sented in this manuscript.
In general there are two sources of uncertainty in mod-elling: structural uncertainty and parameter uncertainty (Smith, 2007). Structural uncertainty arises from the discrep-ancy between the system that the model describes and the system the model is meant to represent in the natural world. Parameter uncertainty arises from uncertainty in the value of a model parameters. This uncertainty can either be a mea-surement uncertainty when the parameter is measurable in the natural world or more difficult to define when the pa-rameter represents an amalgam of many physical phenomena (e.g. Smith, 2007). A third source of uncertainty distinctive to Earth system modelling (but not exclusively so) is sce-nario uncertainty, that is, uncertainty about how emissions of CO2and other radiatively active substances will evolve in the future. This kind of uncertainty is conventionally dealt with by forcing a model with multiple future scenarios (e.g. Moss et al., 2010). Here our experiments will focus on parameter and scenario uncertainty, with a brief intercomparison to sim-ilar experiments with different models to acknowledge struc-tural uncertainty.
There are many methods to propagate uncertainty in model parameters into uncertainty in model outputs (Helton and Davis, 2003). Of commonly used methods only the Monte Carlo method and Latin hypercube sampling method do not require devising a statistical model of a physical model (Hel-ton and Davis, 2003). In the Monte Carlo method uncertain model parameters are selected randomly from their proba-bility distribution functions and randomly paired with other
selected parameter values to form parameter sets (Helton and Davis, 2003). This method is conceptually simple and easy to implement but many thousands of model simulations are needed to comprehensively sample parameter space (e.g. Steinacher et al., 2013). The Latin hypercube method was designed to approximate the Monte Carlo method while us-ing far fewer computational resources (McKay et al., 1979). In the Latin hypercube sampling method each probability distribution function is broken into intervals of equal prob-ability. From each interval one parameter value is selected and matched randomly with other model parameter values selected in the same fashion to form parameter sets. In this method any number of model parameters can be per-turbed without increasing the number of simulations. The number of required simulations is simply the number of equal-probability intervals selected (McKay et al., 1979). The Latin hypercube sampling method has been shown to capture parameter sets of low probability but of high con-sequence, which other sampling methods can miss (McKay et al., 1979). Latin hypercube sampling was originally de-veloped by engineers to assess the safety of nuclear power plants (McKay et al., 1979) but has been used to explore the effect of parameter uncertainty on projections of future cli-mate change (e.g. Forest et al., 2002; Collins et al., 2007; Shiogama et al., 2012).
Anthropogenic climate change will not cease in year 2100 (e.g. Clark et al., 2016) and the intrinsic timescale of decay of the passive component of the permafrost carbon pool implies that the permafrost carbon system will continue to evolve far into the future. Multi-millennial simulations of anthro-pogenic climate change suggest that the temperature change caused by the burning of fossil fuels will last for over 100 000 years (Archer, 2005), a period of time long enough such that the permafrost carbon pool may come into equilibrium with the new climate regime. To explore the long-term fate of the permafrost carbon pool we have extended a sub-selection of model simulations 8000 years into the future.
2 Methods
2.1 Model description
Lotka–Volterra equations (Cox et al., 2001). The simulated plants take up carbon through photosynthesis and distributed acquired carbon to plant growth and autotrophic respiration. Dead carbon is transferred to the soil carbon pool as litter fall and is distributed in the soil as an exponentially decreasing function of depth. Production of plant litter (and therefore new soil carbon) in Triffid is a function of temperature, plant function type, soil water availability, and atmospheric CO2 concentration (Cox et al., 2001; Booth et al., 2012).
The ocean inorganic carbon cycle is simulated following the protocols of the ocean carbon cycle model intercom-parison project (Orr et al., 1999). Dissolved inorganic car-bon is treated as a passive tracer by the model and carried throughout the ocean following ocean circulation (Weaver et al., 2001). Ocean biology is simulated using a nutrient– phytoplankton–zooplankton–detritus ocean biology scheme (Schmittner et al., 2008). The slow feedback between ocean alkalinity and calcite dissolution is simulated using an oxy-gen only representation of respiration of organic matter in sediments (Archer, 1996). The simplified atmospheric scheme makes it possible to alter the equilibrium climate sen-sitivity of the model (Zickfeld et al., 2008). This is accom-plished by altering the outgoing long-wave radiation to space as a function of global average near-surface air temperature anomaly (Zickfeld et al., 2008).
The version of the UVic ESCM used here is based on the frozen ground version documented in Avis et al. (2011) and Avis (2012). This version of the model has a deep subsur-face extending down to 250 m depth and is composed of 14 vertical layers. These layers are of unequal thickness and be-come exponentially thicker with depth. The top eight layers (10 m) are hydraulically active and top six layers (3.35 m) are active in the carbon cycle. In the hydraulically active layers the subsurface porosity and permeability is prescribed based on the sand, silt, clay, and organic matter content of the grid cell. These gridded data are interpolated from the Interna-tional Satellite Land Surface Climate Project Initiative II (Sc-holes and de Colstoun, 2012). The model accounts for the ef-fect of soil valence forces on freezing point and the fraction of frozen and unfrozen water in soil is computed based on equations that minimize Gibbs free energy (Avis, 2012). The thermal conductivity of each soil layer is determined by the sand, silt, clay, water, ice, and organic carbon fraction of the layer (Avis, 2012).
2.1.1 The permafrost carbon module
A permafrost carbon module was added to the UVic ESCM by MacDougall et al. (2012) and described in detail in Mac-Dougall (2014). For the experiments conducted in this study the permafrost carbon module has been overhauled and im-proved. The permafrost carbon pool is now prognostically generated within the model using a diffusion scheme based on that of Koven et al. (2009). This scheme is meant to ap-proximate the process of cryoturbation on the vertical
dis-tribution of soil carbon in permafrost affected soils. The scheme takes the form
∂C ∂t =Kv
∂2Ceff
∂z2 , (1)
whereC is the carbon concentration of the soil layer, t is time,zis the depth,Kvis the diffusion parameter, andCeffis the effective carbon concentration of the layer. The diffusion parameterKvis altered as a function of depth:
Kv=
Kvo, forz < zALT
Kvo
1− z−zALT
(k−1)zALT
, forzALT< z < kzALT
0, forz > kzALT
(2) whereKvois the cryoturbation mixing timescale,zALTis the thickness of the active layer, andkis a constant here taken as 4. The original scheme of Koven et al. (2009) has been mod-ified for use in the UVic ESCM. A drawback of the original scheme is that it uses diminishing rate of diffusion with depth to produce the diminishing concentration of permafrost soil carbon with depth. This implies that the scheme must never be in equilibrium with the surface concentration of carbon to maintain this vertical carbon gradient. When implemented this feature results in the size of the permafrost carbon pool being a function of the length of the model spin-up. From a model-design perspective this is a serious drawback, as (1) this will create a small model drift in atmospheric CO2 concentration, and (2) in general the size of the permafrost carbon pool should not be a function of the time needed for the ocean carbonate chemistry to reach equilibrium.
To fix this deficiency, diffusion is carried out with an ef-fective carbon concentration which is related to the actual carbon concentration by
Ceff(i)= (
C, fori=1
Ceff=S2C , fori >1
(3)
wherei is the layer number, S is the saturation factor, and 2is the volumetric porosity of the layer. In the UVic ESCM the porosity of soil diminishes with depth and is a function of the sand, silt, and clay fraction of the layer. The factorS was required to prevent permafrost soils from accumulating vastly more carbon than the estimated size of the permafrost carbon pool. The factorS can take on values between 0 and 1 and is used to tune the size of the permafrost carbon pool.
scheme allows the properties of the permafrost carbon to be prescribed. Permafrost carbon is also assigned an available fraction, which is effectively the combined fraction of the fast and slow soil carbon pools. When permafrost carbon decays the available fraction is reduced by the appropriate amount. The available fraction is increased as a function of time and soil temperature with a permafrost carbon transformation parameter determining the rate of change. This scheme ef-fectively slowly transforms the passive fraction of the per-mafrost carbon into the slow soil carbon pool where it can be respired to CO2. Described mathematically the scheme is
Rp=κpCpAff2fT, (4)
where Rp is permafrost carbon respiration, κp is the per-mafrost decay rate constant, Cp is the permafrost carbon density, and f2 and fT are respectively moisture- and
temperature-dependent functions. Af changes each time
step:
Atf+1=CpAtf −Rp+(κtfCp(1−Atf)f2fT), (5)
whereκtfis the rate constant for the transformation of carbon in the passive carbon pool into the slow carbon pool. Using this scheme the model can represent the large fraction of per-mafrost carbon that is in the passive carbon pool, while still allowing this passive pool to eventually decay.
2.2 Comparison to data
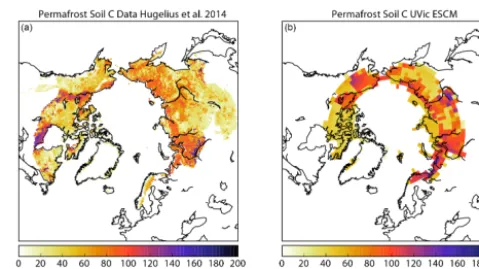
Figure 1 displays maps of the estimated soil carbon density in the top 3 m of soil in the northern hemispheric permafrost region as presented in Hugelius et al. (2014), compared to simulated soil carbon density in the top 3.35 m of the per-mafrost region as simulated by the UVic ESCM (using stan-dard model parameter values). The maps show that the UVic ESCM generally simulates reasonable values for the density of carbon in the permafrost region but with substantial spatial biases. The model has too much carbon in northern fraction of the Fennoscandia peninsula, southern Alaska, and near the Lena River basin. The model does not capture the large mafrost carbon density in the Hudson Bay lowlands and per-mafrost (and therefore perper-mafrost carbon) is absent from the Labrador peninsula, a bias common to many Earth system models (Koven et al., 2013). However, the model is able to capture some of the geographic features of the permafrost carbon pool including the high carbon density in northwest-ern Russia and the low carbon density in the eastnorthwest-ern Cana-dian Arctic and Arctic archipelago.
[image:4.612.309.549.64.198.2]The saturation factor from Eq. (3) was used to tune the total amount of carbon in the permafrost region such that in the default version of the model it matches the total from Hugelius et al. (2014) very closely. Therefore, in year 1995 the simulated permafrost region has 1035 Pg C in the top
Figure 1. Comparison of the estimated soil carbon density in the
top 3 m of soil in the northern hemispheric permafrost region from Hugelius et al. (2014) and soil carbon density in the top 3.35 m of soil in the permafrost region of the UVic ESCM. The permafrost region in the UVic ESCM is defined as the area where the model simulates at least one soil layer that is perennially frozen at the be-ginning of the model integration in year 1850. The model is able to capture the correct global total of soil carbon though tuning but with significant spatial biases.
3.35 m, equal to the best estimate for the carbon in the top 3 m of permafrost soil provided by Hugelius et al. (2014). Carbon held in perennially frozen soil layers makes up 49 % of the carbon in the permafrost region in the UVic ESCM. This metric, which was not tuned, is very close to the esti-mate of∼50 % provided by Hugelius et al. (2014).
2.3 Experiment design
We have chosen to perturb four parameters that describe the permafrost carbon pool: (1) the quantity of soil carbon in the top 3 m of soil in the permafrost region, taken from Hugelius et al. (2014); (2) the permafrost decay rate constantκp, com-puted from mean residence time of the slow permafrost soil carbon pool from Schädel et al. (2014); (3) the available frac-tion of permafrost carbon computed from the combined size of the fast and slow soil carbon pools in measured permafrost soils samples from Schädel et al. (2014); and (4) the pas-sive pool transformation rateκtf, estimated from Trumbore (2000). We also perturb two physical climate parameters: the climate sensitivity and the arctic amplification factor.
The quantity of carbon in permafrost soils is controlled by changing the saturation factorS presented in Eq. (3). Cali-bration simulations were conducted with the UVic ESCM to derive a functional relationship betweenSand the quantity of carbon in permafrost soils. The probability distribution func-tion (PDF) for the permafrost carbon quantity (in the top 3 m of soil) was taken as a normal distribution with a mean of 1035 Pg C and a standard deviation of 75 Pg C, taken from Hugelius et al. (2014). The permafrost carbon decay rate is derived from the mean residence time of the slow carbon pool in permafrost soils. The permafrost decay rate is taken to be normally distributed with a mean of 7.45 years and a stan-dard deviation of 2.67 years, with values taken from Schädel et al. (2014). Schädel et al. (2014) reports the size of the fast, slow, and passive pool of soil organic carbon separately for organic, shallow mineral (<1 m), and deep mineral (>1 m) soils. Here these three categories of permafrost carbon have been combined to produce a single value for the available fraction. The sum of three weighted gamma distributions with each distribution respectively describing the PDF of the organic, shallow mineral, and deep mineral soils are used to describe the available fraction. The weights for the PDFs were derived from the relative fraction of permafrost soil car-bon in organic, shallow mineral, and deep mineral soils from Hugelius et al. (2014). The parameter values for the PDFs were derived by fitting gamma functions to the data in Fig. 3 of Schädel et al. (2014). The passive pool transformation rate is very poorly constrained as the incubation experiments an-alyzed by Schädel et al. (2014) were unable to constrain the parameter’s value (the contribution from the passive carbon pool was too small to be detected). The value of the param-eter was estimated from the14C age of the passive carbon pool from midlatitude soils (Trumbore, 2000). The mean res-idence time at 5◦C was estimated at 300 to 5000 years with a best guess of 1250 years yielding a passive pool transforma-tion rate of 0.25×10⁻¹⁰to 4×10⁻¹⁰s−1, with a best guess of 1×10⁻¹⁰s−1. The PDF was taken as uniform in base-two log space.
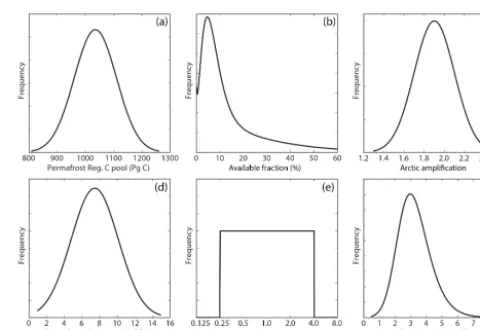
Arctic amplification can be changed in the UVic ESCM by changing the meridional diffusivity of the simplified atmo-spheric model (Fyke et al., 2014; Fyke, 2011). Here the Arc-tic amplification factor was taken to be normally distribution with a mean of 1.9 and standard deviation of 0.2 (Serreze and Barry, 2011). Many studies have attempted to derive a PDF of equilibrium climate sensitivity (Collins et al., 2013, for recent summary) from model-based, observational, and paleoclimate evidence. Here we chose to use a PDF that cap-tures the general feacap-tures of these distributions with a mean of 3.25◦C for doubling of CO2 and the 5th and 95th per-centile 1.7 and 5.2 ◦C respectively (Olson et al., 2012). The PDFs for all six perturbed parameters are shown in Fig. 2.
[image:5.612.308.548.63.228.2]The Latin hypercube sampling, described in the introduc-tion, was used to create the parameter sets. Each PDF was sampled from 25 equal-probability intervals and the value selected from each interval was randomly matched to one
Figure 2. Probability distribution functions of the six parameters
perturbed in this study. Panel (b) is the sum of three weighted gamma functions (one each for organic soil, shallow, and deep min-eral soil). Panel (e) has a logarithmic scale. MRT is mean residence time.
of the values selected from each of the other PDFs to cre-ate a “cube” containing 25 parameter sets. This sampling was repeated 10 times to create 10 cubes for a total of 250 model variants. Each of these variants was spun up for 5000 years under estimated year 1850 forcing to generate the per-mafrost carbon pool. Each model variant was forced with historical forcing followed by each of the four representative concentration pathways (RCPs) used in the fifth assessment report of the Intergovernmental Panel on Climate Change (IPCC AR5). The simulations were carried out with pre-scribed atmospheric CO2concentrations and compatible an-thropogenic CO2emissions were diagnosed as a residual of the carbon cycle.
The old permafrost carbon capable version of the UVic ESCM was able to quantify the previously unaccounted for temperature effect of the permafrost carbon feedback by comparing model simulations with and without permafrost carbon (MacDougall et al., 2012). This has become much more difficult with the introduction of the permafrost car-bon pool diffusion module. The soil carcar-bon diffusion scheme causes the active layer to accumulate more soil carbon than in the model version without a prognostically generated per-mafrost soil carbon pool. Consequently we can no longer eas-ily “turn off” the permafrost carbon. Therefore we have cho-sen to conduct experiments which quantify the permafrost carbon feedback in terms of carbon released from permafrost affected soils. As carbon released from permafrost soil dis-places fossil fuel carbon in the carbon budget (MacDougall et al., 2015), we feel this is the most policy-relevant metric.
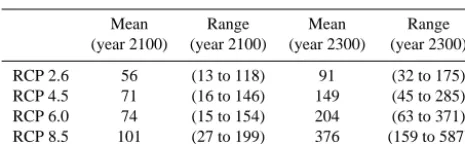
Table 1. Release of carbon from permafrost soils by year 2100 and
2300 for each RCP scenario. Ranges are 5th to 95th percentiles. All values are in Pg C.
Mean Range Mean Range (year 2100) (year 2100) (year 2300) (year 2300) RCP 2.6 56 (13 to 118) 91 (32 to 175) RCP 4.5 71 (16 to 146) 149 (45 to 285) RCP 6.0 74 (15 to 154) 204 (63 to 371) RCP 8.5 101 (27 to 199) 376 (159 to 587)
For each scenario the models were forced with prescribed atmospheric CO2 concentration until peak CO2 concentra-tion was reached (year 2150 for RCP 4.5 and year 2250 for RCP 8.5). Thereafter the simulated CO2emissions were set to 0 and atmospheric CO2was allowed to freely evolve. All other RCP forcings follow their prescribed trajectory until year 2300 and subsequently are held constant. The simula-tions were continued until the year 10 000 of the common era, 8000 years into the future. Expecting non-CO2forcings to be constant for thousands of years following year 2300 is highly idealized, but this method was seen as the simplest approach for evaluating the long-term response of the per-mafrost carbon pool to anthropogenic forcing.
3 Results
3.1 Release of carbon to 2300
The release of carbon from permafrost soils for each RCP and for each of the 250 model variants is shown in Fig. 3. Average values and ranges for this quantity are given for all RCPs in Table 1. Model results in this section are quoted as the mean value of all model variants with the 5th and 95th percentile range in brackets. This is equivalent to the “very likely” range from IPCC AR5, although the numbers here are of course conditional on the model structure and parameter PDFs chosen. By year 2100 the model estimates that 56 (13 to 118) Pg C will be released under RCP 2.6 and 102 (27 to 199) Pg C released under RCP 8.5. By year 2300 the model estimates that 91 (32 to 175) Pg C will be released under RCP 2.6 and 376 (159 to 587) Pg C released under RCP 8.5. These results are generally consistent with the inter-model range of 37 to 174 Pg C, mean of 92 Pg C, by year 2100 under RCP 8.5 from Schuur et al. (2015).
[image:6.612.360.495.109.174.2]The emission rate of CO2from permafrost soils is shown in Fig. 4 and peak emissions for each RCP given in Table 2. Peak emissions under RCP 2.6 is 0.56 (0.13 to 1.29) and un-der RCP 8.5 is 1.05 (0.28 to 2.36) Pg C a−1. The timing of peak emissions of CO2from permafrost soils varies by model variant and scenario followed (Fig. 4) but generally occurs in the mid- to late 21st century or early 22nd century in the case of RCP 6.0. The emission rate from permafrost soils is a function of both the rate of permafrost thaw and the depletion
Table 2. Peak emission rate of carbon from permafrost soils for
each RCP scenario. Ranges are 5th to 95th percentiles. All values are in Pg C a−1.
Mean Range
RCP 2.6 0.56 (0.13 to 1.29) RCP 4.5 0.66 (0.16 to 1.57) RCP 6.0 0.75 (0.19 to 1.59) RCP 8.5 1.05 (0.28 to 2.36)
of the available fraction of permafrost carbon in thawed soils. The similar trajectories of emissions in the early to mid-21st century for the different RCP scenarios is consistent with the lag between forcing and response of the permafrost system. These simulated peak emission rates are of similar magni-tude to modern land use change emissions, 0.9±0.8 Pg C a−1averaged over the year 2000 to 2011 period (Ciais et al., 2013). Even in the most extreme bound emissions from per-mafrost carbon are projected to be far lower than modern CO2emissions from fossil fuel burning and cement produc-tion (9.5±0.8 Pg C a−1in 2011; Ciais et al., 2013).
The permafrost carbon feedback’s effect on climate change will ultimately be determined by how large the re-lease of carbon from permafrost soils is relative to the cumu-lative fossil fuel emissions (MacDougall and Friedlingstein, 2015). This notion follows from the near-linear relationship between cumulative emissions of CO2and change in global temperature (Matthews et al., 2009; Gillett et al., 2013), a re-lationship that emerges from the interaction of atmospheric and oceanic processes with the land surface source or sink ef-fectively acting in the same manner as fossil fuel emissions (MacDougall and Friedlingstein, 2015). The release of car-bon from permafrost soils relative to the diagnosed cumu-lative emissions for each model variant and RCP scenarios is shown in Fig. 5. The relative emissions are highest under RCP 2.6 where emissions from permafrost soil are 13 (2 to 39) % of fossil fuel emissions in 2100 and 21 (5 to 54) % of fossil fuel emissions by 2300. Under RCP 8.5 carbon re-leased from permafrost soils is only 2 (0.5 to 5) % of fossil fuel emissions in 2100 and 8 (3 to 14) % of fossil fuel emis-sion by 2300. RCPs 4.5 and 6.0 fall between these bounds with 7 (1 to 16) and 4 (1 to 10) % respectively by 2100 and 14 (3 to 29) and 12 (3 to 24) % respectively by 2300. These results suggest the permafrost carbon feedback to climate change will be more important in a relative sense to the mag-nitude of climate change in scenarios with substantial mitiga-tion, consistent with previous studies (e.g. MacDougall et al., 2012).
3.2 Reduction in permafrost area
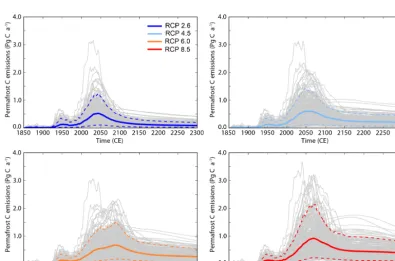
Figure 3. Release of carbon from the permafrost region for all 250 model variants (grey lines) and four RCP scenarios. Mean for each
scenario shown with think solid line. Fifth and 95th percentiles shown with dashed lines.
Figure 4. Emission of carbon from permafrost soils for each model variant (grey lines) and each RCP scenario. Mean for each scenario
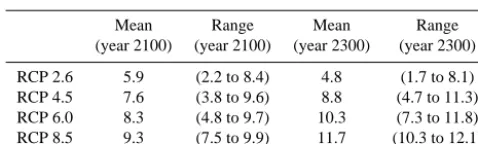
[image:7.612.99.494.413.674.2]Table 3. Reduction in the size of the northern hemispheric
per-mafrost region by year 2100 and 2300 relative to year 1850 (14.9 million km2). Ranges are 5th to 95th percentiles. All values are in million of km2.
Mean Range Mean Range (year 2100) (year 2100) (year 2300) (year 2300) RCP 2.6 5.9 (2.2 to 8.4) 4.8 (1.7 to 8.1) RCP 4.5 7.6 (3.8 to 9.6) 8.8 (4.7 to 11.3) RCP 6.0 8.3 (4.8 to 9.7) 10.3 (7.3 to 11.8) RCP 8.5 9.3 (7.5 to 9.9) 11.7 (10.3 to 12.1)
and discontinuous permafrost area in the natural world (e.g. Tarnocai et al., 2009). By year 2100 the northern hemispheric permafrost area has been reduced by 5.91 (2.25 to 8.43) mil-lion km2under RCP 2.6 and 9.30 (7.49 to 9.90) million km2 under RCP 8.5. By 2300 a small recovery of permafrost area occurs under RCP 2.6 with a net reduction from year 1850 of 4.78 (1.71 to 8.13) million km2, while the loss of permafrost area continues until at least year 2300 under the other RCPs (Table 3).
3.3 Parameter uncertainty
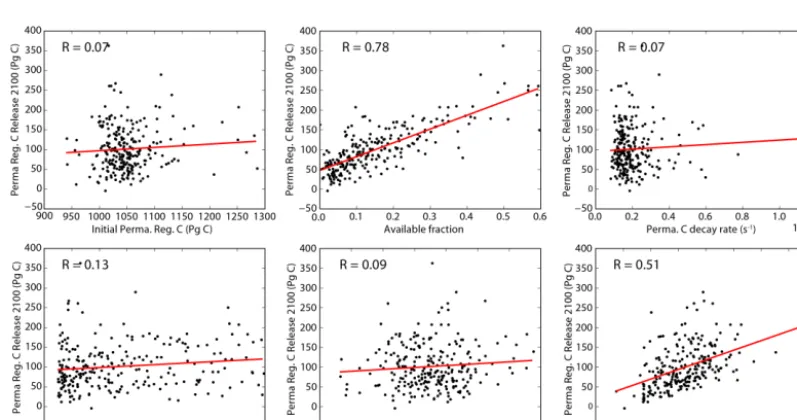
The relative importance of uncertainty from each perturbed model parameter to the overall uncertainty can be evaluated by computing the correlation coefficient between the param-eter value and the value of some model output (e.g Shiogama et al., 2012). In Fig. 6 the correlation between each of the six perturbed model parameters and release of carbon from permafrost soils under RCP 8.5 by 2100 is shown. This par-ticular metric was chosen as it has become the benchmark to compare simulations of the permafrost carbon feedback (e.g. Schuur et al., 2015). The two highest correlations are for the initial available fraction with an R value of 0.78 and climate sensitivity with an R value of 0.51. Correlations for the other perturbed parameters are less that 0.13. These cor-relations suggest that reducing the uncertainty in the release of carbon from permafrost soils by 2100 requires better quan-tification of the size of the fast and slow carbon pools in per-mafrost soils. Also important is reducing the uncertainty in climate sensitivity, already a paramount, if intractable, prob-lem in climate science (e.g. Collins et al., 2013; Knutti and Hegerl, 2008). The four other perturbed parameters are rela-tively unimportant for reducing uncertainty to year 2100.
Correlations were also conducted between each model perturbed parameter value and release of carbon from per-mafrost soils by 2300. By 2300 the importance of the ini-tial available fraction has decreased and has an R value of 0.36, the correlation with permafrost carbon transformation rate has increased to an R value of 0.43, and the correlation with climate sensitivity has increased to 0.64. The correla-tions with initial quantity of carbon in the permafrost region, permafrost carbon decay rate, and arctic amplification re-main weak by year 2300, at 0.13, 0.02, and 0.11 respectively.
These results demonstrate that the relative importance of un-certainty in parameters changes depending on the time frame of interest.
The low sensitivity of the release of carbon from per-mafrost soils to the value of Arctic amplification appears counterintuitive. However, most of the carbon held in the permafrost region is held in the region’s southern extent (Fig. 1b), while Arctic amplification has the greatest effect over the Arctic ocean, Greenland ice sheet, and Canadian Arctic Archipelago where there is little simulated permafrost carbon.
Overall these results are encouraging as the most impor-tant factor for determining release of carbon from permafrost soils in the next century, the size of the permafrost carbon fast and slow pools, can be measured with incubation experi-ments (e.g. Schädel et al., 2014). A dedicated field campaign and set of laboratory experiments to collect samples of per-mafrost carbon in optimal locations and conduct incubation experiments at the optimal temperatures could therefore sig-nificantly reduce uncertainty in the strength of the permafrost carbon feedback to climate change.
3.4 Temperature sensitivity of permafrost carbon release
Climate change mitigation targets are often framed in terms of some global temperature change threshold not to be breached (e.g. Knutti and Rogelj, 2015). Therefore examin-ing the relationship between global temperate change and the release of carbon from permafrost soils is of interest. Figure 7 shows the correlation between change in global temperature and the release of carbon from the permafrost soils for all model variants and RCPs at years 2100, 2200, and 2300. The figure shows that there is a clear correlation between the two quantities at all three time horizons. However, the slope of the correlation evolves in time from 24 in 2100 to 39 in 2200 and 47 Pg C K−1in 2300. These correlations demonstrate a key feature of the permafrost carbon system: the long time lag between forcing and response. That is, if fossil fuel emis-sions are eliminated and global temperature stabilizes, per-mafrost soils are expected to continue to release carbon for a long time.
3.5 Multi-millennial experiment
there-Figure 5. Cumulative emissions from permafrost soils relative to diagnosed compatible emissions for each model variant (grey lines) and
[image:9.612.97.497.63.328.2]each RCP scenario. Mean for each scenario shown with think solid line. Fifth and 95th percentiles shown with dashed lines. Note that under scenarios with lower emissions permafrost carbon emissions are larger relative to fossil fuel emissions.
Figure 6. Correlation between release of carbon from the permafrost region in year 2100 under RCP 8.5 and value of perturbed model
parameters. Red line is line of best fit and R is correlation coefficient.
after. Under continued RCP 8.5 forcing atmospheric CO2 de-clines monotonically after cessation of emissions, reaching a concentration below 1600 ppm by year 10 000 CE. Tem-perature continues to slowly increase following cessation of emissions, indicating that radiative forcing from atmospheric CO2 is declining to slowly to compensate for the
[image:9.612.98.497.384.594.2]Figure 7. Correlation between release of carbon from the permafrost region and change in global temperature at years 2100, 2200, and
[image:10.612.47.287.265.423.2]2300 CE. Red line is line of best fit andais the slope of this line.
Figure 8. Evolution of CO2 and surface air temperature (SAT) anomaly under continued RCPs 4.5 and 8.5 forcing until common era year 10 000 (8000 years into the future). Vertical black line in-dicates change in horizontal scale.
who showed larger declines in temperature and atmospheric CO2 for comparable cumulative emissions and time frame. The continued existence of non-CO2forcing in these scenar-ios and the inclusion of the permafrost carbon module are probable causes of the differences between that study and the present study, as both studies use similar versions of the UVic ESCM.
The response of the permafrost carbon pool to millennia of anthropogenically enhanced temperatures varies by sce-nario followed. Under RCP 8.5 the pool monotonically de-clines with time, with the rate of decline varying by param-eter set (Fig. 9). By the year 10 000 CE most of the model variants asymptote toward a carbon pool of about 10 Pg C, held around the fringes of Antarctica. Under RCP 4.5 the permafrost carbon pool begins a recovery before the year 3000 CE (Fig. 9), with permafrost soil carbon reaching a nadir in the year 2411 (2254 to 2605) CE. Some of the pa-rameter sets show renewed reduction in permafrost carbon
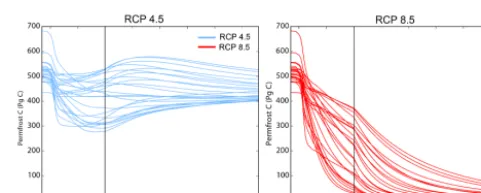
Figure 9. Evolution of permafrost soil carbon pool under continued
RCPs 4.5 and 8.5 forcing until common era year 10 000 (8000 years into the future). Vertical black line indicates change in horizontal scale. Under RCP 4.5 forcing the permafrost carbon pool undergoes a recovery in the late third millennium and under RCP 8.5 forcing declines toward a near-zero value.
about 2000 years after the recovery begins. The origin of this recovery, despite continued elevated global temperatures, is the creation of a large permafrost carbon pool in the Cana-dian Arctic archipelago and the high Russian Arctic as shown in Fig. 10. This region is thought to contain very little soil carbon in the modern climate (see Fig. 1), a feature of the system that is captured by the model (Fig. 1b). Under RCP 4.5 these regions accumulate large permafrost carbon pools as they remain permafrost bound but with much higher net primary productivity from overlying vegetation. The simula-tions suggest that the ultimate fate of the permafrost carbon pool is highly contingent on scenario followed.
4 Discussion
[image:10.612.308.549.267.363.2]ver-sions of the UVic ESCM is the treatment of the passive soil carbon fraction of the permafrost carbon pool. The recent analysis of Schädel et al. (2014) showed that the passive pool makes up a larger fraction of permafrost carbon than the few studies available in 2011 had suggested when the simulations of MacDougall et al. (2012) were performed. Incorporating these new data into the model has reduced the estimated re-leased of carbon from permafrost soils by year 2100 by about half.
The study most similar to the present study is that of Schneider von Deimling et al. (2015), which used a complex box model of the permafrost carbon system to conduct per-turbed model ensemble simulations. That study estimated the release of carbon from thawed permafrost soil only and does not compute the release of carbon from the historic active layer. Schneider von Deimling et al. (2015) estimate that un-der RCP 2.6 36 (20 to 58, 68 % range) Pg C will be released by 2100. The comparable 68 % range from the experiments conducted with the UVic ESCM (accounting only for release of permafrost carbon and not for carbon released from the historic active layer) is 46 (19 to 75, 68 % range) Pg C by 2100. Under RCP 8.5 Schneider von Deimling et al. (2015) estimated that 87 (42 to 141, 68 % range) Pg C would be re-leased from thawed permafrost by 2100 compared to 75 (31 to 120, 68 % range) Pg C in the UVic ESCM. The study of Schneider von Deimling et al. (2015) and the present study use radically different modelling structures but converge on very similar estimates of the release of carbon from per-mafrost soil. This suggests that parameter uncertainty domi-nates the uncertainty in projecting the release of carbon from permafrost soils and that a perturbed parameter approach can successfully capture the uncertainty in this model compo-nent. The inter-model range from a recent review paper on the permafrost carbon feedback (Schuur et al., 2015) was 92 (37 to 174) Pg C under RCP 8.5, which compares favourably to the 90 % range in the present study of 102 (27 to 199) Pg C. Overall it appears that modelling studies of release of carbon from permafrost soils are converging toward a common esti-mate of the strength of the feedback.
There are many processes that affect the thaw of per-mafrost and decay of perper-mafrost carbon that are not ac-counted for in the UVic ESCM. The UVic ESCM has per-mafrost carbon only in the top 3.35 m of soil and there-fore does not account for the substantial quantity of car-bon held below 3 m in deltaic deposits 91±52 Pg C and the Yedoma region 181±54 Pg C (Hugelius et al., 2014). Other modelling studies suggest that the contribution from these deep soil deposits will be small in the coming centuries (e.g. Schneider von Deimling et al., 2015) but this pool of car-bon would likely affect the results of our multi-millennial experiments. The UVic ESCM accounts for only two of the four mechanisms of permafrost thaw – active-layer thicken-ing and talik formation – and does not simulate thermokarst development or soil erosion. The UVic ESCM does not sim-ulate the production of methane from thawed soils. As
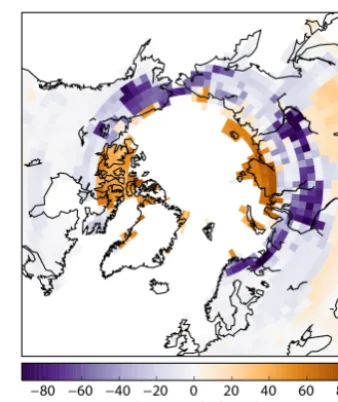
warm-Figure 10. Difference between soil carbon density in the Northern
Hemisphere between 1875 and 5250 CE under continued RCP 4.5 forcing. A large permafrost carbon pool has developed in the high arctic by year 5250.
ing from methane is proportional to the rate of emissions and not cumulative emissions (e.g. Pierrehumbert, 2014), it is unlikely that plausible rates of emission of methane from thawed permafrost soils will contribute cataclysmically to climate change (e.g. Schuur et al., 2015). The global dynamic vegetation scheme used by the UVic ESCM does not account for the effect of nutrient limitations on plant growth. The de-cay of organic matter in permafrost soils releases nutrients into the soils which presumably should enhance plant growth (e.g. Schuur et al., 2008), representing an unaccounted for negative feedback. We have not quantified all of the parame-ter uncertainty that could affect the simulated permafrost car-bon system. In particular the parameters in Triffid that control net primary productivity will determine the flow of organic carbon into soils and therefore the net release of carbon from permafrost soils. Transport of permafrost carbon from soils to surface waters as dissolved organic carbon (DOC) is a pro-cess that is unaccounted for in the UVic ESCM. Field studies in Arctic regions suggest that once DOC is transported to the surface and exposed to sunlight much of the DOC can be mineralized to CO2, potentially providing a pathway to de-grade otherwise passive permafrost carbon (e.g. Cory et al., 2013, 2014).
[image:11.612.343.512.64.265.2]for assessing the strength of the permafrost carbon cycle feedback. That these mechanisms remain poorly understood represents perhaps the greatest uncertainty in assessing the permafrost carbon feedback.
5 Conclusions
Here we have used a perturbed physic ensemble to place an uncertainty constraint on the release of carbon from per-mafrost soils. We find that by 2100 the perper-mafrost region may release 56 (13 to 118) Pg C under RCP 2.6, 71 (16 to 146) Pg C under RCP 4.5, 74 (15 to 154) Pg C under RCP 6.0, and 102 (27 to 199) Pg C under RCP 8.5, with substan-tially more to be released under each scenario by 2300. Of the six parameters perturbed the simulations are most sensi-tive in year 2100 to uncertainty in the size of the non-passive soil carbon pools and the equilibrium climate sensitivity. Ad-ditionally, by 2300 the transformation rate of the passive pool into carbon susceptible to decayed has become important. The simulations are insensitive to uncertainty in Arctic am-plification, slow carbon pool overturning time, and the initial quality of carbon in the permafrost region. Our results sug-gest that a well-designed field campaign and set of incubation experiments intended to better constrain the size of the fast and slow carbon pools in permafrost soils could substantially reduced the uncertainty in the strength of the permafrost car-bon cycle feedback. Contingent on our model structure being reflective of the natural world.
We have also projected a subset of a model variants 8000 years into the future, with simulations conducted to the year 10 000 CE under continued RCP 4.5 and 8.5 forcing. These simulations suggest that if permafrost survives in the high arctic, a new permafrost carbon pool may develop leading to a recovery of this carbon pool. Under higher forcing where near-surface permafrost ceases to exist outside Antarctica, the permafrost carbon pool nearly totally decays away over several thousand years. Overall our simulations suggest that the permafrost carbon cycle feedback to climate change will make a substantial contribution to climate change over the next centuries and millennia.
Acknowledgements. We are indebted to the efforts of the Per-mafrost Carbon Network for organizing the collection of data on permafrost carbon quantity and quality. G. Hugelius graciously provided the data for the map in Fig. 1. In particular we thank C. Schädel for providing additional data on the quality of per-mafrost carbon. We thank two anonymous reviewers for their helpful comments.
Edited by: T. Laurila
References
Archer, D.: A data-driven model of the global calcite lysocline, Global Biogeochem. Cy., 10, 511–526, 1996.
Archer, D.: Fate of fossil fuel CO2in geologic time, J. Geophys. Res., 110, C09S05, doi:10.1029/2004JC002625, 2005.
Avis, C. A.: Simulating the present-day and future distribution of permafrost in the UVic Earth system climate model, PhD. thesis, University of Victoria, 2012.
Avis, C. A., Weaver, A. J., and Meissner, K. J.: Reduction in areal extent of high–latitude wetlands in response to permafrost thaw, Nat. Geosci., 4, 444–448, doi:10.1038/ngeo1160, 2011. Booth, B. B., Jones, C. D., Collins, M., Totterdell, I. J., Cox, P. M.,
Sitch, S., Huntingford, C., Betts, R. A., Harris, G. R., and Lloyd, J.: High sensitivity of future global warming to land carbon cy-cle processes, Environ. Res. Lett., 7, 024002, doi:10.1088/1748-9326/7/2/024002, 2012.
Burke, E. J., Hartley, I. P., and Jones, C. D.: Uncertainties in the global temperature change caused by carbon release from per-mafrost thawing, The Cryosphere, 6, 1063–1076, doi:10.5194/tc-6-1063-2012, 2012.
Burke, E. J., Jones, C. D., and Koven, C. D.: Estimating the permafrost-carbon climate response in the CMIP5 climate mod-els using a simplified approach, J. Climate, 26, 4897–4909, 2013. Ciais, P., Sabine, C., Bala, G., Bopp, L., Brovkin, V., Canadell, J., Chhabra, A., DeFries, R., Galloway, J., Heimann, M., Jones, C., Quéé, C. L., Myneni, R. B., Piao, S., and Thornton, P.: Carbon and Other Biogeochemical Cycles, in: Working Group I Contri-bution to the Intergovernmental Panel on Climate Change Fifth Assessment Report Climate Change 2013: The Physical Science Basis, edited by: Stocker, T. F., Qin, D., Plattner, G.-K., Tignor, M., Allen, S. K., Boschung, J., Nauels, A., Xia, Y., Bex, V., and Midgley, P., Cambridge University Press, 2013.
Clark, P. U., Shakun, J. D., Marcott, S. A., Mix, A. C., Eby, M., Kulp, S., Levermann, A., Milne, G. A., Pfister, P. L., Santer, B. D., Schrag, D. P., Solomon, S., Stocker, T. F., Strauss, B. H., Weaver, A. J., Winkelmann, R., Archer, D., Bard, E., Goldner, A., Lambeck, K., Pierrehumbert, R. T., and Plattner, G.: Con-sequences of twenty-first-century policy for multi-millennial cli-mate and sea-level change, Nature Clicli-mate Change, 6, 360–369, doi:10.1038/NCLIMATE2923, 2016.
Collins, M., Brierley, C., MacVean, M., Booth, B., and Harris, G.: The sensitivity of the rate of transient climate change to ocean physics perturbations, J. Climate, 20, 2315–2320, 2007. Collins, M., Knutti, R., Arblaster, J. M., Dufresne, J.-L., Fichefet,
T., Friedlingstein, P., Gao Jr., X., W. J. G., Johns, T., Krinner, G., Shongwe, M., Tebaldi, C., Weaver, A. J., and Wehner, M.: Long-term Climate Change: Projections, Commitments and Ir-reversibility, in: Working Group I Contribution to the Intergov-ernmental Panel on Climate Change Fifth Assessment Report Climate Change 2013: The Physical Science Basis, Cambridge University Press, 2013.
Cory, R. M., Crump, B. C., Dobkowski, J. A., and Kling, G. W.: Surface exposure to sunlight stimulates CO2 release from per-mafrost soil carbon in the Arctic, P. Natl. Acad. Sci. USA, 110, 3429–3434, 2013.
Cox, P. M., Betts, R. A., Jones, C. D., Spall, S. A., and Totterdell, I. J.: Modelling vegetation and the carbon cycle as interactive elements of the climate system, Proceedings of the RMS millen-nium conference, 2001.
Eby, M., Zickfeld, K., Montenegro, A., Archer, D., Meissner, K. J., and Weaver, A. J.: Lifetime of Anthropogenic Climate Change: Millennial Time Scales of Potential CO2 and Sur-face Temperature Perturbations, J. Climate, 22, 2501–2511, doi:10.1175/2008JCLI2554.1, 2009.
Forest, C. E., Stone, P. H., Sokolov, A. P., Allen, M. R., and Web-ster, M. D.: Quantifying uncertainties in climate system proper-ties with the use of recent climate observations, Science, 295, 113–117, 2002.
Frölicher, T. L., Sarmiento, J. L., Paynter, D. J., Dunne, J. P., Krast-ing, J. P., and Winton, M.: Dominance of the Southern Ocean in anthropogenic carbon and heat uptake in CMIP5 models, J. Climate, 28, 862–886, 2014.
Fyke, J., Eby, M., Mackintosh, A., and Weaver, A.: Impact of cli-mate sensitivity and polar amplification on projections of Green-land Ice Sheet loss, Clim. Dynam., 43, 2249–2260, 2014. Fyke, J. G.: Simulation of the global coupled climate/ice sheet
sys-tem over millennial timescales, PhD thesis, Victoria University of Wellington, 2011.
Gillett, N. P., Arora, V. K., Matthews, D., and Allen, M. R.: Con-straining the ratio of global warming to cumulative CO2 emis-sions using CMIP5 simulations, J. Climate, 26, 6844–6858, 2013.
Helton, J. C. and Davis, F. J.: Latin hypercube sampling and the propagation of uncertainty in analyses of complex systems, Re-liab. Eng. Syst. Safe. 81, 23–69, 2003.
Hugelius, G., Strauss, J., Zubrzycki, S., Harden, J. W., Schuur, E. A. G., Ping, C.-L., Schirrmeister, L., Grosse, G., Michaelson, G. J., Koven, C. D., O’Donnell, J. A., Elberling, B., Mishra, U., Camill, P., Yu, Z., Palmtag, J., and Kuhry, P.: Estimated stocks of circumpolar permafrost carbon with quantified uncertainty ranges and identified data gaps, Biogeosciences, 11, 6573–6593, doi:10.5194/bg-11-6573-2014, 2014.
Knutti, R. and Hegerl, G. C.: The equilibrium sensitivity of the Earth’s temperature to radiation changes, Nat. Geosci., 1, 735– 743, 2008.
Knutti, R. and Rogelj, J.: The legacy of our CO2emissions: a clash of scientific facts, politics and ethics, Climatic Change, 133, 361– 373, 2015.
Koven, C., Friedlingstein, P., Ciais, P., Khvorostyanov, D., Krinner, G., and Tarnocai, C.: On the formation of high-latitude soil car-bon stocks: Effects of cryoturbation and insulation by organic matter in a land surface model, Geophys. Res. Lett., 36, L21501, doi:10.1029/2009GL040150, 2009.
Koven, C. D., Ringeval, B., Friedlingstein, P., Ciais, P., Cadule, P., Khvorostyanov, D., Krinner, G., and Tarnocai, C.: Permafrost carbon–climate feedbacks accelerate global warming, P. Natl. Acad. Sci. USA, 108, 14769–14774, doi:10.1073/pnas.1103910108, 2011.
Koven, C. D., Riley, W. J., and Stern, A.: Analysis of permafrost thermal dynamics and response to climate change in the CMIP5 Earth System Models, J. Climate, 26, 1877–1900, 2013. Koven, C. D., Schuur, E. A. G., Schädel, C.,Bohn, T. J., Burke,
E. J., Chen, G., Chen, X., Ciais, P., Grosse, G., Harden, J. W., Hayes, D. J., Hugelius, G., Jafarov, E. E., Krinner, G., Kuhry,
P., Lawrence, D. M., MacDougall, A. H., Marchenko, S. S., McGuire, A. D., Natali, S. M., Nicolsky, D. J., Olefeldt, D., Peng, S., Romanovsky, V. E., Schaefer, K. M., Strauss, J., Treat, C. C., and Turetsky, M.: A simplified, data-constrained approach to estimate the permafrost carbon–climate feedback, Philos. T. R. Soc. A, 373, 20140423, doi:10.1098/rsta.2014.0423, 2015. MacDougall, A.: A modelling study of the permafrost carbon
feed-back to climate change: feedfeed-back strength, timing, and carbon cycle consequences, PhD thesis, University of Victoria, 2014. MacDougall, A. H. and Friedlingstein, P.: The origin and
lim-its of the near proportionality between climate warming and cumulative CO2 emissions, J. Climate, 28, 4217–4230, doi:10.1175/JCLI-D-14-00036.1, 2015.
MacDougall, A. H., Avis, C. A., and Weaver, A. J.: Significant ex-isting commitment to warming from the permafrost carbon feed-back, Nat. Geosci., 5, 719–721, doi:10.1038/NGEO1573, 2012. MacDougall, A. H., Eby, M., and Weaver, A. J.: If anthropogenic
CO2emissions cease, will atmospheric CO2concentration con-tinue to increase?, J. Climate, 26, 9563–9576, doi:10.1175/JCLI-D-12-00751.1, 2013.
MacDougall, A. H., Zickfeld, K., Knutti, R., and Matthews, H. D.: Sensitivity of carbon budgets to permafrost carbon feed-backs and non-CO2 forcings, Environ. Res. Lett., 10, 125003, doi:10.1088/1748-9326/10/12/125003, 2015.
Matthews, H. D., Gillett, N. P., Stott, P. A., and Zickfeld, K.: The proportionality of global warming to cumulative carbon emis-sions, Nature, 459, 829–832, doi:10.1038/nature08047, 2009. McKay, M. D., Beckman, R. J., and Conover, W. J.: Comparison of
three methods for selecting values of input variables in the analy-sis of output from a computer code, Technometrics, 21, 239–245, 1979.
Moss, R. H., Edmonds, J. A., Hibbard, K. A., Manning, M. R., Rose, S. K., van Vuuren, D. P., Carter, T. R., Emori, S., Kainuma, M., Kram, T., Meehl, G. A., Mitchell, J. F. B., Nakicenovic, N., Ri-ahi, K., Smith, S. J., Stouffer, R. J., Thomson, A. M., Weyant, J. P., and Wilbanks, T. J.: The next generation of scenarios for climate change research and assessment, Nature, 463, 747–754, doi:10.1038/nature08823, 2010.
Olson, R., Sriver, R., Goes, M., Urban, N. M., Matthews, H. D., Haran, M., and Keller, K.: A climate sensitivity estimate using Bayesian fusion of instrumental observations and an Earth System model, J. Geophys. Res.-Atmos., 117, D04103, doi:10.1029/2011JD016620,, 2012.
Orr, J., Najjar, R., Sabine, C., and Joos, F.: Abiotic-how-to, internal OCMIP report, LSCE/CEA Saclay, 1999.
Pierrehumbert, R.: Short-lived climate pollution, Annu. Rev. Earth Planet. Sci., 42, 341–379, 2014.
Schädel, C., Schuur, E. A., Bracho, R., Elberling, B., Knoblauch, C., Lee, H., Luo, Y., Shaver, G. R., and Turetsky, M. R.: Circum-polar assessment of permafrost C quality and its vulnerability over time using long-term incubation data, Glob. Change Biol., 20, 641–652, 2014.
Schaefer, K., Zhang, T., Bruhwiler, L., and Barrett, A. P.: Amount and timing of permafrost carbon release in response to climate warming, Tellus, 63B, 165–180, doi:10.1111/j.1600-0889.2011.00527.x, 2011.
car-bon budget, Environ. Res. Lett., 8, 014026, doi:10.1088/1748-9326/8/1/014026, 2013.
Schmidt, M. W. I.,d Torn, M. S., Abiven, S., Dittmar, T., and Guggenberger, G., Janssens, I. A., Kleber, M., Kögel-Knabner, I., Lehmann, J., Manning, D. A. C., Paolo, N., Rasse, D. P., Weiner, S., Trumbore, S. E.: Persistence of soil organic matter as an ecosystem property, Nature, 478, 49–56, 2011.
Schmittner, A., Oschlies, A., Matthews, H. D., , and Galbraith, E. D.: Future changes in climate, ocean circulation, ecosystems, and biogeochemical cycling simulated for a business-as-usual CO2emission scenario until year 4000 AD, Global Biogeochem. Cy., 22, GB1013, doi:10.1029/2007GB002953, 2008.
Schneider von Deimling, T., Meinshausen, M., Levermann, A., Hu-ber, V., Frieler, K., Lawrence, D. M., and Brovkin, V.: Estimating the near-surface permafrost-carbon feedback on global warming, Biogeosciences, 9, 649–665, doi:10.5194/bg-9-649-2012, 2012. Schneider von Deimling, T., Grosse, G., Strauss, J., Schirrmeister, L., Morgenstern, A., Schaphoff, S., Meinshausen, M., and Boike, J.: Observation-based modelling of permafrost carbon fluxes with accounting for deep carbon deposits and thermokarst ac-tivity, Biogeosciences, 12, 3469–3488, doi:10.5194/bg-12-3469-2015, 2015.
Scholes, R. and de Colstoun, E. B.: ISLSCP II Global gridded soil characteristics, available at: http://www.daac.ornl.gov, last ac-cess: 2 May 2012.
Schuur, E., McGuire, A., Schädel, C., Grosse, G., Harden, J., Hayes, D., Hugelius, G., Koven, C., Kuhry, P., Lawrence, D., Natali, S. M., Olefeldt, D., Romanovsky, V. E., Schaefer, K., Turetsky, M. R., Treat, C. C., and Vonk, J. E.: Climate change and the per-mafrost carbon feedback, Nature, 520, 171–179, 2015.
Schuur, E. A. G., Bockheim, J., Canadell, J. G., Euskirchen, E., Field, C. B., Goryachkin, S. V., Hagemann, S., Kuhry, P., Lafleur, P. M., Lee, H., Mazhitova, G., Nelson, F. E., Rinke, A., Ro-manovsky, V. E., Shiklomanov, N., Tarnocai, C., Venevsky, S., Vogel, J. G., and Zimov, S. A.: Vulnerability of Permafrost Car-bon to Climate Change: Implications for the Global CarCar-bon Cy-cle, BioScience, 58, 701–714, 2008.
Serreze, M. C. and Barry, R. G.: Processes and impacts of Arctic amplification: A research synthesis, Global Planet. Change, 77, 85–96, 2011.
Shiogama, H., Watanabe, M., Yoshimori, M., Yokohata, T., Ogura, T., Annan, J. D., Hargreaves, J. C., Abe, M., Kamae, Y., O’ishi, R., Rei, N., Seita, E., Toru, N., Ayako, A.-O., and Masahide, K.: Perturbed physics ensemble using the MIROC5 coupled atmosphere–ocean GCM without flux corrections: experimental design and results, Clim. Dynam., 39, 3041–3056, 2012. Smith, L.: Chaos: a very short introduction, Oxford University
Press, 2007.
Steinacher, M., Joos, F., and Stocker, T. F.: Allowable carbon emis-sions lowered by multiple climate targets, Nature, 499, 197–201, 2013.
Tarnocai, C., Canadell, J. G., Schuur, E. A. G., Kuhry, P., Mazhi-tova, G., , and Zimov, S.: Soil organic carbon pools in the north-ern circumpolar permafrost region, Global Biogeochem. Cy., 23, GB2023, doi:10.1029/2008GB003327, 2009.
Trumbore, S.: Age of soil organic matter and soil respiration: radio-carbon constraints on belowground C dynamics, Ecol. Appl., 10, 399–411, 2000.
Weaver, A. J., Eby, M., Wiebe, E. C., and P. B. Duffy, C. M. B., Ewen, T. L., Fanning, A. F., Holland, M. M., MacFadyen, A., Matthews, H. D., Meissner, K. J., Saenko, O., Schmittner, A., Wang, H., and Yoshimori, M.: The UVic Earth System Climate Model: Model description, climatology, and applications to past, present and future climates, Atmosphere-Ocean, 39, 1–67, 2001. Zhuang, Q., Melillo, J. M., Sarofim, M. C., Kicklighter, D. W., McGuire, D., Felzer, B. S., Sokolov, A., Prinn, R. G., Steudler, P. A., and Hu, S.: CO2 and CH4 exchanges between land ecosystems and the atmosphere in northern high latitudes over the 21st century, Geophys. Res. Lett., 33, L17403, doi:10.1029/2006GL026972, 2006.