Diplomarbeit
Implementation of Hull-White’s No-Arbitrage
Term Structure Model
eingereicht von
Eugen V. Puschkarski
zur Erlangung des Grades
Magister rerum socialium oeconomicarumque
Sozial- und Wirtschaftswissenschaftliche Fakultät
der Universität Wien
Studienrichtung: Internationale Betriebswirtschaft
eingereicht bei
o.Univ.-Prof. Dr. Josef Zechner
Eidesstattliche Erklärung
Ich erkläre hiermit an Eides Statt, daß die vorliegende Arbeit selbständig und ohne
Benutzung anderer als der angegebenen Hilfsmittel angefertigt habe. Die aus
fremden Quellen direkt oder indirekt übernommenen Gedanken sind als solche
kenntlich gemacht.
Die Arbeit wurde bisher in gleicher oder ähnlicher Form keiner anderen
Prüfungsbehörde vorgelegt und auch noch nicht veröffentlicht.
Wien, am 20.5.1998
Contents
GLOSSARY OF NOTATION iv
1 INTRODUCTION 1
2 SOME PRELIMINARIES 1
3 OVERVIEW OF INTEREST RATE MODELS 4
3.1 Equilibrium Term Structure Models 5
3.1.1 Rendleman and Bartter 5
3.1.2 Vasicek 5
3.1.3 Cox, Ingersoll and Ross 8
3.1.4 Two Factor Models 9
3.1.5 Three-Factor Models 10
3.2 No-Arbitrage Term Structure Models 10
3.2.1 Ho and Lee 11
3.2.2 Hull and White 11
3.2.3 Heath, Jarrow, and Morton 13
3.2.4 Matching the volatility term structure of interest rates 14
4 A TREE-BUILDING PROCEDURE FOR IMPLEMENTING ONE-FACTOR TERM
STRUCTURE MODELS 15
5 APPLICATIONS 22
5.1 Discount bond options 22
5.1.1 Analytical solution 23
5.1.2 Numerical solution 23
5.1.3 Convergence Analysis 26
5.1.4 Testing computation time 28
5.1.5 American style options 29
5.2 Coupon bond options 30
5.3 Floaters 31
5.4 Caps, Floors, Collars 32
5.5 Swaptions 34
5.6 Accrual Swaps 35
5.7 Callable, Putable Bonds 36
7.1 Parallel shifts 43
7.2 Twists 46
7.3 Bucket shifts 47
7.4 Shift of volatility parameters 47
8 CONCLUDING REMARKS 49
9 APPENDIX A 49
9.1 Linear Interpolation 49
9.2 Price of a discount bond at time zero given the initial term structure 50
9.3 Function B() and A() as required by the Hull-White model 50
9.4 Probabilities in a Hull-White interest rate tree 50
9.5 Transformation of a dt interest rate in its continuous counterpart 52
9.6 Calculation of a zero rate given the short rate 52
10 APPENDIX B 52
10.1 Analytical valuation of a European discount bond option 52
10.2 Numerical valuation of discount bond options using state prices 53
11 APPENDIX C 58
11.1 Newton-Raphson algorithm 58
11.2 Valuation of Coupon bond option 58
12 APPENDIX D 59
12.1 Calculation of a non-standard floater 59
13 APPENDIX E 65
13.1 Newton Raphson Algorithm for Swaption 65
13.2 Numerical calculation of a Swaption 65
14 APPENDIX F 71
14.1 Calculation of binary options 71
Glossary of Notation
a: Reversion rate of interest rate process
B(⋅): Value of a money market account
c: Price of European call option
C: Coupon payment
d: Proportional down movement in a binomial model
dr: Discrete change of the short rate
dt: Discrete change in time
E(⋅): Expected value of a variable
f: Price of an interest rate derivative
jmax: Maximum number of up branches
jmin: -jmax
k: Tenor of reference rate
L: Face value of a bond, swap...
m: Instantaneous drift
N: Number of time steps
O(i,j): Option value at time step i and state j
p: Probability of an up movement in a binomial model
P(t,τ): Value of a discount bond at time t with maturity τ face value 1
Ps: State price, Arrow-debreu price in a binomial model
pu: Up-branching probability in Hull-White model
pm: Middle-branching probability in Hull-White model
pd: Down-branching probability in Hull-White model
Q: State price in Hull-White tree
r: Risk-free rate, short rate
r: Average short rate
R(t,τ): Spot rate at time t with maturity τ
RcX: Strike rate of a derivative
s,σ: Maturity of a bond, instantaneous standard deviation of the
short rate
z: Wiener process or Call/Put indicator
∆: Delta of a derivative
Γ: Gamma of a derivative
λ: Market price of risk of r
1 Introduction
As the number of interest rate derivatives has increased in a dramatic way over the
last decade, models describing the way interest rates can evolve have become vital
for pricing and hedging them. In the subsequent thesis we will show how to
implement the Hull-White term structure model to price and calculate hedge
parameters for different interest rate derivatives.
First we will present some preliminary definitions and show theoretical relations
between them. Then a broad overview of term structure models is given discussing
the individual advantages and disadvantages. This overview should help the reader
in understanding the possibilities and limitations of the Hull-White model.
Then the tree building procedure for the numerical solution of the Hull-White model is
presented and applied in several pricing procedures. Emphasize has been put on
presenting how to price exotic derivatives and modified standard instruments.
Additionally the convergence behavior of the numerical solution is analyzed.
Moreover it will be demonstrated how to calibrate the model to market data and how
to calculate several hedge parameters.
Finally some concluding remarks summarize the situation at the time of writing.
2 Some preliminaries
In the subsequent analysis several specific terms will be necessary to use and will be
presented in this section.1
risk-neutral pricing we will denote the value of a discount bond at time t with maturity
τ and face value 1 by P(t, τ). We assume that the price of this bond can either move
up by u to
P t( +1, , )τ u = P t( , )τ u (1a)
or down by d to
P t( +1, , )τ d = P t( , )τ d (1b)
Additionally we assume we can also invest in a money market account B(t,τ) which
grows at a risk-free rate r to B(t+1,τ) with probability 1.
To rule out arbitrage we have to make sure that no combination of an investment in
B(t,τ) and P(t,τ) dominates each other. This no-arbitrage requirement, which is at the
heart of all valuation models, is in our small example equal to
u> >r d (3)
this inequality implies that there exists a unique, strictly positive number less than 1,
which we will denote p, so that
r = pu+ −(1 p d) (4a)
or
p r d
u d = −
As a result p can be interpreted as a probability measure which is also called
risk-neutral probability since all investments offer the same expected return namely the
risk-free rate r to an investor who is neutral to risk and faces the probability p.
In order to show the implications for risk-neutral pricing we will transform (4) to
P t pP t u
r p
P t d
r
( , )τ = ( +1, , )τ + −(1 ) ( +1, , )τ (5)
by multiplying with P(t,τ), dividing by r and using (1).
From expression (5) follows that we can value the bond P(t,τ) simply by taking the
expectation of the discounted future bond price or equivalently to discount the
expected future value by the risk-free rate.
If we divide (5) by B(t,τ), realizing that r=B(t+1,τ)/B(t,τ) and taking the expectation
under the risk-neutral probability p to get
P t
B t E
P t B t ( , )
( , )
( , ) ( , ) τ
τ
τ τ = ++
1
1 (6)
we see that P(t,τ)/B(t,τ) follows a martingale because its expected future value
equals its current value. That is why p is also called equivalent martingale measure
or pseudo probability.
The valuation technique outlined above will be used in the following chapters and is
only possible to perform if certain assumptions are made.
1. The market is frictionless in view of no taxes or transaction costs.
2. All securities are perfectly divisible.
The third assumption is necessary to assure no-arbitrage and to be able to find a
unique price for each contingent claim either by replicating that claim with a
combination of other claims or by risk-neutral pricing.
To complete our discussion of risk-neutral pricing in a discrete time- discrete state
framework it is interesting to put risk-neutral probabilities in another relation namely
to state prices or Arrow-Debreu prices.
A state price is the current value of a security which pays 1 unit in a certain state and
0 in all other possible states, therefore it can be regarded as the most basic
contingent claim. It is obvious that almost any contingent claim can be decomposed
into several state prices.
If we consider (5) with P(t,τ) substituted by a state price Ps(t,τ) then Ps(t+1,τ,u)=1 and
Ps(t+1,τ,d)=0 which gives
r p t
Ps(,τ)= (7)
and shows that a state price is the discounted risk-neutral probability. A more
rigorous proof is presented in Duffie (1996).
3 Overview of Interest Rate Models
Term Structure Models have been constructed in three different ways in the last
decades. Either by assuming (modeling) a stochastic process for discount bond
prices, instantaneous forward rates or the internal rate of return of a discount bond
with infinitesimally short period of time to maturity called the short rate r.
r t( )=lim ( , )R t
→
In the most general form a stochastic model for the short rate can be described by an
Ito process
dr=m r t dt( , ) +s r t dz( , ) (9)
where m denotes the instantaneous drift, s the instantaneous standard deviation and
z follows a Wiener process. By specifying different drifts and standard deviations
several term structure models have emerged.
3.1 Equilibrium Term Structure Models
In the seventies and early eighties numerous papers have been introduced with the
aim to build a model which can produce the term structure of interest rates as an
output given some assumptions about how an overall economic equilibrium is
achieved.
3.1.1 Rendleman and Bartter
One of the most basic models has been introduced by Rendleman and Bartter (1980)
which builds on Cox, Ross and Rubinstein’s binomial representation of a stock price
following geometric Brownian motion. Similar to stocks, Rendleman and Bartter
specify the process for the short rate in (9) with
dr=mrdt+srdz (10)
The only advantages of this model is that it does not allow negative interest rates and
is easy to implement. On the other hand it has some serious drawbacks which will
become apparent as we study its competitors.
In his 1977 paper Vasicek built the theoretical background for interest rate derivatives
valuation. He assumes that the short rate follows a Markov process and that the
bond price P at time t with maturity τ is determined by the short rate process in this
time interval.
P t( , )τ = E e−r(τ−t)
−
(11)
r
−
is the average of the short rate in the time interval τ-t. Since the price of the bond is
only dependent on one stochastic variable r these kind of models are called one
factor models.
Now that P is only dependent on one variable we can proceed in the usual fashion in
valuing derivative securities.2
By applying Itos Lemma, Vasicek derives the differential equation for any discount
bond P as
(
)
∂ ∂
∂
∂ λ
∂ ∂ P
t r P
r m s s r
P
r rP
+ + +1 =
2 2 2
2
2 (12)
where λ is called the market price of risk of r and is assumed to be constant and
equal to
λ= µσ−r (13)
with µ and σ as the expected return and volatility of P. Equation (12) can be solved
subject to the boundary condition P(τ,τ)=1 like Black and Scholes (1973) did for
stocks.
R t
t P t ( , )τ ln ( , )
τ τ
= − − 1
(14)
if we regard R(t,τ) as the continuously compounded interest rate at time t for the time
interval τ-t.
Additionally Vasicek proposed a certain specification for m and s in (9)
dr=a b( −r dt) +sdz (15)
where a, b and s are constants. This specification for the short rate forces it to revert
to its long-run mean b at rate a. This is called mean reversion and has become a
popular feature in several term structure models because there is evidence that
interest rates behave in a similar way in the real world.
By solving (12) with regard to (15) and subject to the boundary condition given
above, Vasicek presents the price of a discount bond as3
λ = µ σ − r (16)
where
( )
( )B t T e
a
a T t
, = −
− −
1
(17)
and
( )
A t T B t T T t a b s
a
s B t T a , =exp( ( , )− + )( − / )− ( , )
2 2
2
2 2
2
which gives in conjunction with (14) the entire term structure. One drawback of this
model is that the short rate is normally distributed so that negative interest rates can
occur even though by mean reversion the probability for negative rates should be
small.
3.1.3 Cox, Ingersoll and Ross
Cox, Ingersoll and Ross developed an intertemporal general equilibrium asset pricing
model in assuming stochastic production functions in that model economy and other
stochastic factors influencing the equilibrium interest rate.
In a second paper Cox, Ingersoll and Ross specify only one factor determining the
interest rates namely the short rate which follows
dr=a b( −r dt) +s r dz (19)
which is similar to Vasicek’s specification with the exception that the volatility of r is
proportional to r which prevents r to become negative as everytime r gets close to
zero the decreasing volatility narrows the bounds r can fluctuate in. Additionally the
model incorporates mean reversion.
Given the process in (19) Cox, Ingersoll and Ross derive closed form solutions for
bond prices similar to (16) but with different A and B functions.
It is interesting to note that Cox, Ingersoll and Ross’ approach differs from Vasicek’s
in the way that they start their analysis by giving a general valuation formula
contingent on the driving factors which follow stochastic processes. One special case
of this model is if we only choose the short rate as one factor. Vasicek on the other
hand starts by modeling this short rate process and values bond as simple
3.1.4 Two Factor Models
To give equilibrium models more flexibility one factor interest rate models have been
extended by introducing a second factor which determines the term structure. This
factor allows the term structure not only to shift up and down but also twist.
3.1.4.1 Brennan and Schwartz
Brennan and Schwartz (1982) define the second factor to be the long rate l, which is
the yield of a perpetual discount bond and which follows a stochastic process.
dr=(a1+b l1( −r dt)) +σ1rdz (20a)
ldw dt
l c r b a l
dl= ( 2 + 2 + 2 ) +σ2 (20b)
where dwdz= ρdt. σ1 and σ2 are the standard deviations of the short rate and long
rate, respectively, and ρ is the correlation coefficient of the two rates.
3.1.4.2 Longstaff and Schwartz
Longstaff and Schwartz, on the other hand, use the general equilibrium framework of
Cox, Ingersoll and Ross and extend it by assuming two independent unspecified
state variables (factors) which follow stochastic processes of the form
dx=a bx( x−x dt) +σx x dzx (21a)
dy=a by( y − y dt) +σy y dzy (21b)
Both factors are assumed to affect the mean of the instantaneous rate of return of the
production process in the model economy, but only the second factor is assumed to
Using the fundamental partial differential equation for interest rate contingent claims
dependent on two factors developed by Cox, Ingersoll and Ross it is possible to
determine the short rate r and its instantaneous variance V as part of the equilibrium
r= +x y (22a)
V =σx2x+σy2y (22b)
Now it is possible to change variables and express the valuation equation in terms of
the new and observable variables r and V.
3.1.5 Three-Factor Models
In recent years researchers have come up with some yield-based term structure
models which specify three factors driving the future term structure.4 These factors
are assumed to follow stochastic processes which can take on different forms. For
example these factors can be
dr=κ θ( −r dt) + V dz (23a)
dθ α β θ= ( − )dt+ηdw (23b)
dV =a b V dt( − ) +φ V dy (23c)
where r is the short rate, θ denotes the long run mean of r and V is the variance of
the short rate. This set of factors are designed to give the term structure evolution
more flexibility in that it allows not only for parallel shifts like One-Factor Term
Structure Models, but also for twists and not perfectly correlated bond prices. This
advantage comes at the price of higher computational demands and theoretical
sophistication.
Unlike equilibrium term structure models which take the different stochastic factors as
an input and give the term structure (and implicitly bond prices) as an output,
no-arbitrage term structure models take the initial term structure as an input by using
time-varying parameters. This procedure of adjusting parameters so that the initial
term structure is exactly matched is generally called calibrating.
3.2.1 Ho and Lee
Ho and Lee (1986) model the discrete evolution of bond prices by specifying
perturbation functions. Since there is a relation between bond prices and interest
rates it has been shown that the continuous time version of the Ho and Lee model
can be represented by a model of the short rate5
dr=θ( )t dt+σdz (24a)
with time varying mean of dr
θ( )t =Ft( , )0 t +σ2t (24b)
where Ft(0,t) denotes the partial derivative of the initial instantaneous forward rate
with respect to t.
Because r(t) is Markov which is equivalent to a constant volatility of forward rates6,
the short rate r can be represented by a recombining binomial tree so that the
sequence of up and down movements is irrelevant. Additionally the Ho and Lee
model incorporates no mean reversion but is still a major breakthrough in term
structure modeling using all the information in the observable initial term structure by
matching it exactly.
In 1990 Hull and White developed a series of term structure models which can be
regarded as extensions of such established models like Ho and Lee or Vasicek
proposed. It is inasmuch an extension of Ho and Lee as it allows mean reversion and
of Vasicek as it is a no-arbitrage model. The version which will be treated in this
paper is
( )
(
)
dr= θ t −ar dt+σdz (25)
where θ
( )
t is chosen to match the current term structure of interest rates. This modelhas the advantage over other similar models that it incorporates mean reversion and
is analytically tractable. At any time t the short rate r reverts to θ
( )
t a at rate a. It iseasy to see that when a=0 the Hull and White model reduces to the Ho and Lee
model. Because of its analytic tractability θ(t) can be expressed by
θ( )t F( , )t aF( , )t σ ( )
a e
t
at
= 0 + 0 + − −
2 1 2
2
(26)
Hull and White show that bond prices can be calculated at any time t from
( ) ( )
( ) ( )P t T, =A t T e, −B t T r t, (27a) where
( )
( )B t T e
a
a T t
, = −
− −
1
(27b)
and
( )
( )
( )
( )
( )
(
) (
)
ln , ln ,
, ,
ln ,
A t T P T
P t B t T
P t
t a e e e
aT at at
= 0 − − − − − −
0
0 1
4 3 1
2 2 2
∂
∂ σ (27c)
This has been a short introduction to the Hull-White model and in the subsequent
3.2.3 Heath, Jarrow, and Morton
Heath, Jarrow, and Morton built a term structure model of a general type by modeling
the instantaneous forward rate. They showed in their 1992 paper that there exists a
link between the drift and standard deviation of this instantaneous forward rate, so
that it is sufficient to know the standard deviations to construct a term structure
model. Their general result can be summarized by7
dF t T m t T dt s t T dzk k k
( , )= ( , ) +
∑
( , ) (28)allowing for k factors to influence the instantaneous forward rate F(t,T). The link
between drift m(t,T) and standard deviations sk(t,T) is given by
m t T s t Tk s t T d
k
k t
T
( , )=
∑
( , )∫
( , ) τ (29)One specific version of (28) with two factors has become known as the Heath,
Jarrow, and Morton model
dF t T( , )=m t T dt( , ) +σ1( , ) ( , )t T F t T dz1+σ2( , ) ( , )t T F t T dz2 (30)
which is a lognormal model and allows for parallel shifts and twists in the term
structure. On the other hand equation (28) does generally not allow to be
represented in a recombining tree as the forward rate and therefore the short rate are
non-Markov. Only by restricting the volatility of bond prices not to be stochastic
Markov models for the short rate can be constructed.
Since the Ho and Lee model assumes a bond price volatility of
and Hull and White of
[
]
v t T
a e
a T t
( , )=σ − − ( −)
1 (32)
with σ as the standard deviation of the change in the short rate, these models can be
constructed by a recombining tree. This is a strong advantage as it is computationally
easier and faster to implement a recombining tree than a path-dependent tree which
requires in most cases the use of Monte Carlo simulation.
3.2.4 Matching the volatility term structure of interest rates
With the no-arbitrage term structure models presented so far it is only possible to
match the term structure of interest rates but not the term structure of interest rate
volatilities which often can be observed in the market.
For this reason additionally to θ(t) in a process for the short rate like in (25) other
time-varying parameters have been added to the short rate process in order to give it
enough degrees of freedom to match also the term structure of volatilities exactly.
Unfortunately introducing more time-dependent parameters has the drawback that
the resulting future volatility term structure is often quite different from the initially
observed one. At least two popular models which have the feature of matching the
volatility term structure of interest rates are presented below.
3.2.4.1 Black, Derman, and Toy
In 1990 Black, Derman, and Toy introduced an interest rate model which can not only
match the initial term structure of interest rates but also of interest rate volatilities.
They use a binomial tree with constant local probabilities (pu=pd=0.5) and time steps
to match the twofold term structure by a trial and error procedure. Obviously this
forward induction or the analytic approximation tree building procedure of Bjerksund
and Stensland (1996) are to be preferred.
It can be shown that the continuous process of the short rate is
( )
( )
( )( )
d r t
t r dt t dz
t t
ln = + ln
+ θ
σ σ
∂σ ∂
(33)
where the speed of mean reversion
( )
( )
∂σ∂
σ
t t
t and the short rate volatility σ
( )
t aretime-dependent. Short rates are lognormally distributed.
3.2.4.2 Black and Karasinski
Black and Karasinski (1991) provide a more general model by making the speed of
mean reversion independent of the volatility of interest rates but preserving its
time-dependent feature. They present the implementation of their model by a similar
procedure to Black, Derman, and Toy’s with the difference that they use time steps of
varying lengths. The continuous lognormal process for the short rate which they
suggest is
( )
( )
[
]
( )
dlnr= θ t −φ t lnr dt+σ t dz (35)
This process involves three different time-varying parameters giving the model
enough degrees of freedom to match the given term structures. Also note that (35) is
the lognormal Hull-White model of (25) with a time dependent a and σ.
structure models by numerical approximations. This is the case if we have to deal
with path-dependency or more complex payoff functions like in exotic options.
Therefore we will present in this section a tree-building procedure which is
computationally effective for one -factor term structure models. We will show explicitly
how to use it for the White model. This procedure was first presented by
Hull-White in 1994a and is a more efficient version of a similar procedure presented in
1993a.
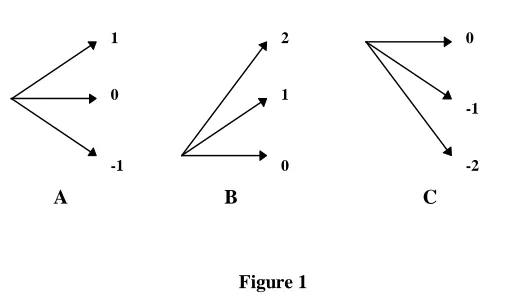
The procedure starts by assuming that the short rate r changes over a time period ∆t
by k∆r where k is a positive or negative integer. Hull and White choose to represent
the evolution of r by a trinomial tree because it gives the model enough freedom to
match the expected value and variance of ∆r. By defining k to take values between -2
and 2 tree branching can be of any form shown in Figure 1
B C
A
0 1
-1
1 2
0
-1
[image:23.595.161.415.406.554.2]-2 0
Figure 1
Branching of type B and C is added to standard branching of type A to facilitate
implementing the mean reversion feature of the Hull-White model.
The procedure outlined here consists of two steps: First an auxiliary tree for the
process
is constructed and in a second stage a certain α is calculated to match the given
initial term structure.
The process in (34) determines dr to be normally distributed since dz is as usual a
Wiener process. To calculate the probabilities of each branch in the tree we consider
to match the expected change and variance in r over a time interval ∆t. Additionally
the probabilities must also sum to unity which gives us three equations in the three
probabilities pu, pm and pd where the subscript indicates the highest, middle and
lowest branch of a node.
Since the time step ∆t and the interest rate step ∆r can be chosen discretionary it is
now possible to construct a trinomial tree. However Hull-White suggest to choose ∆r
to be
∆r= 3V (35)
with V indicating the variance of (34) which equals
[ ]
(
)
Var dr V e
a
a t
= = σ − −
2 2
1 2
∆
(36)
in order to minimize errors in numerical procedures.
If we denote Mr to be the expected change in r which equals
[ ]
(
)
E dr = Mr= e− ∆a t −1r (36)
the branching probabilities at node (i,j) indicating the position in the time
p j M jM
p j M
p j M jM
u
m
d
= + +
= −
= + −
1
6 2
2 3 1
6 2
2 2
2 2
2 2
for type B by
p j M jM
p j M jM
p j M jM
u
m
d
= + −
= − − +
= + −
1
6 2
1
3 2
7 6
3 2 2 2
2 2
2 2
and for type C by
p j M jM
p j M jM
p j M jM
u
m
d
= + +
= − − −
= + +
7 6
3 2 1
3 2
1
6 2
2 2
2 2
2 2
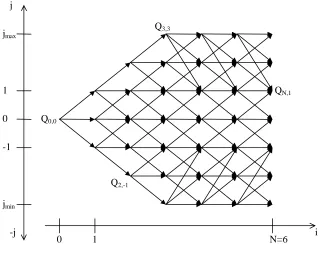
Additionally if a>0 it is necessary to choose a maximum and minimum level for j
which we will denote jmax and jmin to prevent the probabilities to become negative. It
can be shown that jmax has to be chosen to be an integer between 0.184/M and
-0.816/M, and jmin respectively to be an integer between 0.184/M and 0.816/M. Hull
and White recommend to set jmax equal to the smallest integer greater than -0.184/M
and jmin equal to -jmax. Figure 2 depicts the notation in this trinomial tree and its
j
i -j
-1 jmax
1
0 0
jmin
1 N=6
Q0,0
Q2,-1
QN,1
[image:26.595.143.464.87.347.2]Q3,3
Figure 2
Now that the initial tree is built, it is necessary to displace the nodes at time i∆t by αi
which is calculated to produce bond prices consistent with the initial term structure.
( ) ( )
( )
α t =r t −rinit t (37)
rinit stands for the interest rate which follows the process in (34) and which has been
determined at each node using r=j∆r. Now it is possible for the Hull-White model to
calculate α
( )
t analytically( )
( )
(
)
α t F t σ
a e
at
= + − −
0
2 1 2
2
2
, (38)
However as this analytic solution gives correct bond prices only in the limit as ∆t
approaches zero, an iterative procedure using forward induction8 is necessary to
To illustrate how forward induction works let’s suppose Qi,j is a state price like
introduced in a previous section. This means Qi,j is the present value of a security
which pays 1 unit if node (i,j) is reached and zero in all other states. It follows that
Q0,0 is 1. We can calculate α0 by applying (37) and noting that rinit=j∆r. Therefore α0 is
set equal to the initial ∆t period rate. Now we have to use α0 to calculate Q1,1, Q1,0,
and Q1,-1. Since we know the interest rate and the probabilities for the first period we
simply apply risk neutral pricing in multiplying each state price with its probability and
discount at the risk free rate.
Q p e
Q p e
Q p e
u r t m r t d r t 1 1 0 1 0 0 1 1 0 0 0 0 , ( ) , ( ) , ( ) = = = − + − + − − + α α α ∆ ∆ ∆ ∆ ∆ ∆
To determine α1 we use the previously calculated Q’s. The price of a discount bond
maturing at time step 2 can be calculated from the initial term structure. It should be
equal to e−r( )2 2* ∆t. On the other hand the price of the bond at node (1,1) should be
e−(α1+1∆ ∆r) t, at node (1,0) it should be e−(α1+0∆ ∆r) t, and at node (1,-1) it should be
e−(α1−1∆ ∆r) t
. It follows that at the initial node (0,0) the price of the bond should be
P( , ) Q e, r t Q e t Q e r t e r t ( )
, ( )
,
( ) ( )
0 2 1 1 1 0 1 1
2 2
1 1 1
= − + + − + =
− − − −
α ∆ ∆ α ∆ α ∆ ∆ ∆
to avoid arbitrage. By rearranging it is possible to calculate α1.
α1
1 1 1 0 1 1
2 2 = + + − − − −
ln( , , , ) ln( )
( )
Q e Q Q e e
t
r t r t r t
∆ ∆ ∆ ∆ ∆
∆ (39)
The next step is to calculate the Q’s for the second time step. For example Q2,1 can
only be reached from node (1,1) with a probability pm or from node (1,0) with a
at node (1,1) to be equal to (α1+1∆r)∆t and at node (1,0) to be at equal to (α1+0∆r)∆t
it follows that
Q p em Q p e Q
r t
u t
2 1 1 1 1 0
1 1
,
( ) ,
( ) ,
= −α+∆ ∆ + −α ∆ (40)
The other Q’s for the second time step are calculated in a similar way. Then α2 is
calculated similar to (39) and the Q3,j’s similar to (40) and so on.
Assuming we have calculated the Qi,j’s for i≤m (m≥0) αm can be calculated more
generally by
αm
m j j r t
m j n
n
Q e P
t
m m
=
−
−
+ =−
∑
ln , ∆ ∆ ln ∆
1
(41)
where nm is the number of nodes on each side of the central node at time m∆t. Then
the next Qi,j’s can be determined by
Qm j Qm kp k j e
k r t k
m
+1, =
∑
, − +( )
( , ) α ∆ ∆ (42)
where p(k,j) denotes the probability of moving from node (m,k) to node (m+1,j). The
summation is taken over all values of k for which this is nonzero. This means that to
determine the Arrow-Debreu prices of the next time step tm+1 we have to consider all
of their Arrow-Debreu price predecessors at time tm and the probabilities connecting
them.
By using (41) and (42) consecutively it is possible to construct the whole trinomial
tree of the short rate r divided in time intervals ∆t up to an arbitrary point in time as
It is important to note that since the variable dr is normally distributed, r can take on
negative values although the probability should be small for that occurrence since
mean-reversion tends to pull r up if it gets close to zero.
5 Applications
Now that we have set up the theoretical framework of the Hull-White model, we will
show how to apply it to the valuation of several financial instruments. Later on we will
show how it might be used in managing interest rate risks.
5.1 Discount bond options
The usual and most often used model in pricing discount bond options is Black’s 76
model9 which represents an extension of the famous Black-Scholes model. This
model makes three assumptions:
1. that the price of the underlying variable10 has a lognormal probability distribution at
the expiration of the option
2. interest rates are non-stochastic and
3. the standard deviation of the natural logarithm of the underlying’s price is the
standard deviation of the futures/forward price of the underlying times the square
root of the time to the option maturity
Given these assumptions it is possible to find closed form solutions for valuing
discount bond options and coupon bond options11.
However there are some pitfalls in using the Black 76 model. For example when it is
used to price a cap the underlying forward rates are assumed to be lognormal and
when it is used to price a swaption the swap rate is assumed to be lognormal. This
9
shows that Black 76 inherits theoretical inconsistencies because both the forward
rate and the swap rate cannot be distributed lognormal simultaneously. On the other
hand Black’s 76 model fails in providing solutions to all kinds of American options
and options with more exotic payout functions.
5.1.1 Analytical solution
Due to the analytic tractability of the Hull-White model there exists a closed form
solution for discount bond options. If we denote c as the price of a call option at time
t=0 and maturity T on a bond with maturity s it is
( )
( )
( )
(
)
c= P 0,s N h −XP 0,T N h−σp (43)
with
( )
( )
h LP s
P T X
p
p
= 1 0 +
0 2
σ
σ ln ,
,
and
( )
[
]
σp σ
a s T
aT
a e
e a
= − − − − −
1 1
2 2
The variable σp is the standard deviation of the logarithm of the bond price at time T.
5.1.2 Numerical solution
On the other hand it is also possible to use the numerical procedure described in
section four to value options on discount bonds. First one calculates the evolution of
values. In a second step backward induction is used iteratively to calculate the option
values at all previous time steps up to time zero.
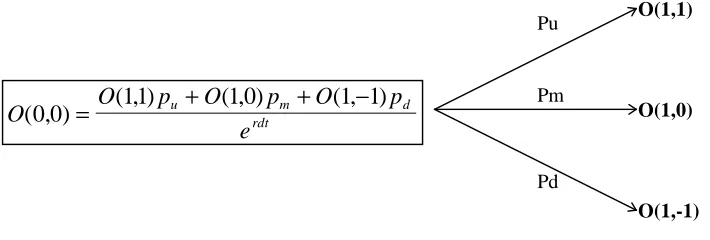
The backward induction procedure using risk-neutral pricing is diagrammatically
illustrated in Figure 3 for one branch in a tree like shown in Figure 2:
O(1,-1) O(1,0) O(1,1) Pu
Pm
Pd
O O p O p O p
e
u m d
rdt
[image:31.595.120.475.198.318.2]( , )0 0 = ( , )11 + ( , )1 0 + ( ,1 1− )
Figure 3
Please note that if the branching switches to non-standard branching we have to
make the appropriate adaptations like shown in the computer code in the
appendices.
On the other hand backward induction is not the only way to price European options
on discount bonds. It is also possible to use the previously calculated state prices
Q(i,j) because the present value O(0,0) of a cash flow occurring at time t=i*dt is
simply the sum of each possible cash flow multiplied by the corresponding
Arrow-Debreu price.
O Q i j O i j
j Min i j Min i j
( , ) ( , ) ( , ) ( , max)
( , max) 0 0 =
=−
∑
(44)For example this would give
O( , )0 0 =Q( , ) ( , )1 1O11 +Q( , ) ( , )1 0 O 1 0 +Q( ,1 1− ) ( ,O 1 1− )
Example 1: To give an example we will calculate a European put bond option on a 9
year zero coupon bond and face value 100 with time to maturity of 3 years. We
assume the two volatility parameters to be a=0.1 and σ=0.01. Additionally we face
the following term structure
Maturity Zero Rate
days 360
continuously compounded zero rates
0,008219178 0,0501772
0,083333333 0,0498284
0,166666667 0,0497234
0,25 0,0496157
0,5 0,0499058
1 0,0509389
2 0,0579733
3 0,0630595
4 0,0673464
5 0,0694816
6 0,0708807
7 0,0727527
8 0,0730852
9 0,073979
[image:32.595.195.407.171.414.2]10 0,0749015
Table 1
The strike price is set to the three year forward price of the bond
X =100e−r( )9 9er( )3 3= ≈ 62,08706573 63
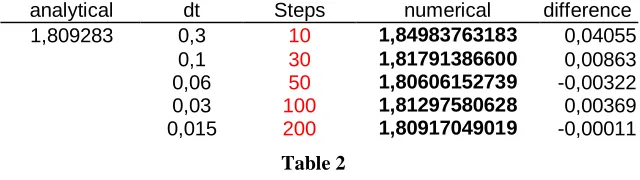
In Table 2 the numerical results for various numbers of time steps and the exact
analytic value are presented using the computer code given in the appendices.
analytical dt Steps numerical difference
1,809283 0,3 10 1,84983763183 0,04055
0,1 30 1,81791386600 0,00863
0,06 50 1,80606152739 -0,00322
0,03 100 1,81297580628 0,00369
0,015 200 1,80917049019 -0,00011
Table 2
[image:32.595.141.461.585.675.2]5.1.3 Convergence Analysis
If we decide to use a numerical solution it is crucial to know how fast it will converge
to the exact value. Since it is possible to calculate bond options either analytically or
numerically we will study the convergence behavior of the Hull-White model in the
light of this instrument.
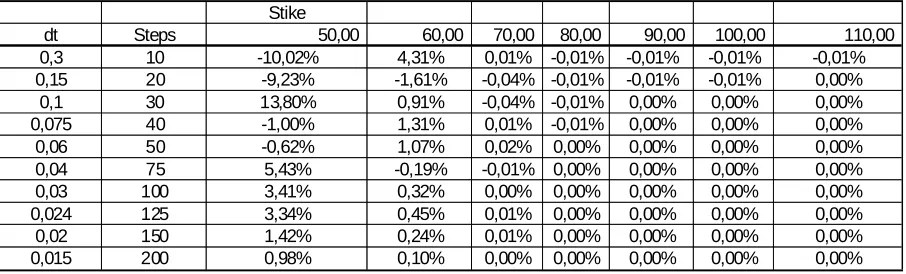
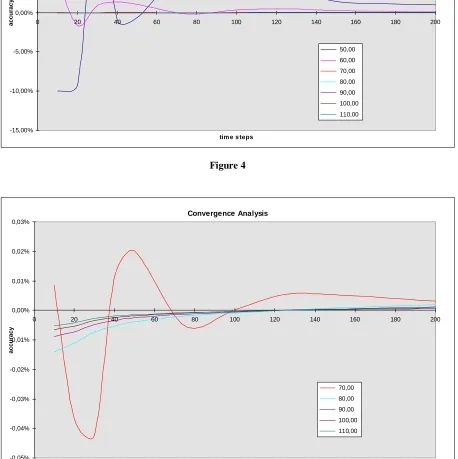
Table 3 and Figure 4 summarize the convergence behavior for different strike prices.
Figure 5 gives a close-up of in-the-money options. The numbers in Table 3 are
percentage deviations of the numerical solutions from the analytical ones. For
example for a strike price of 60 and 50 time steps the numerical solution gives a
1.07% higher value than the analytical one.
Stike
[image:33.595.72.525.369.506.2]dt Steps 50,00 60,00 70,00 80,00 90,00 100,00 110,00 0,3 10 -10,02% 4,31% 0,01% -0,01% -0,01% -0,01% -0,01% 0,15 20 -9,23% -1,61% -0,04% -0,01% -0,01% -0,01% 0,00% 0,1 30 13,80% 0,91% -0,04% -0,01% 0,00% 0,00% 0,00% 0,075 40 -1,00% 1,31% 0,01% -0,01% 0,00% 0,00% 0,00% 0,06 50 -0,62% 1,07% 0,02% 0,00% 0,00% 0,00% 0,00% 0,04 75 5,43% -0,19% -0,01% 0,00% 0,00% 0,00% 0,00% 0,03 100 3,41% 0,32% 0,00% 0,00% 0,00% 0,00% 0,00% 0,024 125 3,34% 0,45% 0,01% 0,00% 0,00% 0,00% 0,00% 0,02 150 1,42% 0,24% 0,01% 0,00% 0,00% 0,00% 0,00% 0,015 200 0,98% 0,10% 0,00% 0,00% 0,00% 0,00% 0,00%
Convergence Analysis
-15,00% -10,00% -5,00% 0,00% 5,00% 10,00% 15,00%
0 20 40 60 80 100 120 140 160 180 200
tim e s teps
accuracy
[image:34.595.72.526.72.354.2]50,00 60,00 70,00 80,00 90,00 100,00 110,00
Figure 4
Convergence Analysis
-0,05% -0,04% -0,03% -0,02% -0,01% 0,00% 0,01% 0,02% 0,03%
0 20 40 60 80 100 120 140 160 180 200
tim e s teps
accuracy
[image:34.595.70.528.201.660.2]70,00 80,00 90,00 100,00 110,00
As we can see the numerical solutions tend to give more exact results for
at-the-money and in-the-at-the-money options where only a few time steps are sufficient to
produce highly accurate results.
On the other hand for out-of-the-money options a high number of time steps is
necessary to provide reliable values. Therefore we recommend using at least 150
time steps for out-of-the-money options and about 50 for all other options.
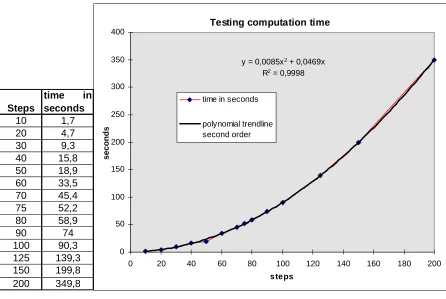
5.1.4 Testing computation time
Moreover in deciding how many time steps we choose we implicitly make a decision
of how much computation time we are willing to sacrifice.
Table 4 and Figure 6 show that the relation between number of time steps and
computation time can best be approximated by a second order polynom of the form
y = 0,0085x2 + 0,0469x
with a coefficient of determination of
R2 = 0,9998
These results were achieved using a Intel Pentium II processor with 233 MHz and
Visual Basic for Applications. Although the actual time for each number of time steps
will vary depending on the computer and programming language used, the
Steps
time in
seconds
10 1,7
20 4,7
30 9,3
40 15,8
50 18,9
60 33,5
70 45,4
75 52,2
80 58,9
90 74
100 90,3
125 139,3
150 199,8
200 349,8
Testing computation time
y = 0,0085x2 + 0,0469x
R2 = 0,9998
0 50 100 150 200 250 300 350 400
0 20 40 60 80 100 120 140 160 180 200
steps
seconds
time in seconds
polynomial trendline second order
Table 4 Figure 6
5.1.5 American style options
If we assume the discount bond option to be of American style we calculate the
terminal payoff of the option in the usual way, but in the backward induction process
we have to consider that early exercise may be optimal. This means that we work
backward in the tree according to
(
)
{
}
O i j( , ) =max z X −Pbond i j( , ) ,(p O iu ( +1,j+ +1) p O im ( +1, )j +p O id ( +1,j−1))e−r i j dt( , )
with Pbond(i,j) denoting the price of the discount bond at step i and state j and z
being equal to 1 if the option is a put and -1 otherwise. Again this formula has to be
adjusted in the right way if non-standard branching is used.
[image:36.595.72.518.67.366.2]be optimal for an American put option on a discount bond if the price of the discount
bond is sufficiently low. This result can be tested with the adjoined files NUM.XLS
which calculates the value of an European option and AMERICAN.XLS which
calculates the American counterpart.
5.2 Coupon bond options
Jamshidian (1989) demonstrated that a European option on a coupon bond can be
seen as a portfolio of discount bond options. This means that an option on a bond
with N-coupon payments after option expiary is decomposed into N discount bond
options.
To demonstrate the calculation of a coupon bond option we will consider a bond with
the same face value and maturity as in Example 1 but with an annual coupon
payment C. Additionally we face the same term structure, volatility parameters and
option specifications.
To split the coupon bond option into discount bond options we have to find the short
rate at option maturity for which the sum of the discount bonds equals the option
strike price.
CP( , ,r CP r CP r CP r CP r C L P r X
) ( , ,
) ( , ,
) ( , ,
) ( , ,
) ( ) ( , ,
)
3 4 + 3 5 + 3 6 + 3 7 + 3 8 + + 3 9 = (45)
P x y r( , ,
) stands for the price of a discount bond with face value 1 at time x and
maturity y if we observe at time x a short rate
r. C denotes the coupon payment and
L is the face value of the bond.
Equation (45) can be solved by trial and error or more efficiently with the
Newton-Raphson method like in the computer code in Appendix C.
maturity of discount bond 4 5 6 7 8 9 Sum Strike 4,296769888 3,725083711 3,249428 2,832704 2,503096 46,39292 63
Option value 0,263069995 0,449561394 0,578567 0,660218 0,714757 15,55837 18,2245
As Jamshidian pointed out this decomposition only works in a one factor model like
the Hull-White model where all rates are perfectly correlated to the short rate.
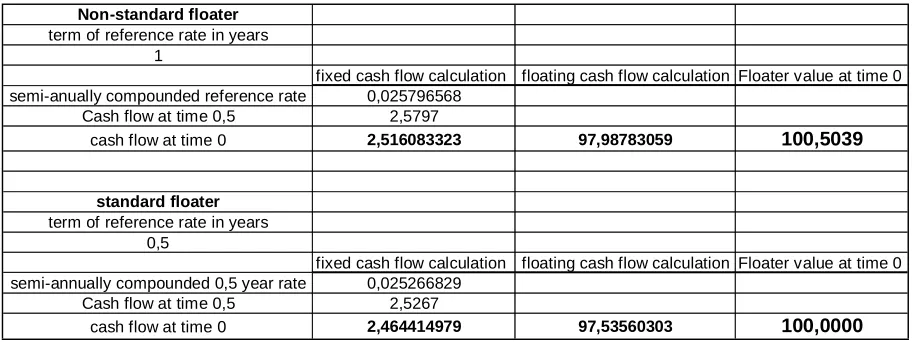
5.3 Floaters
With the Hull-White model it is also possible to calculate non-standard floating rate
bonds where the interval between interest payments is not equal to the term of the
floating rate.
For example lets consider a floater with semi-annual coupon payments depending on
the 1-year LIBOR which are calculated at the beginning of the period and paid at the
end.
If we start the valuation at initiation of the floater or at a reset date a regular floater- in
our case a floater depending on the 6-month LIBOR- would be equal to 100.
Table 5 gives a comparison of a regular two year floater to a non-standard floater
using the data provided in Example 1. The calculations for the floating part were
Non-standard floater term of reference rate in years
1
fixed cash flow calculation floating cash flow calculation Floater value at time 0
semi-anually compounded reference rate 0,025796568
Cash flow at time 0,5 2,5797
cash flow at time 0 2,516083323 97,98783059 100,5039
standard floater term of reference rate in years
0,5
fixed cash flow calculation floating cash flow calculation Floater value at time 0
semi-annually compounded 0,5 year rate 0,025266829
Cash flow at time 0,5 2,5267
[image:39.595.70.526.69.240.2]cash flow at time 0 2,464414979 97,53560303 100,0000
Table 5
5.4 Caps, Floors, Collars
A cap provides a payment everytime a specified floating rate like the 6 month LIBOR
exceeds the agreed cap rate. This assures the borrower of a loan that he will never
pay more than the cap rate. These individual payments are called caplets and as a
sum make up a cap.
Usually the reference rate is observed at the beginning of the period starting at t=1
and eventually a payment is made at the end of the period. In order to use the
Hull-White model which determines the reference rate at each point in time and state we
have to calculate the cash flows at the time the reference rate is measured which is
at the beginning of the period.
As a result the payment at the beginning of the period is calculated according to
Lmax(z(1- eτ(RcX-Rck)),0) (46)
where Rck denotes the continuously compounded floating rate which applies to a
period k (which is 6 months for our example of the 6 month LIBOR), RcX is the
continuously compounded strike rate (cap rate) and τ is the period between
Then standard backward induction or state prices are used to calculate the value of
each caplet at t=0 and the sum is taken.
On the other hand it is also possible to think of equation (46) as being the cash flow
function of a put option with maturity at the beginning of the considered period and
strike price L on a discount bond which matures at the end of the period and face
value LeτRcX. This approach shows that a cap can be calculated as a portfolio of put
options on discount bonds where analytical results exist.
On the other hand if the term of the reference rate k does not match the payment
period τ the cash flow function would look like
Lmax(z(eτ(Rck-Rc )τ - eτ(RcX-Rc )τ ),0) (47)
which can only be calculated numerically.
To evaluate a floor z takes on -1 and either the numerical procedure or the replicating
approach of call options on discount bonds is used. A collar is simply a combination
of a long position in a cap and a short position in a floor and is calculated
accordingly.
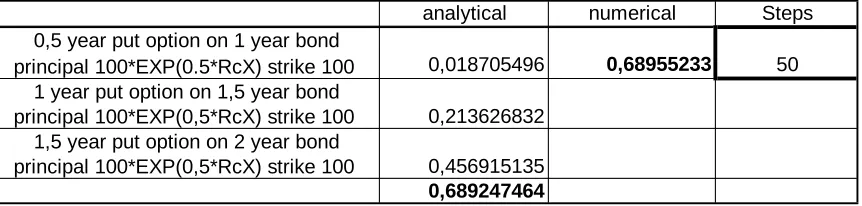
Table 6 gives an example of a regular cap on the 6 month rate with cap rate
RcX=0.06 calculated analytically and numerically.
analytical numerical Steps
0,5 year put option on 1 year bond
principal 100*EXP(0.5*RcX) strike 100 0,018705496 0,68955233 50 1 year put option on 1,5 year bond
principal 100*EXP(0,5*RcX) strike 100 0,213626832 1,5 year put option on 2 year bond
[image:40.595.78.509.572.675.2]principal 100*EXP(0,5*RcX) strike 100 0,456915135 0,689247464
5.5 Swaptions
Options on interest swaps or swaptions as they are also called are another popular
instrument to hedge against unfavorable interest rate movements. They give the
holder the possibility to enter into a specified interest rate swap at some future time.
As this is only a right but no obligation it must have some value.
To value a swaption we make use of the fact that a swap can be regarded as the
agreement to exchange a fixed rate bond for a floating-rate bond. As the value of the
floating rate bond always equals the principal amount at initiation of the swap
regardless of the specific floating rate it is based on, we can say that a swaption is an
option to exchange the fixed rate bond for the principal amount of the swap. This
means that for an option on a payer swap where we pay fixed and receive floating
the swaption can be replicated by a put option on the fixed rate bond with strike price
equal to the principal. A receiver swaption is valued similar but with a call option.12
Since we can price an option on a coupon bond analytically we can price a swaption
analytically.
Example 2: Lets consider a T=3 year option on a swap starting in 3 years and lasting
6 years with semiannual payments
τ
=0.5. The term structure and volatilityparameters are given in Example 1 and the continuously compounded strike rate is
RcX=0.06. This means that we have to replicate the swaption by an option on a
coupon bond with 12 coupon payments of C= L e
(
0 06 0 5−)
1 . * .
and principal L.
On the other hand it is also possible to use the numerical procedure and calculate all
possible cash flows at option expiration T=3 with
where Tdata(f) denotes the time coupon f is paid and Rck(N,j) is the swap rate at
time T and state j which has to be calculated from
L eRck RcD f Tdata f T L
f
* *τ − ( )*( ( )− )
=
∑
=1 12
where RcD(f) is the discount rate for a period of Tdata(f)-T by using a
Newton-Raphson iterative procedure. Appendix E provides the corresponding computer code.
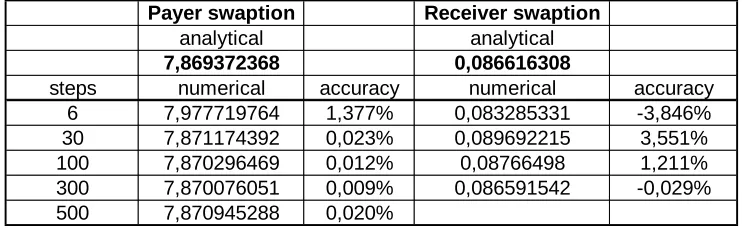
Table 7 shows the results for Example 2 and gives a comparison of the analytical
and numerical solution.
Payer swaption Receiver swaption
analytical analytical
7,869372368 0,086616308
steps numerical accuracy numerical accuracy
6 7,977719764 1,377% 0,083285331 -3,846%
30 7,871174392 0,023% 0,089692215 3,551%
100 7,870296469 0,012% 0,08766498 1,211%
300 7,870076051 0,009% 0,086591542 -0,029%
[image:42.595.112.483.318.433.2]500 7,870945288 0,020%
Table 7
Again we can notice that for out-of-the-money options about 150 steps and all other
options 50 steps give accurate results.
5.6 Accrual Swaps
The numerical procedure presented above can also be used to price accrual swaps.
These are swaps where the interest on one side accrues only if the floating rate is in
a certain range or above or below a rate.
Like Hull (1997) points out an accrual swap can be replicated by an ordinary swap
(
)
O(f, j) = L *
248 * e * e
(RcX* /248) -RD(f *dt,s(f)/248)*(s(f)-f))/248
τ τ −
1
at the following swap payment date s(f) if for example the floating reference rate is
below the strike rate RcX. RD is the discount rate for the period between calculating
the cash flow at time f*dt and the next swap payment date s(f) and τ is the number of
days between swap payments assuming the year has 248 business days.
To give an example lets consider the fixed rate accrues only if the 3-month LIBOR is
below RcX=0.08 cont. comp. and the swap pays every three month for 9 months
time. The term structure and volatility parameters are again assumed to be the same
as in example 1. The valuation result which is the sum of all binary options for 9
months is presented in Table 8 and the computer code in Appendix F.
number of business days 248
dt (one day in years) 0,004032258 days in payment period (tau) 62
maturity of swap in years 0.75
RcX 0.08
[image:43.595.179.418.358.439.2]Value of binary options 0,334585449
Table 8
5.7 Callable, Putable Bonds
Some bonds have embedded options which give either the holder or the issuer
certain rights. A callable bond for example gives the issuer the right to call the bonds
at certain times or at any time at a prespecified price. With Hull and White’s
numerical procedure it is easy to price these embedded options.
As a simple example lets consider a discount bond with 9 years to maturity which
gives the issuer the right to call the bonds at any time for X=75. This callable bond is
priced by calculating the price of the bond at the terminal nodes which is 100 and
{
}
O i j X p O iu j p O im j p O id j e
r i j dt
( , ) =min ,( ( +1, + +1) ( +1, )+ ( +1, −1)) − ( , ) (48)
which is similar to the American style option valuation. Again this formula has to be
adjusted in the right way if non-standard branching is used.
If we consider a putable bond where the holder has the right to demand early
redemption we simply change min in (48) to max.
Table 9 shows the results assuming the term structure and volatility parameters of
Example 1 and the discount bond mentioned above. The computer code is provided
in Appendix G.
Steps X callable bond bond without call option
worth of the option to the issuer
90 75 38,53921831 51,3856621 12,84644379
Steps X putable bond bond without put option
worth of the option to the holder
[image:44.595.120.480.325.448.2]90 50 51,56011996 51,3856621 0,174457864
Table 9
6 Volatility parameter estimation
One of the input data necessary for the Hull-White model are the two volatility
parameters a and σ where the first one gives the relative volatility of the long and
short rates and the second is the absolute volatility of the short rate. Unlike the initial
term structure these volatility parameters are not directly provided by the market.
Therefore they have to be inferred from market data of interest rate derivatives.
The procedure of calibrating the Hull-White model to market prices is done by
where Pi is the market price of the ith interest rate derivative and Vi is the
corresponding model price13. Equation (49) minimizes the sum of the squared error
(SSE) which can be done with the EXCEL Solver add-in for example.
As an example we will infer the volatility parameters from Caps and Floors on the
DEM 6 month LIBOR rate with different strike rates and time to maturity. Caps and
Floors are well suited for calibration because they are actively traded and their model
prices can be calculated analytically.
The initial term structure for DEM as of 4/8/1998 was provided by REUTERS Ltd. and
is given in Table 10.
Maturity (in Years) Zero Rate
0,008219178 3,430%
0,083333333 3,530%
0,166666667 3,560%
0,25 3,599%
0,5 3,716%
1 3,918%
2 4,243%
3 4,472%
4 4,615%
5 4,755%
6 4,855%
7 4,958%
8 5,037%
9 5,117%
[image:45.595.196.400.335.585.2]10 5,200%
Table 10
Cap and Floor prices were provided by the Risk Management Department of
DEM CAPS 6M DEM FLOOR 6M
5,50% 6,00% 6,50% 4,00% 4,50% 5,00%
2YR 3,5 2YR 17 52,5 106,5
3YR 23,5 12,5 6 3YR 30,5 82,5 160,5
4YR 55 31,5 18 4YR 50 115 212
5YR 92 56,5 34,5 5YR 65 144 260
7YR 179 113 74 7YR 95,5 194,5 341
[image:46.595.71.527.72.182.2]10YR 326 226 155 10YR 137 258,5 439
Table 11
The prices in Table 11 are basis points of the principal which was assumed to be
10000.
Table 12 shows the SSE for the optimized a and σ of
sigma 0,011282417
a 0,200527417
RcX RcX RcX
CAPS cont cont cont
5,426% 5,912% 6,397%
Cap/Floor Years (s) Marktpreis (Pi) Model price (Vi) (Pi-Vi)^2 Marktpreis (Pi) Model price (Vi) (Pi-Vi)^2 Marktpreis (Pi) Model price (Vi) (Pi-Vi)^2 p 2 3,5 12,98453683 89,95643895
3 23,5 41,26976804 315,7646563 12,5 21,16306068 75,0486204 6 10,01684556 16,13505 4 55 76,36963357 456,6612391 31,5 42,29200258 116,46732 18 21,83829282 14,73249 5 92 122,1489707 908,9604331 56,5 71,799343 234,069896 34,5 39,70862066 27,12973 7 179 222,2184576 1867,835076 113 138,9115134 671,406526 74 82,31760239 69,18251 10 326 389,0650676 3977,202753 226 255,8765538 892,608467 155 160,4245053 29,42526
RcX RcX RcX
FLOORS cont cont cont
3,961% 4,450% 4,939%
Cap/Floor Years (s) Marktpreis (Pi) Model price (Vi) (Pi-Vi)^2 Marktpreis (Pi) Model price (Vi) (Pi-Vi)^2 Marktpreis (Pi) Model price (Vi) (Pi-Vi)^2 c 2 17 28,43573434 130,7760199 52,5 58,92812127 41,320743 106,5 103,4621577 9,228486 3 30,5 44,18014537 187,1463772 82,5 87,64545758 26,4757337 160,5 151,2959651 84,71426 4 50 60,54771651 111,2543235 115 115,9541267 0,91035774 212 196,7394927 232,8831 5 65 73,54063378 72,94242542 144 138,4193738 31,1433889 260 233,0008217 728,9556 7 95,5 96,48119138 0,962736525 194,5 177,5600856 286,9607 341 295,6680192 2054,988 10 137 120,0163966 288,4427833 258,5 218,2070776 1623,5196 439 361,7047205 5974,56
[image:46.595.75.526.363.607.2]SSE 21650
Table 12
If the solver does not produce reasonable results another procedure for finding the
SSE is recommended by the author. For example we might have a guess that 0<a<1
0,01 0,06 0,11 0,16 0,21 0,26 0,31 0,36 0,41 0,46 0,01 0,11 0,21 0,31 0,41 0,51 0,61 0,71 0,81 0,91
S S E
sigm a
a
SSE capped at 50000
45000-50000
40000-45000
35000-40000
30000-35000
25000-30000
Min
[image:47.595.69.525.67.361.2]SSE=25942.95
Figure 7
Figure 7 shows that the minimal SSE can be found if 0<a<0.3 and 0<σ<0.06 so we
calculate a new 10*10 matrix within the new borders of a and σ. Figure 8 shows the
0,002 0,004 0,006 0,008 0,01 0,012 0,014 0,016 0,018 0,02
0,03 0,06 0,09 0,12 0,15 0,18 0,21 0,24 0,27 0,3
SSE
sigm a
a
SSE capped at 28000
27000-28000 26000-27000 25000-26000 24000-25000 23000-24000 22000-23000 21000-22000
B
C
A
Min
[image:48.595.69.526.72.331.2]SSE=21775.84
Figure 8
0,002 0,008
0,014 0,02
0,03 0,06 0,09 0,12 0,15 0,18 0,21 0,24 0,27 0,3 21000 22000 23000 24000 25000 26000 27000 28000
SSE
sigm a a
SSE capped at 28000
[image:48.595.68.528.79.594.2]27000-28000 26000-27000 25000-26000 24000-25000 23000-24000 22000-23000 21000-22000
Figure 9
Now to drill down further area A, B and C in Figure 8 are investigated more closely
0,0104 0,0108 0,0112 0,0116 0,012 0,0124 0,0128 0,0132 0,0136 0,014
0,189 0,198 0,207 0,216 0,225 0,234 0,243 0,252 0,261 0,27
SSE
sigm a
a
SSE capped at 22000
21900-22000
21800-21900
21700-21800
21600-21700
21500-21600
21400-21500
21300-21400
21200-21300
21100-21200
21000-21100
Min
SSE=21663.92
[image:49.595.87.512.70.345.2]A
Figure 10
0,0084 0,0088 0,0092 0,0096
0,01
0,0104 0,0108 0,0112 0,0116 0,012
0,099 0,108 0,117 0,126 0,135 0,144 0,153 0,162 0,171 0,18
SSE
sigm a
a
SSE capped at 22900
22700-22900
22500-22700
22300-22500
22100-22300
21900-22100
21700-21900
Min
SSE=21799.14
B
[image:49.595.76.520.108.627.2]0,0 032
0,0 056
0,0 08
0,0 104
0,0 128
0,006 0,012 0,018 0,024 0,03 0,036 0,042 0,048 0,054 0,06
SSE
sigma
a
SSE capped at 30000
29000-30000 28000-29000 27000-28000 26000-27000
Min
SSE=26925.09
[image:50.595.87.511.71.318.2]C
Figure 12
As a result the solution for the optimal a and σ which the solver provides seems to be
the correct one since it lies in area A which shows the minimum SSE of all areas
considered.
This procedure of focusing on small parts of areas iteratively is highly computational
effective since the grid of a and σ becomes denser while avoiding an increasing
number of nodes.
7 Hedging
In order to assess the risk of interest rate derivatives it is vital to know what impact
shifts in the input data might have.