DEMOGRAPHIC RESEARCH
VOLUME 30, ARTICLE 35, PAGES 1011–1034
PUBLISHED 2 APRIL 2014
http://www.demographic-research.org/Volumes/Vol30/35/
DOI: 10.4054/DemRes.2014.30.35
Research Article
Regional probabilistic fertility forecasting by
modeling between-country correlations
Bailey K. Fosdick
Adrian E. Raftery
c
2014 Bailey K. Fosdick & Adrian E. Raftery.
2 Methodology 1015
2.1 Current model 1015
2.2 Correlation model 1017
2.3 Exploratory analysis 1018
3 Parameter estimation 1021
4 Results 1024
4.1 Model validation 1024
4.2 Effect of taking account of correlation 1027
4.3 Comparison to previous results 1030
5 Discussion 1030
6 Acknowledgements 1031
Regional probabilistic fertility forecasting by modeling
between-country correlations
Bailey K. Fosdick1
Adrian E. Raftery2
Abstract
BACKGROUND
The United Nations (UN) Population Division constructs probabilistic projections for the total fertility rate (TFR) using the Bayesian hierarchical model of Alkema et al. (2011), which produces predictive distributions of the TFR for individual countries. The UN is interested in publishing probabilistic projections for aggregates of countries, such as regions and trading blocs. This requires joint probabilistic projections of future country-specific TFRs, taking account of the correlations between them.
OBJECTIVE
We propose an extension of the Bayesian hierarchical model that allows for probabilistic projection of aggregate TFR for any set of countries.
METHODS
We model the correlation between country forecast errors as a linear function of time invariant covariates, namely whether the countries are contiguous, whether they had a common colonizer after 1945, and whether they are in the same UN region. The resulting correlation model is incorporated into the Bayesian hierarchical model’s error distribu-tion.
RESULTS
We produce predictive distributions of TFR for 1990-2010 for each of the UN’s primary regions. We find that the proportions of the observed values that fall within the prediction intervals from our method are closer to their nominal levels than those produced by the current model.
1Statistical and Applied Mathematical Sciences Institute (SAMSI) and Duke University, USA. E-Mail: [email protected].
CONCLUSIONS
Our results suggest that a substantial proportion of the correlation between forecast errors for TFR in different countries is due to the countries’ geographic proximity to one an-other, and that if this correlation is accounted for, the quality of probabilistic projections of TFR for regions and other aggregates is improved.
1.
Introduction
The United Nations (UN) Population Division produces population estimates and projec-tions for all countries every two years and publishes them in the biennialWorld Popula-tion Prospects(WPP). These projections are used by UN agencies and governments for planning, monitoring development goals, and as inputs to climate change and other mod-els. They are also widely used by social and health science researchers and the private sector. The UN produces these population forecasts by projecting countries’ age- and sex-specific fertility, mortality, and migration rates, and combining them to obtain age-and sex-specific population sizes using the stage-andard cohort component method.
In this paper we focus on the fertility component. Country fertility in a given time period is summarized by the period total fertility rate (TFR), which is the average number of children a woman would bear if she lived past the end of the reproductive age span and at each age experienced the age-specific fertility rate of the given country and time period. Projections of future TFR are decomposed using forecasted age schedules to obtain projections of age-specific fertility rates.
The WPP reports three projection variants (low, medium, and high) for the population and vital rates based on expert opinion and models of historical patterns. The low and high variants correspond to TFR half a child below and above the medium value, respectively. One drawback of these projections is that the range given by the low and high variants has no probabilistic interpretation and hence does not reflect meaningful uncertainty in the forecasts.
are typically summarized by the median country TFR prediction and the 80% or 95% prediction interval.
In addition to producing population estimates at the country level, the UN also pro-vides projections for country aggregates such as geographic regions and trading blocs. The country TFR projections from the current Bayesian hierarchical model of Alkema et al. (2011) can be combined to obtain regional probabilistic TFR projections, provided the current model takes account of the dependence between countries’ fertility rates. However, if dependence exists between country TFRs that is not accounted for in the Bayesian hierarchical model, treating the country-specific projections as independent may underestimate the uncertainty about the future TFRs and populations of aggregates.
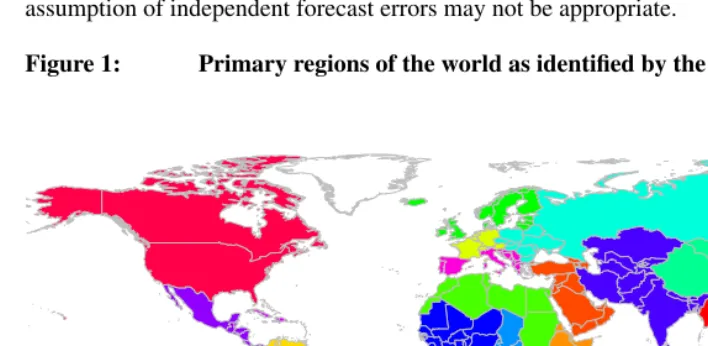
Figure 1 shows the UN’s 22 primary regions of the world and Table 1 summarizes the coverage probability of the out-of-sample TFR prediction intervals for these regions based on the current model. The coverage probabilities of the region-specific predictive intervals are smaller than the nominal levels, even though the country-specific coverages have been found to be approximately correct (Alkema et al. 2011). This suggests that the assumption of independent forecast errors may not be appropriate.
Table 1: Proportion of observed regional TFRs that fall within the specified out-of-sample prediction intervals (PI) obtained from the current Bayesian hierarchical model of Alkema et al. (2011)
Time Period 80% PI 90% PI 95% PI
1990-1995 0.73 0.86 0.95
1995-2000 0.68 0.73 0.86
2000-2005 0.59 0.73 0.82
2005-2010 0.73 0.82 0.91
All 0.68 0.78 0.89
The importance of modeling between-country correlations in stochastic projections is well recognized and others have proposed methods for addressing it. Lutz, Sanderson, and Scherbov (1997) combined stochastic projections, where the within and/or between region country correlation was zero or one, to incorporate forecast uncertainty due to be-tween country correlation. This procedure was formalized by Alho and Spencer (2005) based on the use of random seeds and it was used to generate regional TFR forecasts in Statistics Netherlands (2005) (see also Alho et al. (2006)). Although this method is able to produce forecast errors with any desired marginal correlation, the individual forecasts come from a mixture distribution of two extreme scenarios, neither of which is realis-tic, and confidence intervals for aggregate values based on the empirical quantiles of the forecast simulations may not be valid. Lutz, Sanderson, and Scherbov (2001) generated correlated fertility forecast deviations assuming a between region correlation of 0.7, but provided no empirical justification for this value.
Keilman and Pham (2004) and Alho (2008) estimated correlations between TFR fore-cast errors for a set of European countries for which long and high quality time series data are available, and for which the TFRs have been low for a long time in most cases. Simi-larly, Wilson and Bell (2007) developed probabilistic population projections for Queens-land and the rest of Australia using an empirical correlation between TFR errors. These studies represent best case scenarios, for which empirical estimates of the correlations are reasonably accurate and further modeling is probably unnecessary. This is not the case for our problem here: The number of empirical forecast errors is extremely limited for many countries, leading to undefined or unreliable empirical estimates of correlations.
a linear function of time invariant covariates. Three covariates are chosen: whether two countries are contiguous, whether they had a common colonizer after 1945, and whether they are in the same UN region. This model provides estimates of the correlation between any pair of countries, even when empirical estimates are not available.
This paper is organized as follows. In the next section we review the current model and introduce the correlation model extension. We also describe the exploratory analyses that led to the choice of model extension. An estimation procedure based on a pairwise likelihood function is described, and model validation results are then presented for the prediction of the TFR in each of the UN’s regions. We show theoretically which regional prediction intervals are most affected by the correlation model and compare the pairwise country correlation values from our model and those obtained in previous studies.
2.
Methodology
2.1 Current model
The Bayesian hierarchical model of Alkema et al. (2011) divides the evolution of TFR in a country into three phases: before, during, and after the fertility transition. During the fertility transition, the TFR for countrycin time periodt,fc,t, is modeled as following a systematic decline curve with normally distributed random errors. After the fertility transition is complete, the TFR is modeled as a first order autoregressive process that ulti-mately fluctuates around 2.1, which is considered replacement level fertility (see Section 5 for extensions that relax this assumption). Ifft = (f1,t, ...., fC,t)is the TFR for all countries at timet, the model can be written as follows:
ft=mt+εt, εt∼N(0,Σt=diag(σte 2)) (1)
Fertility transition phase: mc,t=fc,t−1−d(θc, fc,t−1),
e
σc,t=σc,t(θc, fc,t−1).
Post-transition phase:
mc,t = 2.1 + 0.8859(fc,t−1−2.1),
e
σc,t=s= 0.1016,
where diag(x)is a diagonal matrix with the elements of the vectorxalong the diagonal. In (1), the quantities in bold font are vectors whose elements correspond to different countries,d(θc, fc,t−1)is a double logistic function controlling the rate of the fertility
time period,mc,t, and the variances of the random errors, eσ
2
c,t, differ in the transition and post-transition phases. Because a country’s TFR is not modeled before the fertility decline, the vectorftfor any time pointtcontains only those countries that have started or completed their fertility transition.
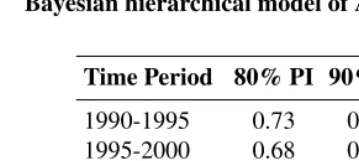
The data used to estimate the country parameters θc in the current model are the five-year time period TFR estimates from 1950 to 2010 in the 2010 WPP. A posterior distribution of the parameters is produced which indicates the probable values of the pa-rameters given the data. In addition, a predictive distribution of TFR values for each country can be obtained by forecasting future values using the relations in (1). Figure 2 shows the predictive distribution of TFR for Egypt from 2010 to 2050. This distribution is summarized by the median prediction and the 80%, 90%, and 95% prediction intervals.
Figure 2: TFR projections (grey) and probabilistic prediction intervals for Egypt from 2010 to 2050 from the Bayesian hierarchical model
● ● ●
●
● ●
● ●
● ●
● ●
1960 1980 2000 2020 2040
1
2
3
4
5
6
7
TFR Projections for Egypt
Year
TFR
2.2 Correlation model
As discussed above, the regional TFR prediction intervals from the current model tend to be too narrow (see Table 1). This suggests there is excess correlation between countries’ TFRs that is not accounted for in the current model. To capture this excess correlation, we propose modifying the error structure in (1) to allow for correlation between countries as follows:
εt∼N(0,Σt=diag(σte )·Rt·diag(σte )). (2)
The(i, j)element of the matrixRtis the correlation between the TFR forecast errors (i.e. the deviations from the mean predicted valuesmc,t) for countryiand countryjin time periodt.
Our exploratory analyses, described below, indicated that the correlations had a dif-ferent pattern when both countries had low fertility than otherwise, and our model allows for this. We sought to model the correlations using temporally stable characteristics of the country pairs, so that they could reasonably be used for projection. Thus, the elements of the correlation matrix are modeled as follows:
Rt[i, j] =
1 ifi=j,
ρ(1)i,j iffi,t−1< κandfj,t−1< κ,
ρ(2)i,j iffi,t−1≥κorfj,t−1≥κ,
(3)
ρi,j(k)=β0(k)+β1(k)contigi,j+β2(k)comcoli,j+β
(k)
3 sameRegioni,jfork∈ {1,2}, i6=j, where contigi,j = 1if countriesiandj are contiguous and 0 if not, comcoli,j = 1if they had a common colonizer after 1945, and sameRegioni,j = 1if they are in the same UN region. As mentioned above, a key feature of this model is that all covariates are time invariant, eliminating the need for a model that forecasts the covariates. If, for example, we modeled the correlation between two countries as a function of the ratio of their GDPs in the previous year, a model that predicted countries’ future GDP would be necessary.
The correlation model in (3) states that when countriesiandjboth have TFR belowκ, the correlation of their errors in the next time period isρ(1)i,j, and when at least one of them
has a TFR greater thanκ, the correlation isρ(2)i,j. In both cases, the correlation between two countries is modeled as a linear combination of the three pairwise country covariates. The parameters to be estimated therefore include the thresholdκ,{β0(1), β1(1), β2(1), β3(1)}
for the correlation when both countries have TFR less thanκ, and{β0(2), β1(2), β2(2), β3(2)}
for the correlation when at least one of the two TFRs is greater thanκ.
from the current model. Thus expanding the model to allow for correlation will not change the marginal country-specific predictive distributions, which is desirable given the good performance of the current model for individual countries.
2.3 Exploratory analysis
Exploratory analysis of one-time-period-ahead forecast errors from the model of Alkema et al. (2011) and WPP data from 1950 to 2010 guided specification of the correlation model structure. For each time period and country, the forecast error is the difference between the observed TFR and the average predicted value given TFR in the previous time period. Estimating the correlations between these forecast errors is difficult because the estimates are based on a small number of data points (at most 11 five-year periods), and because the country-specific predictive means and variances are given by the Bayesian hierarchical model. To obtain empirical estimates of the correlation between the forecast errors for two countries, conditional on their predictive variances, we used the posterior mean with an arc-sine prior. This estimator was proposed by Fosdick and Raftery (2012), who showed it to have good small sample performance compared to other frequentist and Bayesian estimators.
Table 2 shows the number of overlapping five-year time periods from 1955 to 2010 for each country pair after both had started their fertility decline. These counts represent the number of forecast errors available to compute each correlation estimate. As a number of countries have only recently started their fertility decline, many pairwise correlation estimates were based on only a few observations or, in the case of only two overlapping time periods, were not computed at all. We therefore chose to model the correlation structure rather than directly use the noisy empirical estimates from the raw data.
Table 2: Numbers of unique country pairs with overlapping five-year time
periods since the start of each country’s fertility decline
No. time periods 2 3 4 5 6 7 8 9 10 11
No. country pairs 389 385 1,131 3,009 1,635 2,550 2,508 2,750 1,978 2,775
whether each estimate is non-zero (see Fosdick and Raftery (2012) for more details on these tests). Results are shown for only the correlation estimates that are based on at least five overlapping time periods. Based on 0.05-level tests, over 17% of the correlation esti-mates for country pairs with low TFRs were deemed significantly non-zero. This is much larger than the 5% we would expect if there was no correlation in forecast errors. The percentage significant when countries have high TFR was 3.3, close to that expected in the absence of correlation. The stark difference in the percentage of non-zero correlations when both countries have low TFR compared to when they both have high TFR led us to specify one model for the correlation when the TFRs of both countries are below a thresholdκ, and a different model when at least one country has TFR aboveκ, whereκ is to be estimated from the data.
Table 3: Results from level-0.05 significance tests on the correlation esti-mates testing whether each estimate is non-zero
Number of Number Percent
country pairs significant significant
Both country TFRs above 3 1857 60 3.3
Both country TFRs below 3 1356 235 17.3
Notes: Only the correlation estimates that were based on at least five overlapping time periods were considered here.
The average estimated correlation between countries in the same UN-defined region when both have TFR below 3 was 0.37, and for countries in different regions was 0.09, using only correlation estimates based on at least eight time periods. This suggests that the correlation between forecast errors at low TFR levels may be related to geographical proximity, and motivates modeling the correlation as a function of geographical predic-tors.
Table 4 shows the results for all variables in the CEPII database, as well as two addi-tional indicator variables that signify whether pairs of countries are in the same UN area and same UN region. Note here we are only considering correlation estimates based on errors when both countries had TFR less than 3 and share at least five overlapping time periods. We chose to focus on estimates when TFR is low as these were determined to contain the most excess correlation and this correlation will have the most impact on long-term forecasts. The posterior inclusion probabilities for the covariates related to whether countries are contiguous (contig), share a common colonizer after 1945 (comcol), and are in the same UN region (sameRegion) are equal to one. This suggests there is strong evidence in the data for each of these covariates as predictors of country correlation. Bar-bieri and Berger (2004) showed that the single regression model with the predictors whose posterior inclusion probabilities are above 50% is predictively optimal, and so following them we choose the model with these three covariates.
Table 4: Output from theBMApackage inR
P(β6= 0) Estimate (β) Std Deviation
intercept 100.0 .062 .001
contiguous (contig) 100.0 .211 .034
common colonizer after 1945 (comcol) 100.0 .270 .039
same UN region indicator (sameRegion) 100.0 .117 .020
colonial relationship after 1945 41.8 .056 .072
colonial link 19.5 .018 .039
were/are the same country 14.5 -.014 .039
distance weighted by city pop: harmonic mean 9.5 0 0
distance weighted by city pop: arithmetic mean 9.1 0 0
share a language spoken by at least 9% 2.5 0 .001
common official language 2.2 .001 .001
currently in a colonial relationship 0.0 0 0
geodesic distance by most important cities 0.0 0 0
geodesic distance by capital cities 0.0 0 0
same UN area indicator 0.0 0 0
3.
Parameter estimation
Our method for estimating the parameters of the correlation model in (3) relies on the one-time-period-ahead standardized forecast errors. The Bayesian hierarchical model of Alkema et al. (2011) was fit to the 2010 WPP TFR estimates from 1950 to 2010, and posterior distributions ofθcgiven the data were obtained for each country. Using these parameter estimates and the TFR in a given time period, a predictive distribution of the expected TFR mc,t for the next time period was computed. The value of mc,t for a parameter vectorθcis
ˆ
mc,t|fc,tW P P−1,θc=
fW P P
c,t−1 −d(θc, fc,tW P P−1), during the fertility transition, 2.1 +ρ(fc,tW P P−1 −2.1), after the fertility transition,
wherefW P P
c,t−1 is the 2010 WPP TFR estimate for countrycat time periodt−1. For each
sampleθ(k)
c from the posterior distribution, there is a corresponding expected TFR value at timet.
We define the parameter-specific standardized forecast error ec,t(θc)for countryc, time periodt, and parameter vectorθcas
ec,t(θc) =
fc,t−E[fc,t|fc,t−1,θc] SD[fc,t|fc,t−1,θc]
= f
W P P
c,t −mˆc,t|fc,tW P P−1,θc
e σc,t
.
We define the standardized one-time-period-ahead forecast errorec,tas the average over the posterior samples of the parameter-specific forecast errors, namely
ec,t=
1
K K X
k=1
ec,t(θc(k)),
whereKis the number of parameter samples from the posterior distribution.
The standardized errors can be viewed as samples from a multivariate normal model with correlation matrixRt,et(θ)∼N(0, Rt)fort= 1955, ...,2010. Ideally we would estimate the correlation model parameters{κ,β0(1),β1(1),β2(1),β3(1),β0(2),β1(2),β2(2),β3(2)}
via maximum likelihood estimation based on the multivariate normal model. However, this is made challenging by the fact that for any time period t, the vector et contains standardized errors for only those countries that have started their fertility decline by time t, and that for many parameter values the estimated correlation matrix is not positive definite, making the likelihood undefined.
(1988)). This pseudo-likelihood is a composite marginal likelihood, and is more specif-ically referred to as a pairwise likelihood (PL) as is it the product of the marginal distri-butions of all country pairs (Cox and Reid (2004); see Varin, Reid, and Firth (2011) for a review). It is defined by
LPL(κ,ρ(1),ρ(2)|e) =
T Y
t=1
Y
i<j
L1(ρ (1)
i,j|ei,t, ej,t)·I[(fi,t−1< κ)and(fj,t−1< κ)]
+L2(ρ (2)
i,j|ei,t, ej,t)·I[(fi,t−1≥κ)or(fj,t−1≥κ)]
,
(4)
whereT is the number of observed time periods and I(A)is a indicator function that equals1if the conditionAis true and0otherwise. L1and L2are bivariate normal
like-lihoods with zero means, variances equal to one, and correlationsρ(1)i,j andρ(2)i,j, respec-tively.
The PL can be maximized separately over {β(1)0 , β(1)1 , β2(1), β3(1)} and{β0(2), β1(2), β2(2), β3(2)}for a fixed value ofκ. For each value of the thresholdκfrom 0.5 to 9 children at intervals of 0.1, we estimated the model parameters by maximizing the PL in (4) nu-merically using a Nelder-Mead method subject to the constraint that the correlationsρ(1)i,j
andρ(2)i,j, defined by theβs, lie in the interval[−1,1]for alliandj.
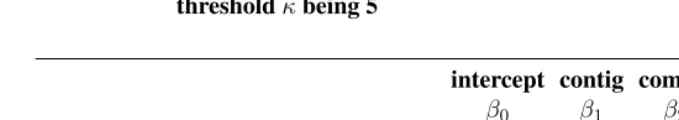
Table 5: Parameter estimates for correlation model (3) with estimate of the thresholdκbeing 5
intercept contig comcol sameRegion
β0 β1 β2 β3
Both country TFRs belowκ 0.11 0.26 0.05 0.09
At least one country TFR greater thanκ 0.05 0.06 0.00 0.02
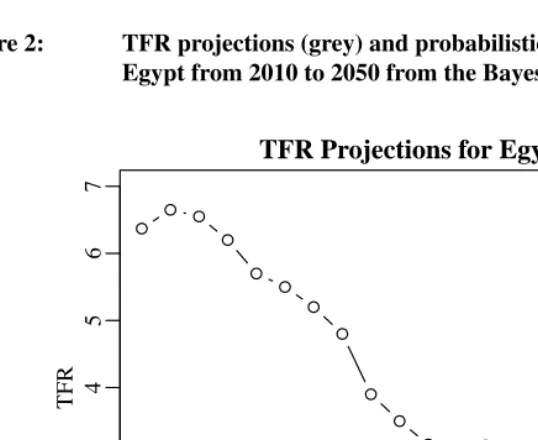
For many time periods, the PL estimates of the parameters result in estimated corre-lation matricesRtthat are symmetric but not positive semidefinite. However, the corre-lation matrix must be positive semidefinite to use it for simucorre-lation of forecast errors. The symmetric positive semidefinite matrix closest in Frobenius norm to a given symmetric matrix is obtained by zeroing out all negative eigenvalues of the original matrix (Driessel 2007) and then reconstructing the matrix. Thus, at each time pointtfor whichRtis not positive semidefinite, we perform the following procedure:
1. Compute the eigenvalue decomposition ofRtto express it asRt=U DUT, where Uis an orthogonal matrix of eigenvectors andDis a diagonal matrix of eigenvalues. 2. Replace all the negative eigenvalues by zero. The matrixDis thereby changed to
e D.
3. Compute the reconstructed matrixRet=UDUe T.
4. The diagonal elements ofRetwill not equal one unless the original matrix was posi-tive semidefinite. Therefore, treatRetas a covariance matrix and rescale it to obtain a reconstructed and rescaled correlation matrixRbtto use in the projections.
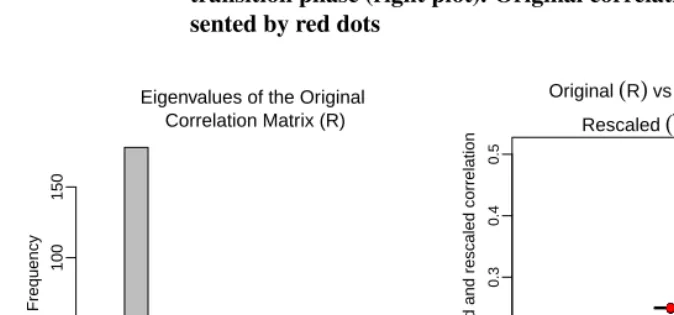
Figure 3: Histogram of the eigenvalues of the correlation matrixRt assum-ing all countries are in the post-transition phase (left plot) and boxplots of the correlation values from the reconstructed and rescaled correlation matrixRbtwhen all countries are in the post-transition phase (right plot). Original correlation values repre-sented by red dots
Eigenvalues of the Original Correlation Matrix (R)
Eigenvalues
Frequency
0 5 10 15 20 25
0 50 100 150 ● ● ● ● ● ● ● ● ● ● ● ● ● ● ● ● ● ● ● ● ● ● ● ● ● ● ● ● ● ● ● ● ● ● ● ● ● ● ● ● ● ● ● ● ● ● ● ● ● ● ● ● ● ● ● ● ● ● ● ● ● ● ● ● ● ● ● ● ● ● ● ● ● ● ● ● ● ● ● ● ● ● ● ● ● ● ● ● ● ● ● ● ● ● ● ● ● ● ● ● ● ● ● ● ● ● ● ● ● ● ● ● ● ● ● ● ● ● ● ● ● ● ● ● ● ● ● ● ● ● ● ● ● ● ● ● ● ● ● ● ● ● ● ● ● ● ● ● ● ● ● ● ● ● ● ● ● ● ● ● ● ● ● ● ● ● ● ● ● ● ● ● ● ● ● ● ● ● ● ● ● ● ● ● ● ● ● ● ● ● ● ● ● ● ● ● ● ● ● ● ● ● ● ● ● ● ● ● ● ● ● ● ● ● ● ● ● ● ● ● ● ● ● ● ● ● ● ● ● ● ● ● ● ● ● ● ● ● ● ● ● ● ● ● ● ● ● ● ● ● ● ● ● ● ● ● ● ● ● ● ● ● ● ● ● ● ● ● ● ● ● ● ● ● ● ● ● ● ● ● ● ● ● ● ● ● ● ● ● ● ● ● ● ● ● ● ● ● ● ● ● ● ● ● ● ● ● ● ● ● ● ● ● ● ● ● ● ● ● ● ● ● ● ● ● ● ● ● ● ● ● ● ● ● ● ● ● ● ● ● ● ● ● ● ● ● ● ● ● ● ● ● ● ● ● ● ● ● ● ● ● ● ● ● ● ● ● ● ● ● ● ● ● ● ● ● ● ● ● ● ● ● ● ● ● ● ● ● ● ● ● ● ● ● ● ● ● ● ● ● ● ● ● ● ● ● ● ● ● ● ● ● ● ● ● ● ● ● ● ● ● ● ● ● ● ● ● ● ● ● ● ● ● ● ● ● ● ● ● ● ● ● ● ● ● ● ● ● ● ● ● ● ● ● ● ● ● ● ● ● ● ● ● ● ● ● ● ● ● ● ● ● ● ● ● ● ● ● ● ● ● ● ● ● ● ● ● ● ● ● ● ● ● ● ● ● ● ● ● ● ● ● ● ● ● ● ● ● ● ● ● ● ● ● ● ● ● ● ● ● ● ● ● ● ● ● ● ● ● ● ● ● ● ● ● ● ● ● ● ● ● ● ● ● ● ● ● ● ● ● ● ● ● ● ● ● ● ● ● ● ● ● ● ● ● ● ● ● ● ● ● ● ● ● ● ● ● ● ● ● ● ● ● ● ● ● ● ● ● ● ● ● ● ● ● ● ● ● ● ● ● ● ● ● ● ● ● ● ● ● ● ● ● ● ● ● ● ● ● ● ● ● ● ● ● ● ● ● ● ● ● ● ● ● ● ● ● ● ● ● ● ● ● ● ● ● ● ● ● ● ● ● ● ● ● ● ● ● ● ● ● ● ● ● ● ● ● ● ● ● ● ● ● ● ● ● ● ● ● ● ● ● ● ● ● ● ● ● ● ● ● ● ● ● ● ● ● ● ● ● ● ● ● ● ● ● ● ● ● ● ● ● ● ● ● ● ● ● ● ● ● ● ● ● ● ● ● ● ● ● ● ● ● ● ● ● ● ● ● ● ● ● ● ● ● ● ● ● ● ● ● ● ● ● ● ● ● ● ● ● ● ● ● ● ● ● ● ● ● ● ● ● ● ● ● ● ● ● ● ● ● ● ● ● ● ● ● ● ● ● ● ● ● ● ● ● ● ● ● ● ● ● ● ● ● ● ● ● ● ● ● ● ● ● ● ● ● ● ● ● ● ● ● ● ● ● ● ● ● ● ● ● ● ● ● ● ● ● ● ● ● ● ● ● ● ● ● ● ● ● ● ● ● ● ● ● ● ● ● ● ● ● ● ● ● ● ● ● ● ● ● ● ● ● ● ● ● ● ● ● ● ● ● ● ● ● ● ● ● ● ● ● ● ● ● ● ● ● ● ● ● ● ● ● ● ● ● ● ● ● ● ● ● ● ● ● ● ● ● ● ● ● ● ● ● ● ● ● ● ● ● ● ● ● ● ● ● ● ● ● ● ● ● ● ● ● ● ● ● ● ● ● ● ● ● ● ● ● ● ● ● ● ● ● ● ● ● ● ● ● ● ● ● ● ● ● ● ● ● ● ● ● ● ● ● ● ● ● ● ● ● ● ● ● ● ● ● ● ● ● ● ● ● ● ● ● ● ● ● ● ● ● ● ● ● ● ● ● ● ● ● ● ● ● ● ● ● ● ● ● ● ● ● ● ● ● ● ● ● ● ● ● ● ● ● ● ● ● ● ● ● ● ● ● ● ● ● ● ● ● ● ● ● ● ● ● ● ● ● ● ● ● ● ● ● ● ● ● ● ● ● ● ● ● ● ● ● ● ● ● ● ● ● ● ● ● ● ● ● ● ● ● ● ● ● ● ● ● ● ● ● ● ● ● ● ● ● ● ● ● ● ● ● ● ● ● ● ● ● ● ● ● ● ● ● ● ● ● ● ● ● ● ● ● ● ● ● ● ● ● ● ● ● ● ● ● ● ● ● ● ● ● ● ● ● ● ● ● ● ● ● ● ● ● ● ● ● ● ● ● ● ● ● ● ● ● ● ● ● ● ● ● ● ● ● ● ● ● ● ● ● ● ● ● ● ● ● ● ● ● ● ● ● ● ● ● ● ● ● ● ● ● ● ● ● ● ● ● ● ● ● ● ● ● ● ● ● ● ● ● ● ● ● ● ● ● ● ● ● ● ● ● ● ● ● ● ● ● ● ● ● ● ● ● ● ● ● ● ● ● ● ● ● ● ● ● ● ● ● ● ● ● ● ● ● ● ● ● ● ● ● ● ● ● ● ● ● ● ● ● ● ● ● ● ● ● ● ● ● ● ● ● ● ● ● ● ● ● ● ● ● ● ● ● ● ● ● ● ● ● ● ● ● ● ● ● ● ● ● ● ● ● ● ● ● ● ● ● ● ● ● ● ● ● ● ● ● ● ● ● ● ● ● ● ● ● ● ● ● ● ● ● ● ● ● ● ● ● ● ● ● ● ● ● ● ● ● ● ● ● ● ● ● ● ● ● ● ● ● ● ● ● ● ● ● ● ● ● ● ● ● ● ● ● ● ● ● ● ● ● ● ● ● ● ● ● ● ● ● ● ● ● ● ● ● ● ● ● ● ● ● ● ● ● ● ● ● ● ● ● ● ● ● ● ● ● ● ● ● ● ● ● ● ● ● ● ● ● ● ● ● ● ● ● ● ● ● ● ● ● ● ● ● ● ● ● ● ● ● ● ● ● ● ● ● ● ● ● ● ● ● ● ● ● ● ● ● ● ● ● ● ● ● ● ● ● ● ● ● ● ● ● ● ● ● ● ● ● ● ● ● ● ● ● ● ● ● ● ● ● ● ● ● ● ● ● ● ● ● ● ● ● ● ● ● ● ● ● ● ● ● ● ● ● ● ● ● ● ● ● ● ● ● ● ● ● ● ● ● ● ● ● ● ● ● ● ● ● ● ● ● ● ● ● ● ● ● ● ● ● ● ● ● ● ● ● ● ● ● ● ● ● ● ● ● ● ● ● ● ● ● ● ● ● ● ● ● ● ● ● ● ● ● ● ● ● ● ● ● ● ● ● ● ● ● ● ● ● ● ● ● ● ● ● ● ● ● ● ● ● ● ● ● ● ● ● ● ● ● ● ● ● ● ● ● ● ● ● ● ● ● ● ● ● ● ● ● ● ● ● ● ● ● ● ● ● ● ● ● ● ● ● ● ● ● ● ● ● ● ● ● ● ● ● ● ● ● ● ● ● ● ● ● ● ● ● ● ● ● ● ● ● ● ● ● ● ● ● ● ● ● ● ● ● ● ● ● ● ● ● ● ● ● ● ● ● ● ● ● ● ● ● ● ● ● ● ● ● ● ● ● ● ● ● ● ● ● ● ● ● ● ● ● ● ● ● ● ● ● ● ● ● ● ● ● ● ● ● ● ● ● ● ● ● ● ● ● ● ● ● ● ● ● ● ● ● ● ● ● ● ● ● ● ● ● ● ● ● ● ● ● ● ● ● ● ● ● ● ● ● ● ● ● ● ● ● ● ● ● ● ● ● ● ● ● ● ● ● ● ● ● ● ● ● ● ● ● ● ● ● ● ● ● ● ● ● ● ● ● ● ● ● ● ● ● ● ● ● ● ● ● ● ● ● ● ● ● ● ● ● ● ● ● ● ● ● ● ● ● ● ● ● ● ● ● ● ● ● ● ● ● ● ● ● ● ● ● ● ● ● ● ● ● ● ● ● ● ● ● ● ● ● ● ● ● ● ● ● ● ● ● ● ● ● ● ● ● ● ● ● ● ● ● ● ● ● ● ● ● ● ● ● ● ● ● ● ● ● ● ● ● ● ● ● ● ● ● ● ● ● ● ● ● ● ● ● ● ● ● ● ● ● ● ● ● ● ● ● ● ● ● ● ● ● ● ● ● ● ● ● ● ● ● ● ● ● ● ● ● ● ● ● ● ● ● ● ● ● ● ● ● ● ● ● ● ● ● ● ● ● ● ● ● ● ● ● ● ● ● ● ● ● ● ● ● ● ● ● ● ● ● ● ● ● ● ● ● ● ● ● ● ● ● ● ● ● ● ● ● ● ● ● ● ● ● ● ● ● ● ● ● ● ● ● ● ● ● ● ● ● ● ● ● ● ● ● ● ● ● ● ● ● ● ● ● ● ● ● ● ● ● ● ● ● ● ● ● ● ● ● ● ● ● ● ● ● ● ● ● ● ● ● ● ● ● ● ● ● ● ● ● ● ● ● ● ● ● ● ● ● ● ● ● ● ● ● ● ● ● ● ● ● ● ● ● ● ● ● ● ● ● ● ● ● ● ● ● ● ● ● ● ● ● ● ● ● ● ● ● ● ● ● ● ● ● ● ● ● ● ● ● ● ● ● ● ● ● ● ● ● ● ● ● ● ● ● ● ● ● ● ● ● ● ● ● ● ● ● ● ● ● ● ● ● ● ● ● ● ● ● ● ● ● ● ● ● ● ● ● ● ● ● ● ● ● ● ● ● ● ● ● ● ● ● ● ● ● ● ● ● ● ● ● ● ● ● ● ● ● ● ● ● ● ● ● ● ● ● ● ● ● ● ● ● ● ● ● ● ● ● ● ● ● ● ● ● ● ● ● ● ● ● ● ● ● ● ● ● ● ● ● ● ● ● ● ● ● ● ● ● ● ● ● ● ● ● ● ● ● ● ● ● ● ● ● ● ● ● ● ● ● ● ● ● ● ● ● ● ● ● ● ● ● ● ● ● ● ● ● ● ● ● ● ● ● ● ● ● ● ● ● ● ● ● ● ● ● ● ● ● ● ● ● ● ● ● ● ● ● ● ● ● ● ● ● ● ● ● ● ● ● ● ● ● ● ● ● ● ● ● ● ● ● ● ● ● ● ● ● ● ● ● ● ● ● ● ● ● ● ● ● ● ● ● ● ● ● ● ● ● ● ● ● ● ● ● ● ● ● ● ● ● ● ● ● ● ● ● ● ● ● ● ● ● ● ● ● ● ● ● ● ● ● ● ● ● ● ● ● ● ● ● ● ● ● ● ● ● ● ● ● ● ● ● ● ● ● ● ● ● ● ● ● ● ● ● ● ● ● ● ● ● ● ● ● ● ● ● ● ● ● ● ● ● ● ● ● ● ● ● ● ● ● ● ● ● ● ● ● ● ● ● ● ● ● ● ● ● ● ● ● ● ● ● ● ● ● ● ● ● ● ● ● ● ● ● ● ● ● ● ● ● ● ● ● ● ● ● ● ● ● ● ● ● ● ● ● ● ● ● ● ● ● ● ● ● ● ● ● ● ● ● ● ● ● ● ● ● ● ● ● ● ● ● ● ● ● ● ● ● ● ● ● ● ● ● ● ● ● ● ● ● ● ● ● ● ● ● ● ● ● ● ● ● ● ● ● ● ● ● ● ● ● ● ● ● ● ● ● ● ● ● ● ● ● ● ● ● ● ● ● ● ● ● ● ● ● ● ● ● ● ● ● ● ● ● ● ● ● ● ● ● ● ● ● ● ● ● ● ● ● ● ● ● ● ● ● ● ● ● ● ● ● ● ● ● ● ● ● ● ● ● ● ● ● ● ● ● ● ● ● ● ● ● ● ● ● ● ● ● ● ● ● ● ● ● ● ● ● ● ● ● ● ● ● ● ● ● ● ● ● ● ● ● ● ● ● ● ● ● ● ● ● ● ● ● ● ● ● ● ● ● ● ● ● ● ● ● ● ● ● ● ● ● ● ● ● ● ● ● ● ● ● ● ● ● ● ● ● ● ● ● ● ● ● ● ● ● ● ● ● ● ● ● ● ● ● ● ● ● ● ● ● ● ● ● ● ● ● ● ● ● ● ● ● ● ● ● ● ● ● ● ● ● ● ● ● ● ● ● ● ● ● ● ● ● ● ● ● ● ● ● ● ● ● ● ● ● ● ● ● ● ● ● ● ● ● ● ● ● ● ● ● ● ● ● ● ● ● ● ● ● ● ● ● ● ● ● ● ● ● ● ● ● ● ● ● ● ● ● ● ● ● ● ● ● ● ● ● ● ● ● ● ● ● ● ● ● ● ● ● ● ● ● ● ● ● ● ● ● ● ● ● ● ● ● ● ● ● ● ● ● ● ● ● ● ● ● ● ● ● ● ● ● ● ● ● ● ● ● ● ● ● ● ● ● ● ● ● ● ● ● ● ● ● ● ● ● ● ● ● ● ● ● ● ● ● ● ● ● ● ● ● ● ● ● ● ● ● ● ● ● ● ● ● ● ● ● ● ● ● ● ● ● ● ● ● ● ● ● ● ● ● ● ● ● ● ● ● ● ● ● ● ● ● ● ● ● ● ● ● ● ● ● ● ● ● ● ● ● ● ● ● ● ● ● ● ● ● ● ● ● ● ● ● ● ● ● ● ● ● ● ● ● ● ● ● ● ● ● ● ● ● ● ● ● ● ● ● ● ● ● ● ● ● ● ● ● ● ● ● ● ● ● ● ● ● ● ● ● ● ● ● ● ● ● ● ● ● ● ● ● ● ● ● ● ● ● ● ● ● ● ● ● ● ● ● ● ● ● ● ● ● ● ● ● ● ● ● ● ● ● ● ● ● ● ● ● ● ● ● ● ● ● ● ● ● ● ● ● ● ● ● ● ● ● ● ● ● ● ● ● ● ● ● ● ● ● ● ● ● ● ● ● ● ● ● ● ● ● ● ● ● ● ● ● ● ● ● ● ● ● ● ● ● ● ● ● ● ● ● ● ● ● ● ● ● ● ● ● ● ● ● ● ● ● ● ● ● ● ● ● ● ● ● ● ● ● ● ● ● ● ● ● ● ● ● ● ● ● ● ● ● ● ● ● ● ● ● ● ● ● ● ● ● ● ● ● ● ● ● ● ● ● ● ● ● ● ● ● ● ● ● ● ● ● ● ● ● ● ● ● ● ● ● ● ● ● ● ● ● ● ● ● ● ● ● ● ● ● ● ● ● ● ● ● ● ● ● ● ● ● ● ● ● ● ● ● ● ● ● ● ● ● ● ● ● ● ● ● ● ● ● ● ● ● ● ● ● ● ● ● ● ● ● ● ● ● ● ● ● ● ● ● ● ● ● ● ● ● ● ● ● ● ● ● ● ● ● ● ● ● ● ● ● ● ● ● ● ● ● ● ● ● ● ● ● ● ● ● ● ● ● ● ● ● ● ● ● ● ● ● ● ● ● ● ● ● ● ● ● ● ● ● ● ● ● ● ● ● ● ● ● ● ● ● ● ● ● ● ● ● ● ● ● ● ● ● ● ● ● ● ● ● ● ● ● ● ● ● ● ● ● ● ● ● ● ● ● ● ● ● ● ● ● ● ● ● ● ● ● ● ● ● ● ● ● ● ● ● ● ● ● ● ● ● ● ● ● ● ● ● ● ● ● ● ● ● ● ● ● ● ● ● ● ● ● ● ● ● ● ● ● ● ● ● ● ● ● ● ● ● ● ● ● ● ● ● ● ● ● ● ● ● ● ● ● ● ● ● ● ● ● ● ● ● ● ● ● ● ● ● ● ● ● ● ● ● ● ● ● ● ● ● ● ● ● ● ● ● ● ● ● ● ● ● ● ● ● ● ● ● ● ● ● ● ● ● ● ● ● ● ● ● ● ● ● ● ● ● ● ● ● ● ● ● ● ● ● ● ● ● ● ● ● ● ● ● ● ● ● ● ● ● ● ● ● ● ● ● ● ● ● ● ● ● ● ● ● ● ● ● ● ● ● ● ● ● ● ● ● ● ● ● ● ● ● ● ● ● ● ● ● ● ● ● ● ● ● ● ● ● ● ● ● ● ● ● ● ● ● ● ● ● ● ● ● ● ● ● ● ● ● ● ● ● ● ● ● ● ● ● ● ● ● ● ● ● ● ● ● ● ● ● ● ● ● ● ● ● ● ● ● ● ● ● ● ● ● ● ● ● ● ● ● ● ● ● ● ● ● ● ● ● ● ● ● ● ● ● ● ● ● ● ● ● ● ● ● ● ● ● ● ● ● ● ● ● ● ● ● ● ● ● ● ● ● ● ● ● ● ● ● ● ● ● ● ● ● ● ● ● ● ● ● ● ● ● ● ● ● ● ● ● ● ● ● ● ● ● ● ● ● ● ● ● ● ● ● ● ● ● ● ● ● ● ● ● ● ● ● ● ● ● ● ● ● ● ● ● ● ● ● ● ● ● ● ● ● ● ● ● ● ● ● ● ● ● ● ● ● ● ● ● ● ● ● ● ● ● ● ● ● ● ● ● ● ● ● ● ● ● ● ● ● ● ● ● ● ● ● ● ● ● ● ● ● ● ● ● ● ● ● ● ● ● ● ● ● ● ● ● ● ● ● ● ● ● ● ● ● ● ● ● ● ● ● ● ● ● ● ● ● ● ● ● ● ● ● ● ● ● ● ● ● ● ● ● ● ● ● ● ● ● ● ● ● ● ● ● ● ● ● ● ● ● ● ● ● ● ● ● ● ● ● ● ● ● ● ● ● ● ● ● ● ● ● ● ● ● ● ● ● ● ● ● ● ● ● ● ● ● ● ● ● ● ● ● ● ● ● ● ● ● ● ● ● ● ● ● ● ● ● ● ● ● ● ● ● ● ● ● ● ● ● ● ● ● ● ● ● ● ● ● ● ● ● ● ● ● ● ● ● ● ● ● ● ● ● ● ● ● ● ● ● ● ● ● ● ● ● ● ● ● ● ● ● ● ● ● ● ● ● ● ● ● ● ● ● ● ● ● ● ● ● ● ● ● ● ● ● ● ● ● ● ● ● ● ● ● ● ● ● ● ● ● ● ● ● ● ● ● ● ● ● ● ● ● ● ● ● ● ● ● ● ● ● ● ● ● ● ● ● ● ● ● ● ● ● ● ● ● ● ● ● ● ● ● ● ● ● ● ● ● ● ● ● ● ● ● ● ● ● ● ● ● ● ● ● ● ● ● ● ● ● ● ● ● ● ● ● ● ● ● ● ● ● ● ● ● ● ● ● ● ● ● ● ● ● ● ● ● ● ● ● ● ● ● ● ● ● ● ● ● ● ● ● ● ● ● ● ● ● ● ● ● ● ● ● ● ● ● ● ● ● ● ● ● ● ● ● ● ● ● ● ● ● ● ● ● ● ● ● ● ● ● ● ● ● ● ● ● ● ● ● ● ● ● ● ● ● ● ● ● ● ● ● ● ● ● ● ● ● ● ● ● ● ● ● ● ● ● ● ● ● ● ● ● ● ● ● ● ● ● ● ● ● ● ● ● ● ● ● ● ● ● ● ● ● ● ● ● ● ● ● ● ● ● ● ● ● ● ● ● ● ● ● ● ● ● ● ● ● ● ● ● ● ● ● ● ● ● ● ● ● ● ● ● ● ● ● ● ● ● ● ● ● ● ● ● ● ● ● ● ● ● ● ● ● ● ● ● ● ● ● ● ● ● ● ● ● ● ● ● ● ● ● ● ● ● ● ● ● ● ● ● ● ● ● ● ● ● ● ● ● ● ● ● ● ● ● ● ● ● ● ● ● ● ● ● ● ● ● ● ● ● ● ● ● ● ● ● ● ● ● ● ● ● ● ● ● ● ● ● ● ● ● ● ● ● ● ● ● ● ● ● ● ● ● ● ● ● ● ● ● ● ● ● ● ● ● ● ● ● ● ● ● ● ● ● ● ● ● ● ● ● ● ● ● ● ● ● ● ● ● ● ● ● ● ● ● ● ● ● ● ● ● ● ● ● ● ● ● ● ● ● ● ● ● ● ● ● ● ● ● ● ● ● ● ● ● ● ● ● ● ● ● ● ● ● ● ● ● ● ● ● ● ● ● ● ● ● ● ● ● ● ● ● ● ● ● ● ● ● ● ● ● ● ● ● ● ● ● ● ● ● ● ● ● ● ● ● ● ● ● ● ● ● ● ● ● ● ● ● ● ● ● ● ● ● ● ● ● ● ● ● ● ● ● ● ● ● ● ● ● ● ● ● ● ● ● ● ● ● ● ● ● ● ● ● ● ● ● ● ● ● ● ● ● ● ● ● ● ● ● ● ● ● ● ● ● ● ● ● ● ● ● ● ● ● ● ● ● ● ● ● ● ● ● ● ● ● ● ● ● ● ● ● ● ● ● ● ● ● ● ● ● ● ● ● ● ● ● ● ● ● ● ● ● ● ● ● ● ● ● ● ● ● ● ● ● ● ● ● ● ● ● ● ● ● ● ● ● ● ● ● ● ● ● ● ● ● ● ● ● ● ● ● ● ● ● ● ● ● ● ● ● ● ● ● ● ● ● ● ● ● ● ● ● ● ● ● ● ● ● ● ● ● ● ● ● ● ● ● ● ● ● ● ● ● ● ● ● ● ● ● ● ● ● ● ● ● ● ● ● ● ● ● ● ● ● ● ● ● ● ● ● ● ● ● ● ● ● ● ● ● ● ● ● ● ● ● ● ● ● ● ● ● ● ● ● ● ● ● ● ● ● ● ● ● ● ● ● ● ● ● ● ● ● ● ● ● ● ● ● ● ● ● ● ● ● ● ● ● ● ● ● ● ● ● ● ● ● ● ● ● ● ● ● ● ● ● ● ● ● ● ● ● ● ● ● ● ● ● ● ● ● ● ● ● ● ● ● ● ● ● ● ● ● ● ● ● ● ● ● ● ● ● ● ● ● ● ● ● ● ● ● ● ● ● ● ● ● ● ● ● ● ● ● ● ● ● ● ● ● ● ● ● ● ● ● ● ● ● ● ● ● ● ● ● ● ● ● ● ● ● ● ● ● ● ● ● ● ● ● ● ● ● ● ● ● ● ● ● ● ● ● ● ● ● ● ● ● ● ● ● ● ● ● ● ● ● ● ● ● ● ● ● ● ● ● ● ● ● ● ● ● ● ● ● ● ● ● ● ● ● ● ● ● ● ● ● ● ● ● ● ● ● ● ● ● ● ● ● ● ● ● ● ● ● ● ● ● ● ● ● ● ● ● ● ● ● ● ● ● ● ● ● ● ● ● ● ● ● ● ● ● ● ● ● ● ● ● ● ● ● ● ● ● ● ● ● ● ● ● ● ● ● ● ● ● ● ● ● ● ● ● ● ● ● ● ● ● ● ● ● ● ● ● ● ● ● ● ● ● ● ● ● ● ● ● ● ● ● ● ● ● ● ● ● ● ● ● ● ● ● ● ● ● ● ● ● ● ● ● ● ● ● ● ● ● ● ● ● ● ● ● ● ● ● ● ● ● ● ● ● ● ● ● ● ● ● ● ● ● ● ● ● ● ● ● ● ● ● ● ● ● ● ● ● ● ● ● ● ● ● ● ● ● ● ● ● ● ● ● ● ● ● ● ● ● ● ● ● ● ● ● ● ● ● ● ● ● ● ● ● ● ● ● ● ● ● ● ● ● ● ● ● ● ● ● ● ● ● ● ● ● ● ● ● ● ● ● ● ● ● ● ● ● ● ● ● ● ● ● ● ● ● ● ● ● ● ● ● ● ● ● ● ● ● ● ● ● ● ● ● ● ● ● ● ● ● ● ● ● ● ● ● ● ● ● ● ● ● ● ● ● ● ● ● ● ● ● ● ● ● ● ● ● ● ● ● ● ● ● ● ● ● ● ● ● ● ● ● ● ● ● ● ● ● ● ● ● ● ● ● ● ● ● ● ● ● ● ● ● ● ● ● ● ● ● ● ● ● ● ● ● ● ● ● ● ● ● ● ● ● ● ● ● ● ● ● ● ● ● ● ● ● ● ● ● ● ● ● ● ● ● ● ● ● ● ● ● ● ● ● ● ● ● ● ● ● ● ● ● ● ● ● ● ● ● ● ● ● ● ● ● ● ● ● ● ● ● ● ● ● ● ● ● ● ● ● ● ● ● ● ● ● ● ● ● ● ● ● ● ● ● ● ● ● ● ● ● ● ● ● ● ● ● ● ● ● ● ● ● ● ● ● ● ● ● ● ● ● ● ● ● ● ● ● ● ● ● ● ● ● ● ● ● ● ● ● ● ● ● ● ● ● ● ● ● ● ● ● ● ● ● ● ● ● ● ● ● ● ● ● ● ● ● ● ● ● ● ● ● ● ● ● ● ● ● ● ● ● ● ● ● ● ● ● ● ● ● ● ● ● ● ● ● ● ● ● ● ● ● ● ● ● ● ● ● ● ● ● ● ● ● ● ● ● ● ● ● ● ● ● ● ● ● ● ● ● ● ● ● ● ● ● ● ● ● ● ● ● ● ● ● ● ● ● ● ● ● ● ● ● ● ● ● ● ● ● ● ● ● ● ● ● ● ● ● ● ● ● ● ● ● ● ● ● ● ● ● ● ● ● ● ● ● ● ● ● ● ● ● ● ● ● ● ● ● ● ● ● ● ● ● ● ● ● ● ● ● ● ● ● ● ● ● ● ● ● ● ● ● ● ● ● ● ● ● ● ● ● ● ● ● ● ● ● ● ● ● ● ● ● ● ● ● ● ● ● ● ● ● ● ● ● ● ● ● ● ● ● ● ● ● ● ● ● ● ● ● ● ● ● ● ● ● ● ● ● ● ● ● ● ● ● ● ● ● ● ● ● ● ● ● ● ● ● ● ● ● ● ● ● ● ● ● ● ● ● ● ● ● ● ● ● ● ● ● ● ● ● ● ● ● ● ● ● ● ● ● ● ● ● ● ● ● ● ● ● ● ● ● ● ● ● ● ● ● ● ● ● ● ● ● ● ● ● ● ● ● ● ● ● ● ● ● ● ● ● ● ● ● ● ● ● ● ● ● ● ● ● ● ● ● ● ● ● ● ● ● ● ● ● ● ● ● ● ● ● ● ● ● ● ● ● ● ● ● ● ● ● ● ● ● ● ● ● ● ● ● ● ● ● ● ● ● ● ● ● ● ● ● ● ● ● ● ● ● ● ● ● ● ● ● ● ● ● ● ● ● ● ● ● ● ● ● ● ● ● ● ● ● ● ● ● ● ● ● ● ● ● ● ● ● ● ● ● ● ● ● ● ● ● ● ● ● ● ● ● ● ● ● ● ● ● ● ● ● ● ● ● ● ● ● ● ● ● ● ● ● ● ● ● ● ● ● ● ● ● ● ● ● ● ● ● ● ● ● ● ● ● ● ● ● ● ● ● ● ● ● ● ● ● ● ● ● ● ● ● ● ● ● ● ● ● ● ● ● ● ● ● ● ● ● ● ● ● ● ● ● ● ● ● ● ● ● ● ● ● ● ● ● ● ● ● ● ● ● ● ● ● ● ● ● ● ● ● ● ● ● ● ● ● ● ● ● ● ● ● ● ● ● ● ● ● ● ● ● ● ● ● ● ● ● ● ● ● ● ● ● ● ● ● ● ● ● ● ● ● ● ● ● ● ● ● ● ● ● ● ● ● ● ● ● ● ● ● ● ● ● ● ● ● ● ● ● ● ● ● ● ● ● ● ● ● ● ● ● ● ● ● ● ● ● ● ● ● ● ● ● ● ● ● ● ● ● ● ● ● ● ● ● ● ● ● ● ● ● ● ● ● ● ● ● ● ● ● ● ● ● ● ● ● ● ● ● ● ● ● ● ● ● ● ● ● ● ● ● ● ● ● ● ● ● ● ● ● ● ● ● ● ● ● ● ● ● ● ● ● ● ● ● ● ● ● ● ● ● ● ● ● ● ● ● ● ● ● ● ● ● ● ● ● ● ● ● ● ● ● ● ● ● ● ● ● ● ● ● ● ● ● ● ● ● ● ● ● ● ● ● ● ● ● ● ● ● ● ● ● ● ● ● ● ● ● ● ● ● ● ● ● ● ● ● ● ● ● ● ● ● ● ● ● ● ● ● ● ● ● ● ● ● ● ● ● ● ● ● ● ● ● ● ● ● ● ● ● ● ● ● ● ● ● ● ● ● ● ● ● ● ● ● ● ● ● ● ● ● ● ● ● ● ● ● ● ● ● ● ● ● ● ● ● ● ● ● ● ● ● ● ● ● ● ● ● ● ● ● ● ● ● ● ● ● ● ● ● ● ● ● ● ● ● ● ● ● ● ● ● ● ● ● ● ● ● ● ● ● ● ● ● ● ● ● ● ● ● ● ● ● ● ● ● ● ● ● ● ● ● ● ● ● ● ● ● ● ● ● ● ● ● ● ● ● ● ● ● ● ● ● ● ● ● ● ● ● ● ● ● ● ● ● ● ● ● ● ● ● ● ● ● ● ● ● ● ● ● ● ● ● ● ● ● ● ● ● ● ● ● ● ● ● ● ● ● ● ● ● ● ● ● ● ● ● ● ● ● ● ● ● ● ● ● ● ● ● ● ● ● ● ● ● ● ● ● ● ● ● ● ● ● ● ● ● ● ● ● ● ● ● ● ● ● ● ● ● ● ● ● ● ● ● ● ● ● ● ● ● ● ● ● ● ● ● ● ● ● ● ● ● ● ● ● ● ● ● ● ● ● ● ● ● ● ● ● ● ● ● ● ● ● ● ● ● ● ● ● ● ● ● ● ● ● ● ● ● ● ● ● ● ● ● ● ● ● ● ● ● ● ● ● ● ● ● ● ● ● ● ● ● ● ● ● ● ● ● ● ● ● ● ● ● ● ● ● ● ● ● ● ● ● ● ● ● ● ● ● ● ● ● ● ● ● ● ● ● ● ● ● ● ● ● ● ● ● ● ● ● ● ● ● ● ● ● ● ● ● ● ● ● ● ● ● ● ● ● ● ● ● ● ● ● ● ● ● ● ● ● ● ● ● ● ● ● ● ● ● ● ● ● ● ● ● ● ● ● ● ● ● ● ● ● ● ● ● ● ● ● ● ● ● ● ● ● ● ● ● ● ● ● ● ● ● ● ● ● ● ● ● ● ● ● ● ● ● ● ● ● ● ● ● ● ● ● ● ● ● ● ● ● ● ● ● ● ● ● ● ● ● ● ● ● ● ● ● ● ● ● ● ● ● ● ● ● ● ● ● ● ● ● ● ● ● ● ● ● ● ● ● ● ● ● ● ● ● ● ● ● ● ● ● ● ● ● ● ● ● ● ● ● ● ● ● ● ● ● ● ● ● ● ● ● ● ● ● ● ● ● ● ● ● ● ● ● ● ● ● ● ● ● ● ● ● ● ● ● ● ● ● ● ● ● ● ● ● ● ● ● ● ● ● ● ● ● ● ● ● ● ● ● ● ● ● ● ● ● ● ● ● ● ● ● ● ● ● ● ● ● ● ● ● ● ● ● ● ● ● ● ● ● ● ● ● ● ● ● ● ● ● ● ● ● ● ● ● ● ● ● ● ● ● ● ● ● ● ● ● ● ● ● ● ● ● ● ● ● ● ● ● ● ● ● ● ● ● ● ● ● ● ● ● ● ● ● ● ● ● ● ● ● ● ● ● ● ● ● ● ● ● ● ● ● ● ● ● ● ● ● ● ● ● ● ● ● ● ● ● ● ● ● ● ● ● ● ● ● ● ● ● ● ● ● ● ● ● ● ● ● ● ● ● ● ● ● ● ● ● ● ● ● ● ● ● ● ● ● ● ● ● ● ● ● ● ● ● ● ● ● ● ● ● ● ● ● ● ● ● ● ● ● ● ● ● ● ● ● ● ● ● ● ● ● ● ● ● ● ● ● ● ● ● ● ● ● ● ● ● ● ● ● ● ● ● ● ● ● ● ● ● ● ● ● ● ● ● ● ● ● ● ● ● ● ● ● ● ● ● ● ● ● ● ● ● ● ● ● ● ● ● ● ● ● ● ● ● ● ● ● ● ● ● ● ● ● ● ● ● ● ● ● ● ● ● ● ● ● ● ● ● ● ● ● ● ● ● ● ● ● ● ● ● ● ● ● ● ● ● ● ● ● ● ● ● ● ● ● ● ● ● ● ● ● ● ● ● ● ● ● ● ● ● ● ● ● ● ● ● ● ● ● ● ● ● ● ● ● ● ● ● ● ● ● ● ● ● ● ● ● ● ● ● ● ● ● ● ● ● ● ● ● ● ● ● ● ● ● ● ● ● ● ● ● ● ● ● ● ● ● ● ● ● ● ● ● ● ● ● ● ● ● ● ● ● ● ● ● ● ● ● ● ● ● ● ● ● ● ● ● ● ● ● ● ● ● ● ● ● ● ● ● ● ● ● ● ● ● ● ● ● ● ● ● ● ● ● ● ● ● ● ● ● ● ● ● ● ● ● ● ● ● ● ● ● ● ● ● ● ● ● ● ● ● ● ● ● ● ● ● ● ● ● ● ● ● ● ● ● ● ● ● ● ● ● ● ● ● ● ● ● ● ● ● ● ● ● ● ● ● ● ● ● ● ● ● ● ● ● ● ● ● ● ● ● ● ● ● ● ● ● ● ● ● ● ● ● ● ● ● ● ● ● ● ● ● ● ● ● ● ● ● ● ● ● ● ● ● ● ● ● ● ● ● ● ● ● ● ● ● ● ● ● ● ● ● ● ● ● ● ● ● ● ● ● ● ● ● ● ● ● ● ● ● ● ● ● ● ● ● ● ● ● ● ● ● ● ● ● ● ● ● ● ● ● ● ● ● ● ● ● ● ● ● ● ● ● ● ● ● ● ● ● ● ● ● ● ● ● ● ● ● ● ● ● ● ● ● ● ● ● ● ● ● ● ● ● ● ● ● ● ● ● ● ● ● ● ● ● ● ● ● ● ● ● ● ● ● ● ● ● ● ● ● ● ● ● ● ● ● ● ● ● ● ● ● ● ● ● ● ● ● ● ● ● ● ● ● ● ● ● ● ● ● ● ● ● ● ● ● ● ● ● ● ● ● ● ● ● ● ● ● ● ● ● ● ● ● ● ● ● ● ● ● ● ● ● ● ● ● ● ● ● ● ● ● ● ● ● ● ● ● ● ● ● ● ● ● ● ● ● ● ● ● ● ● ● ● ● ● ● ● ● ● ● ● ● ● ● ● ● ● ● ● ● ● ● ● ● ● ● ● ● ● ● ● ● ● ● ● ● ● ● ● ● ● ● ● ● ● ● ● ● ● ● ● ● ● ● ● ● ● ● ● ● ● ● ● ● ● ● ● ● ● ● ● ● ● ● ● ● ● ● ● ● ● ● ● ● ● ● ● ● ● ● ● ● ● ● ● ● ● ● ● ● ● ● ● ● ● ● ● ● ● ● ● ● ● ● ● ● ● ● ● ● ● ● ● ● ● ● ● ● ● ● ● ● ● ● ● ● ● ● ● ● ● ● ● ● ● ● ● ● ● ● ● ● ● ● ● ● ● ● ● ● ● ● ● ● ● ● ● ● ● ● ● ● ● ● ● ● ● ● ● ● ● ● ● ● ● ● ● ● ● ● ● ● ● ● ● ● ● ● ● ● ● ● ● ● ● ● ● ● ● ● ● ● ● ● ● ● ● ● ● ● ● ● ● ● ● ● ● ● ● ● ● ● ● ● ● ● ● ● ● ● ● ● ● ● ● ● ● ● ● ● ● ● ● ● ● ● ● ● ● ● ● ● ● ● ● ● ● ● ● ● ● ● ● ● ● ● ● ● ● ● ● ● ● ● ● ● ● ● ● ● ● ● ● ● ● ● ● ● ● ● ● ● ● ● ● ● ● ● ● ● ● ● ● ● ● ● ● ● ● ● ● ● ● ● ● ● ● ● ● ● ● ● ● ● ● ● ● ● ● ● ● ● ● ● ● ● ● ● ● ● ● ● ● ● ● ● ● ● ● ● ● ● ● ● ● ● ● ● ● ● ● ● ● ● ● ● ● ● ● ● ● ● ● ● ● ● ● ● ● ● ● ● ● ● ● ● ● ● ● ● ● ● ● ● ● ● ● ● ● ● ● ● ● ● ● ● ● ● ● ● ● ● ● ● ● ● ● ● ● ● ● ● ● ● ● ● ● ● ● ● ● ● ● ● ● ● ● ● ● ● ● ● ● ● ● ● ● ● ● ● ● ● ● ● ● ● ● ● ● ● ● ● ● ● ● ● ● ● ● ● ● ● ● ● ● ● ● ● ● ● ● ● ● ● ● ● ● ● ● ● ● ● ● ● ● ● ● ● ● ● ● ● ● ● ● ● ● ● ● ● ● ● ● ● ● ● ● ● ● ● ● ● ● ● ● ● ● ● ● ● ● ● ● ● ● ● ● ● ● ● ● ● ● ● ● ● ● ● ● ● ● ● ● ● ● ● ● ● ● ● ● ● ● ● ● ● ● ● ● ● ● ● ● ● ● ● ● ● ● ● ● ● ● ● ● ● ● ● ● ● ● ● ● ● ● ● ● ● ● ● ● ● ● ● ● ● ● ● ● ● ● ● ● ● ● ● ● ● ● ● ● ● ● ● ● ● ● ● ● ● ● ● ● ● ● ● ● ● ●●●●●●●● ● ● ● ● ● ● ● ● ● ● ● ● ● ● ● ● ● ● ● ● ● ● ● ● ● ● ● ● ● ● ● ● ● ● ● ● ● ● ● ● ● ● ● ● ● ● ● ● ● ● ● ● ● ● ● ● ● ● ● ● ● ● ● ● ● ● ● ● ● ● ● ● ● ● ● ● ● ● ● ● ● ●
0.11 0.16 0.2 0.25 0.37 0.42 0.46 0.51
0.1
0.2
0.3
0.4
0.5
Original(R)vsReconstructedand
Rescaled(R)Correlations
Original correlation
Reconstr
ucted and rescaled correlation
● ● ● ● ● ● ● ● ● ● Original (R)
Reconstructed and rescaled (R)
4.
Results
4.1 Model validation
We assessed the model by estimating the current hierarchical model parameters from the data for 1950 to 1990, projecting regional TFR for the UN’s 22 primary regions from 1990 to 2010 using the error correlation structure, and comparing the probabilistic projections with the actual observations for the four held-out five-year periods. We approximated regional TFR by a weighted average of country-specific TFRs, with weights proportional to the current female populations of each country. A similar approximation was used for regional life expectancy by Raftery et al. (2013b).
errors and using our proposed error correlation structure. The predictive distributions of the weighted average TFR for each of the 22 regions were compared to the observed weighted average values.
Table 6 shows the proportion of observed weighted averages that fell within the 80%, 90%, and 95% prediction intervals from both approaches. In each case the observed proportion was closer or as close to the theoretical value under the correlation model than under the independence model.
Table 6: Proportion of observed regional weighted average TFRs that fall
within the specified prediction intervals (PI)
Time Period Model 80% PI 90% PI 95% PI
1990-1995 Independence 0.73 0.86 0.95
Correlation 0.86 0.91 0.95
1995-2000 Independence 0.68 0.73 0.86
Correlation 0.73 0.86 0.95
2000-2005 Independence 0.59 0.73 0.82
Correlation 0.64 0.73 0.95
2005-2010 Independence 0.73 0.82 0.91
Correlation 0.77 0.86 0.91
All Independence 0.68 0.78 0.89
Correlation 0.75 0.84 0.94
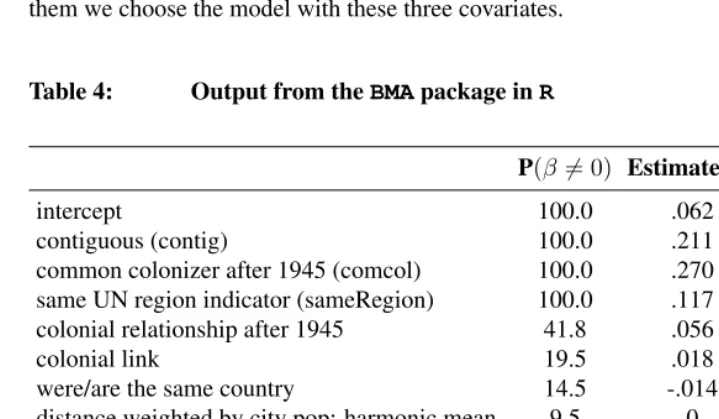
Figure 4: Boxplots showing the 80% and 95% prediction intervals for the regional weighted average TFR for the current model assuming independent errors and that with the correlation error structure. Boxes represent the 80% prediction interval, ends of the whiskers mark the 95% prediction interval. The corresponding observed average TFR based on the 2010 WPP is also shown.
1.5
2.0
2.5
Northern Europe
Time Period
Re
gional TFR
1990 1995 2000 2005
●
Independence Correlation WPP 2010
● ●
● ●
● ●
● ●
2
3
4
5
Central Asia
Time Period
Re
gional TFR
1990 1995 2000 2005
●
Independence Correlation WPP 2010
● ●
● ●
● ● ● ●
0.5
1.0
1.5
2.0
Southern Europe
Time Period
Re
gional TFR
1990 1995 2000 2005
●
Independence Correlation WPP 2010
● ●
● ● ● ●
● ●
2.5
3.0
3.5
4.0
4.5
5.0
Western Asia
Time Period
Re
gional TFR
1990 1995 2000 2005
●
Independence Correlation WPP 2010
● ●
● ●
● ●
As the estimated correlations are larger when both countries have low TFR values, bigger differences between the current model and the correlation model prediction inter-vals are seen for regions such as Northern Europe and Central Asia, for which the majority of the countries have completed most of the fertility decline. Regions that have few coun-tries with TFR less than 5, such as Eastern and Western Africa, showed little change between the prediction intervals from the current model and the correlation model, as expected.
4.2 Effect of taking account of correlation
For a given parameter vectorθand time periodt, the effect of taking account of corre-lation on the variance of the regional TFR one-time-period-ahead can be quantified ana-lytically. We denote bypithe proportion of the region’s female population that resides in countryi, byfithe TFR in countryiin time periodt, and byN the number of countries in the region. The regional weighted average TFR is thenP
ipifiwhere the sum is over all countries in the region.
If the forecast errors are assumed to be independent as in the current model, the pre-dictive variance of the regional TFR in time periodtgiven all TFRs in time periodt−1
is Var[P
ipifi] = P
ip
2
iVar[fi], where Var[fi] = eσi,t2 . As we project TFR into the fu-ture, eventually all countries will be in the last phase of the model, having completed their fertility transition, where Var[fi] = s2. When all countries in the region are in the post-transition phase,
Var "
X
i pifi
#
=s2X i
p2i (5)
under the current model. We will refer toP
ip
2
i as the independence factor (IF) because it represents the ratio of the regional variance to the country-specific variance assuming independence in the post-transition phase. It indicates the effect of the distribution of the population across countries in the region and shows that the more evenly the regional female population is spread amongst the countries within the region, the greater the variability in the regional estimate. This comes from the fact that the IF is maximized when eachpi = N1 for all countries in the region.
The variance of a region’s TFR one-time-period-ahead under the correlation model is
Var "
X
i pifi
#
=
X
i
p2iVar[fi] + 2 X
i<j pipj
q
Var[fi]Var[fj]Rt[i, j]
When all countries have completed the fertility transition, this becomes
Var "
X
i pifi
#
=s2
X
i
p2i + 2X
i<j
pipjRt[i, j]
. (6)
We will refer toP ip
2
i + 2 P
i<jpipjRt[i, j]
as the dependence factor (DF) as it is the
multiplicative factor in the variance under the correlation model. Equation (6) shows that the larger the country correlations, especially between those countries with a relatively high proportion of the regional female population, the larger the one-time-period-ahead variance of the regional TFR.
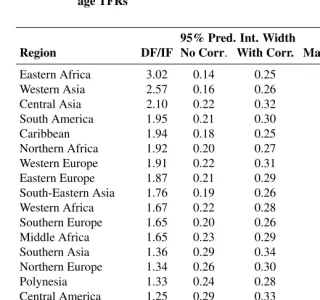
The ratios of the dependence factor to the independence factor for the 22 UN regions are shown in Table 7. The regions with the largest ratios are those whose predictive distributions are most impacted by between-country correlations. For example, Western Asia and Eastern Africa’s ratios are both greater than 2.5, indicating that the variance of the regional TFR predictive distributions is more than 2.5 times greater for the model with the correlation structure than that from the current model. Those regions with ratios close to 1, such as Northern America and Australia/New Zealand, have similar predictive distributions from the two models. These same phenomena are reflected in the 95% one-time-period-ahead prediction interval widths, which show greater differences between the model with and without correlation for those regions with high ratios and small dif-ferences for those regions with small ratios.
Table 7: Effect of correlation model on variance of regional weighted aver-age TFRs
95% Pred. Int. Width
Region DF/IF No Corr. With Corr. Max Proportion N
Eastern Africa 3.02 0.14 0.25 0.26 18
Western Asia 2.57 0.16 0.26 0.33 18
Central Asia 2.10 0.22 0.32 0.45 5
South America 1.95 0.21 0.30 0.50 13
Caribbean 1.94 0.18 0.25 0.27 16
Northern Africa 1.92 0.20 0.27 0.39 7
Western Europe 1.91 0.22 0.31 0.43 7
Eastern Europe 1.87 0.21 0.29 0.49 10
South-Eastern Asia 1.76 0.19 0.26 0.40 10
Western Africa 1.67 0.22 0.28 0.52 16
Southern Europe 1.65 0.20 0.26 0.39 12
Middle Africa 1.65 0.23 0.29 0.52 9
Southern Asia 1.36 0.29 0.34 0.71 9
Northern Europe 1.34 0.26 0.30 0.63 11
Polynesia 1.33 0.24 0.28 0.48 3
Central America 1.25 0.29 0.33 0.73 8
Micronesia 1.22 0.29 0.32 0.62 2
Southern Africa 1.14 0.35 0.37 0.87 5
Melanesia 1.12 0.32 0.33 0.78 5
Northern America 1.10 0.36 0.38 0.90 2
Eastern Asia 1.09 0.34 0.35 0.85 8
Australia/New Zealand 1.08 0.34 0.35 0.83 2
4.3 Comparison to previous results
Others have investigated the correlation between country forecast errors and obtained similar results to those reflected by the correlation model here. Keilman and Pham (2004) modeled TFR in 18 countries in the European Economic Area (EEA) with an autoregres-sive conditional heteroscedastic model and calculated the average correlation between country TFR errors to be 0.33. Although not all countries in the EEA are within the same UN region, in our model two countries with low TFR that are in the same region and not contiguous have a correlation of 0.20 and those not in the same region but contiguous have a value of 0.37.
When Alho (2008) further studied the correlation matrix obtained by Keilman and Pham (2004) (see also Statistics Netherlands (2005)), he found a stark contrast between the correlations between the Mediterranean countries (Portugal, Spain, Italy, and Greece) and all others. His estimate of the average correlation between forecast errors in Mediter-ranean and non-MediterMediter-ranean countries was 0.12 and the correlation within each of these groups was 0.3. Recall that in our model, the correlation between countries that have low TFR and have no geographic or colonial relation is 0.11.
Wilson and Bell (2007) modeled TFR using a random walk with drift and found the correlation between errors for Queensland and the rest of Australia to be 0.40. According to our correlation model, when TFR is less than 5, as it has been in Australia for many decades, the correlation between Australia and a hypothetical country contiguous to it would be 0.46. This is comparable to the result of Wilson and Bell (2007).
5.
Discussion
When producing probabilistic population projections for country aggregates, it is critical to take account of between-country correlations in forecast errors of vital rates (Lutz 1996; Lee 1998; Bongaarts and Bulatao 2000). In this paper we have proposed a method for estimating between-country correlations in forecast errors of the TFR for all countries and using them to produce probabilistic TFR forecasts for aggregates of countries such as regions. For many country pairs there are few relevant data available, and so we estimate the correlations by modeling them as a function of three time-invariant predictors.
popula-tion projecpopula-tions in the same way as those produced by the current method of Raftery et al. (2012).
The assumption in (1) that in the long-term (post-transition phase) every country TFR will fluctuate around 2.1 can be relaxed. Raftery et al. (2013a) proposed an extension that allows each country to have its own long-term mean TFR. This extension has been incorporated into the bayesTFRpackage inR, along with the TFR correlation model presented here (Ševˇcíková, Alkema, and Raftery 2011). The 2010 WPP data used in this article are available in thewpp2010R package (Ševˇcíková and Gerland 2013).
While we have discussed procedures for aggregating country-specific TFR projec-tions, the methods proposed here could be adapted to address excess correlation between any set of stochastic forecasts, such as mortality rates, migration rates, etc. The key task would be obtaining a set of time-invariant covariates that explain the between-country cor-relation. The existence of excess correlation is a function of the mean model specification and may not always be present. For example, Raftery et al. (2013b) found no evidence for cross country correlation in life expectancy forecasts. Nonetheless depending on the complexity and mean model fit, excess correlation may exist, and adapting the methods presented here may provide better uncertainty estimates for aggregate quantities.
6.
Acknowledgements
References
Alho, J. (2008). Aggregation across countries in stochastic population forecasts. Interna-tional Journal of Forecasting24(3): 343–353. doi:10.1016/j.ijforecast.2008.05.003.
Alho, J. and Spencer, B. (2005). Statistical Demography and Forecasting. New York: Springer.
Alho, J., Alders, M., Cruijsen, H., Keilman, N., Nikander, T., and Pham, D.Q. (2006). New forecast: Population decline postponed in Europe. Statistical Journal of the United Nations Economic Commission for Europe23(1): 1–10.
Alkema, L., Raftery, A.E., Gerland, P., Clark, S.J., Pelletier, F., Buettner, T., and Heilig, G.K. (2011). Probabilistic projections of the total fertility rate for all countries. De-mography48(3): 815–839. doi:10.1007/s13524-011-0040-5.
Barbieri, M.M. and Berger, J.O. (2004). Optimal predictive model selection. Annals of Statistics32(3): 870–897. doi:10.1214/009053604000000238.
Besag, J. (1975). Statistical analysis of non-lattice data. Journal of the Royal Statistical Society, Series D (The Statistician)24(3): 179–195. doi:10.2307/2987782.
Bongaarts, J. and Bulatao, R.A.E. (2000).Beyond Six Billion. Washington, D.C.: National Research Council.
Cox, D. and Reid, N. (2004). A note on pseudolikelihood constructed from marginal densities.Biometrika91(3): 729–737. doi:10.1093/biomet/91.3.729.
Driessel, K.R. (2007). Computing the best positive semi-definite approximation of a symmetric matrix using a flow. [electronic resource]. Institute for Mathe-matics and its Applications: Applications in Biology, Dynamics, and Statistics.
http://www.ima.umn.edu/AlgGeom/W3.5-9.07/activities/Driessel-Kenneth/poster.pdf.
Fosdick, B.K. and Raftery, A.E. (2012). Estimating the correlation in bivariate normal data with known variances and small sample sizes. The American Statistician66(1): 34–41.doi:10.1080/00031305.2012.676329.
Keilman, N. and Pham, D.Q. (2004). Empirical errors and predicted errors in fertility, mortality and migration forecasts in the European Economic Area. Research Depart-ment of Statistics Norway.
Lee, R.D. (1998). Probabilistic approaches to population forecasting. Population and Development Review24: 156–190.doi:10.2307/2808055.