Strojniški vestnik - Journal o f Mechanical Engineering 54(2008)10, 725-733 UDO 655.1
Paper received: 02.04.2008 Paper accepted: 25.09.2008
Geometric Accuracy by 2-D Printing Model
T o m is la v G a le ta - M ila n K lja jin - M irk o K a ra k a š ić U n iv e rs ity o f O sije k , M e c h a n ic a l E n g in e e rin g F a c u lty , C ro a tia
In order to improve the accuracy o f three-dimensional printing (3DP), we carried out a set o f experiments on two-dimensional (2-D) p rinted model. The combinations o f three main processing fa cto rs were considered fo r every experiment: layer thickness, building orientation and infdtrant type. The results o f experiments provided the appropriate anisotropic scale fa c to r and p ro ved the adequacy o f anisotropic scaling. The analysis o f results indicates that sm aller layer thickness, infiltration with epoxy resin and sam ple orientation towards building direction o f X axis provide better sample accuracy.
© 2 0 0 8 Jo u rn a l o f M e c h a n ic a l E n g in e e rin g . A ll rig h ts re se rv e d .
Keywords: rapid prototyping, three-dimensional printing, geometric accuraccy
0 IN T R O D U C T IO N
T h e m o d e ls p ro d u c e d b y th re e - d im e n sio n a l p rin tin g (3 D P ) are n o t so a c cu rate w h en c o m p a re d to o th e r R a p id P ro to ty p in g (R P ) te c h n o lo g ie s. S e v e ra l a u th o rs e m p h a s iz e d the p ro b le m o f 3 D P a c c u ra c y in th e ir re se a rc h e s. D im itro v e t al. p o in te d o u t in th e ir re v ie w o f 3 D P th a t th e a c c u ra c y is a sig n ific a n t w e a k n e s s w h e n c o m p a re d to o th e r R P te c h n o lo g ie s [T], P ilip o v ić et al. n o tic e d th a t 3 D P te s t sa m p le s e x c e e d to le ra n c e lim its f o r te n s ile te s tin g a n d are less ac cu rate th a n s a m p le s m a d e w ith a h y b rid P o ly je t te c h n iq u e [2].
T h e re s e a rc h e rs a re c o n s ta n tly try in g to im p ro v e 3 D P a c c u ra c y w h ic h is e v id e n t in th e n u m b e r o f p u b lis h e d p a p e rs [3] to [8]. T h e e ffo rt for im p ro v e m e n t is a lso re fle c te d o n a 3 D P m a rk e t - th e m a n u fa c tu re rs n o t o n ly d e v e lo p an d d eliv er th e n e w m o d e ls o f p rin te rs , b u t also n ew im p ro v e d m a te ria ls , d e v ic e firm w a re , s o ftw a re an d im p ro v e d a lte rn a tiv e sp a re p a rts f o r th e e x istin g m o d e ls.
T h e p r im a ry o b je c tiv e o f o u r p a p e r w a s to d e te rm in e th e a p p ro p ria te s c a le fa c to rs fo r th e co n s id e re d 3 D P s y s te m in th e s e le c te d c o m b in a tio n o f m a te ria ls a n d p ro c e s s in g p a ra m e te rs. T h e p o s s ib le u s e o f th e a p p ro p ria te scale fa c to rs f o r im p ro v in g p rin te r a c c u ra c y is also p o in te d o u t in [6] a n d it g a v e u s th e a d d itio n a l m o tiv a tio n to p e rfo rm th e ex p e rim e n ts. T he s e c o n d a ry o b je c tiv e w a s to d e te rm in e th e in flu e n ce o f 3 D P p ro c e s s in g fa c to rs o n th e a c cu rac y a n d to d e te rm in e th e m o s t a c c u ra te co m b in atio n . T h e re fo re , w e c a rrie d o u t th e
e x p e rim e n ts to im p ro v e th e a c c u r a c y o f th e c o n s id e re d 3 D P sy stem .
1 3 D P E Q U IP M E N T A N D M A T E R IA L S
T h e 3 D p rin te r, u s e d f o r th e s e e x p e rim e n ts, w a s th e m o d e l Z 3 1 0 , a p r o d u c t o f Z C o rp o ra tio n . It is a lo w -c o s t m o n o c h ro m e 3 D p rin te r s u ita b le fo r R P e d u c a tio n o r f o r sm a ll a n d m e d iu m siz e d c o m p a n ie s. T h e p r in te r f irm w a re v e rs io n w a s 1 0.158 a n d te s t s a m p le s w e r e p re p a re d in a p r in te r s o ftw a re Z P r in t v e r s io n 7 .5 .2 3 [9] a n d [10],
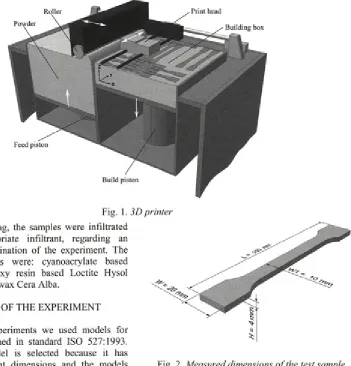
T h e c o n s id e re d 3D p r in te r c o m b in e s a la y e re d a p p ro a c h fro m R P te c h n o lo g ie s a n d a c o n v e n tio n a l in k -je t p rin tin g . It p r in ts a b in d e r flu id th ro u g h th e c o n v e n tio n a l in k -je t p r in t h e a d in to a p o w d e r, o n e la y e r o n to a n o th e r, fro m th e lo w e s t m o d e l’s c ro s s -s e c tio n to th e h ig h e s t (F ig . 1). A fte r p rin tin g , th e p r in te d m o d e ls a re d r ie d in a b u ild in g b o x , th e n re m o v e d fro m th e p o w d e r b e d , d e -p o w d e re d b y c o m p re s s e d a ir, d rie d in th e o v e n an d in filtra te d fo r m a x im u m stre n g th .
T h e re are s e v e ra l b a s e m a te r ia ls , i.e. p o w d e r ty p e s, a v a ila b le f o r th e a b o v e m e n tio n e d 3D p rin te r. F o r o u r e x p e rim e n t w e u s e d a p la s te r- b a s e d p o w d e r z p l 3 0 w ith an a p p r o p r ia te b in d e r zb 5 6 . T h e p o w d e r z p l 3 0 is re c o m m e n d e d fo r th e a c c u ra c y a n d fo r d e lic a te m o d e ls . It is a m ix tu re o f p la s te r, v in y l p o ly m e r a n d s u lfa te s a lt [11].
A ll te s t s a m p le s w e re d r ie d tw o tim e s as re c o m m e n d e d in [10] a n d [1 2 ]: f irs t in th e p r in te r ’s b u ild in g b o x f o r o n e h o u r a n d th e n , a f te r d e -p o w d e rin g , in th e o v e n f o r a t le a s t tw o h o u rs at 5 5°C .
Print head
Building box
Feed piston
Build piston
F ig . 1. 3D printer
A fte r d ry in g , th e sa m p le s w e re in filtra te d w ith th e a p p ro p ria te in filtra n t, re g a rd in g an a p p ro p ria te c o m b in a tio n o f th e e x p e rim e n t. T h e a p p lie d in filtra n ts w ere: c y a n o a c ry la te b a s e d L o c tite 4 0 6 ; e p o x y re s in b a s e d L o c tite H y so l 9483 a n d n o rm a l w a x C e ra A lb a.
2 D E S IG N O F T H E E X P E R IM E N T
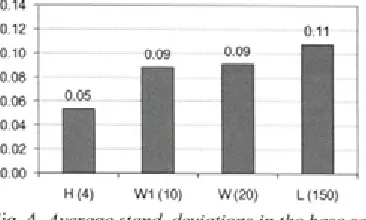
In o u r e x p e rim e n ts w e u s e d m o d e ls fo r te n sile te sts d e fin e d in s ta n d a rd IS O 5 2 7 :1 9 9 3 . T e n sile te s t m o d e l is s e le c te d b e c a u s e it h as su ffic ie n t d iffe re n t d im e n s io n s a n d th e m o d e ls ca n b e u s e d fo r a d d itio n a l te sts o f m e c h a n ic a l p ro p e rtie s i f n e e d e d . T h e m e a s u re d d im e n sio n s o n te s t sa m p le s w ere: to ta l le n g th (L ), w id th at th e e n d (W ), n e c k w id th ( W l ) a n d h e ig h t (H ). T h e p o s itio n o f d im e n s io n s o n th e te s t sa m p le a n d n o m in a l v a lu e s o f d im e n sio n s a re p r e s e n te d in F ig . 2. S in ce th e te n s ile te s t m o d e l h a s th e sm a ll h ig h t re g a rd in g o th e r d im e n sio n s, w e c o n s id e re d it as a 2 -D m o d e l.
T w o se ts o f te st sa m p le s w e re p la n n e d . F o r th e firs t se t w e c o n s id e re d n o n -s c a le d sa m p le s, so c a lle d th e b a s e set. T h e sa m p le s o f th e s e c o n d set w ill b e s c a le d w ith a p p ro p ria te sc a le fa c to rs o b ta in e d fro m th e m e a s u rin g o f th e b a s e set.
In b o th se ts, th e te s t sa m p le s w e re p rin te d in a c o m b in a tio n o f c o n s id e re d p ro c e s s in g fac to rs. W e c o n s id e re d c o m b in a tio n s o f th e fo llo w in g p r o c e s s in g fac to rs: la y e r th ic k n e s s, b u ild in g o rie n ta tio n a n d in filtra n t ty p e.
F ig . 2. M easured dimensions o f the test sample
L a y e r th ic k n e s s c a n b e s e le c te d fro m tw o p o s s ib le v a lu e s - 0,1 m m a n d 0 ,0 8 7 5 m m . T he firs t th ic k n e s s is d e fa u lt fo r th e p rin te r a n d it is th e re fo re m a rk e d w ith n u m b e r 1 in th e b e g in n in g o f th e la b e l fo r a p a rtic u la r c o m b in a tio n o f fac to rs.
T h e ty p e o f th e in filtra n t is m a rk e d w ith letter at th e e n d o f th e la b e l fo r a p a rtic u la r c o m b in atio n o f fac to rs. T h e le tte rs u s e d fo r a p articu la r in filtra n t ty p e are: W fo r w a x , E fo r ep oxy re sin a n d C fo r cy a n o a c ry la te .
F o r e v e ry p a rtic u la r e x p e rim e n t i.e. p articu la r c o m b in a tio n o f fa c to rs in ea c h set, 6 test sa m p le s w e re p rin te d a n d m e a s u re d (F ig . 3).
F ig. 3. 3D printing o f test samples
W e m e a s u re d d im e n s io n s o f te s t sa m p le s w ith d ig ita l c a lip e r L u x P ro fi m o d e l 5 7 2 5 8 7 , w ith the m e a s u re m e n t ra n g e 0 - 1 5 0 m m an d a c c u ra c y 0.01 m m .
3 R E S U L T S
T h e m e a s u re m e n t re s u lts o f th e b a s e set sam ples are p r e s e n te d in T a b le 1. C o m m o n sta tistica l v a lu e s are c a lc u la te d a n d p re s e n te d in table ro w s, g ro u p e d b y th e m e a s u re d d im e n s io n an d c o m b in a tio n s. C a lc u la te d v a lu e s are: arith m etic m e a n ( x ); sta n d a rd d e v ia tio n (S); rela tiv e s ta n d a rd d e v ia tio n (RSD); a v e ra g e e rro r
(Ax); re la tiv e e rro r (Ax/X) a n d r e la tiv e d e v ia tio n
( x / X ) .
T h e re la tiv e s ta n d a rd d e v ia tio n a d e q u a te ly e x p re sses th e p r e c is io n o f a p a r tic u la r e x p e rim e n t co m b in a tio n r e g a rd in g th e m e a s u re d d im e n sio n s. It is th e a b s o lu te v a lu e o f th e c o e ffic ie n t o f v aria tio n , u s u a lly e x p re s s e d as a p e rc e n ta g e an d ca lc u la te d by:
RSD = Ì r - m
X (1)
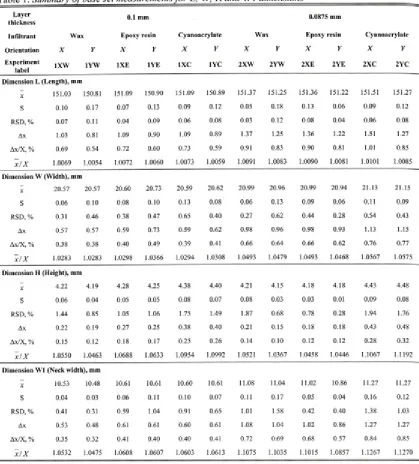
I f a v e ra g e s ta n d a rd d e v ia tio n s fo r e v e ry m e a s u re d d im e n s io n in th e b a s e se t o f sa m p le s are p re s e n te d to g e th e r in a sin g le ch a rt, it ca n b e n o tic e d th a t th e sta n d a rd d e v ia tio n is h ig h e r fo r la rg e r d im e n s io n s (F ig . 4).
0 .1 4
0.12
0.10
0 .08 0 .0 6 0 .0 4
0.02
0.00
F ig . 4. Average stand, deviations in the base set
H o w e v e r, i f re la tiv e sta n d a rd d e v ia tio n s fo r ea c h m e a su re d d im e n s io n a re c o n s id e re d , it can b e n o tic e d th a t th e re la tiv e sta n d a rd d e v ia tio n is h ig h e r f o r s m a lle r d im e n sio n s (F ig . 5). F u rth e rm o re , a v e ra g e re la tiv e e rro rs a re h ig h e r fo r la rg e r d im e n s io n s (F ig. 6).
1.60%
1.20%
0 .8 0 %
0 .4 0 %
0.00%
F ig . 5. Average relative standard deviations in the base set
0.11
H (4 ) W 1 (1 0 ) W (2 0 ) L (1 5 0 )
1.00%
0 .80% 0 .60% 0.40%
0.20%
0.00%
H (4) W 1 (1 0 ) W (20) L (150)
F ig . 6. Average relative errors in the base set
Table 1. Summary o f base set measurements for L, W, H and W 1 dimensions
L a y e r
thickne ss 0.1 m m 0.0875 m m
I n f ilt r a n t W a x E p o x y re sin C y a n o a c ry la te W a x E p o x y re sin C y a n o a c ry la te O r ie n ta tio n X Y X Y X Y X Y X r X Y
E x p e rim e n t
la b e l x x w 1 Y W 1 X E 1 Y E 1 X C 1 Y C
2 X W 2 Y W 2 X E 2 Y E 2 X C 2 Y C D im e n s io n L (L e n g th ), m m
X 151.03 150.81 151.09 150.90 151.09 150.89 151.37 151.25 151.36 151.22 151.51 151.27
s 0.10 0.17 0.07 0.13 0.09 0.12 0.05 0.18 0.13 0.06 0.09 0.12
R S D , % 0.07 0.11 0.04 0.09 0.06 0.08 0.03 0.12 0.08 0.04 0.06 0.08
A x 1.03 0.81 1.09 0.90 1.09 0.89 1.37 1.25 1.36 1.22 1.51 1.27
A x / X , % 0.69 0.54 0.72 0.60 0.73 0.59 0.91 0.83 0.90 0.81 1.01 0.85
x / X 1.0069 1.0054 1.0072 1.0060 1.0073 1.0059 1.0091 1.0083 1.0090 1.0081 1.0101 1.0085
D im e n s io n W ( W id th ) , m m
X 20.57 20.57 20.60 20.73 20.59 20.62 20.99 20.96 20.99 20.94 21.13 21.15
s 0.06 0.10 0.08 0.10 0.13 0.08 0.06 0.13 0.09 0.06 0.11 0.09
R S D , % 0.31 0.46 0.38 0.47 0.65 0.40 0.27 0.62 0.44 0.28 0.54 0.43
A x 0.57 0.57 0.59 0.73 0.59 0.62 0.98 0.96 0.98 0.93 1.13 1.15
A x / X , % 0.38 0.38 0.40 0.49 0.39 0.41 0.66 0.64 0.66 0.62 0.76 0.77
x / X 1.0283 1.0283 1.0298 1.0366 1.0294 1.0308 1.0493 1.0479 1.0493 1.0468 1.0567 1.0575
D im e n s io n H (H e ig h t), m m
X 4.22 4.19 4.28 4.25 4.38 4.40 4.21 4.15 4.18 4.18 4.43 4.48
S 0.06 0.04 0.05 0.05 0.08 0.07 0.08 0.03 0.03 0.01 0.09 0.08
R S D , % 1.44 0.85 1.05 1.06 1.75 1.49 1.87 0.68 0.78 0.28 1.94 1.76
A x 0.22 0.19 0.27 0.25 0.38 0.40 0.21 0.15 0.18 0.18 0.43 0.48
A x / X , % 0.15 0.12 0.18 0.17 0.25 0.26 0.14 0.10 0.12 0.12 0.28 0.32
x / X 1.0550 1.0463 1.0688 1.0633 1.0954 1.0992 1.0521 1.0367 1.0458 1.0446 1.1067 1.1192
D im e n s io n W 1 (N e c k w id th ) , m m
X 10.53 10.48 10.61 10.61 10.60 10.61 11.08 11.04 11.02 10.86 11.27 11.27
S 0.04 0.03 0.06 0.11 0.10 0.07 0.11 0.17 0.05 0.04 0.16 0.12
R S D , % 0.41 0.31 0.59 1.04 0.91 0.65 1.01 1.58 0.42 0.40 1.38 1.03
A x 0.53 0.48 0.61 0.61 0.60 0.61 1.08 1.04 1.02 0.86 1.27 1.27
A x / X , % 0.35 0.32 0.41 0.40 0.40 0.41 0.72 0.69 0.68 0.57 0.84 0.85
x / X 1.0532 1.0475 1.0608 1.0607 1.0603 1.0613 1.1075 1.1035 1.1015 1.0857 1.1267 1.1270
For the particular combination in scaled set o f samples, anisotropic scale factor (AS) o f particular dimension is a multiplicative inverse o f the matching relative deviation from the same combination in the base set:
A S n
f - \-1
f 1 5 1 .0 3 )
X
(2 ), A S X ( I X W ) —
1 5 0
where index D denotes anisotropic scaling direction and could be either X, Y or Z.
For example, the anisotropic scale factor in building direction X o f the experimental combination 1XW is:
But for the combination 1YW, in which the largest dimension o f the sample (L) is oriented in building direction Y, the width (W) o f the sample is oriented along building direction X, therefore:
ASx(1YW) = 20.57
20 ,
= 1.0283- = 0.97245 (4).
Such an exchange o f length and width values in the calculation o f anisotropic scale factor must be done for every experiment combination with samples oriented along the building direction Y.
The complete list o f applied anisotropic scale factors for each experiment combination o f scaled set is given in Table 2.
T^hle 2. Anisotropic scale factors
L ab e l 1 X W 1 Y W 1 X E 1 Y E 1 X C 1 Y C 2 X W 2 Y W 2 X E 2 Y E 2 X C 2 Y C
ASX 0.9937. 0.9725 0.9928 0.9647 0.9928 0.9701 0.9910 0.9543 0.9910 0.9553 0.9900 0.9450
ASy 0.9725 0.9946 0.9711 0.9940 0.9714 0.9941 0.9531 0.9918 0.9531 0.9919 0.9464 0.9923
ASz 0.9479 0.9558 0.9357 0.9404 0.9129 0.9098 0.9505 0.9646 0.9562 0.9573 0.9036 0.8882
Appropriate anisotropic scale factors were entered in ZPrint software regarding printed
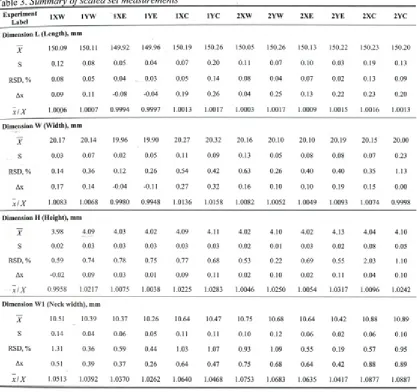
samples and combination. Table 3. shows measurement results o f scaled set samples.
Table 3. Summary o f scaled set measurements
E x p e rim e n t
L a b e l 1 X W 1 Y W 1 X E 1 Y E 1 X C
1 Y C 2 X W 2 Y W 2 X E 2 Y E 2 X C 2 Y C D im e n sio n L (L e n g th ), m m
X 150.09 150.11 149.92 149.96 150.19 150.26 150.05 150.26 150.13 150.22 150.23 150.20
s 0.12 0.08 0.05 0.04 0.07 0.20 0.11 0.07 0.10 0.03 0.19 0.13
RSD, % 0.08 0.05 0.04 _ 0.03 0.05 0.14 0.08 0.04 0.07 0.02 0.13 0.09 A x 0.09 0.11 -0.08 -0.04 0.19 0.26 0.04 0.25 0.13 0.22 0.23 0.20
x/X 1.0006 1.0007 0.9994 0.9997 1.0013 1.0017 1.0003 1.0017 1.0009 1.0015 1.0016 1.0013 D im e n sio n W ( W id th ) , m m
X 20.17 20.14 19.96 19.90 20.27 20.32 20.16 20.10 20.10 20.19 20.15 20.00 S 0.03 0.07 0.02 0.05 0.11 0.09 0.13 0.05 0.08 0.08 0.07 0.23 R SD, % 0.14 0.36 0.12 0.26 0.54 0.42 0.63 0.26 0.40 0.40 0.35 1.13 A x 0.17 0.14 -0.04 -0.11 0.27 0.32 0.16 0.10 0.10 0.19 0.15 0.00
x/X 1.0083 1.0068 0.9980 0.9948 1.0136 1.0158 1.0082 1.0052 1.0049 1.0093 1.0074 0.9998 D im e n sio n H (H e ig h t), m m
X 3.98 4.09 4.03 4.02 4.09 4.11 4.02 4.10 4.02 4.13 4.04 4.10 S 0.02 0.03 0.03 0.03 0.03 0.03 0.02 0.01 0.03 0.02 0.08 0.05 RSD, % 0.59 0.74 0.78 0.75 0.77 0.68 0.53 0.22 0.69 0.55 2.03 1.10 A x -0.02 0.09 0.03 0.01 0.09 0.11 0.02 0.10 0.02 0.11 0.04 0.10
x/X 0.9958 1.0217 1.0075 1.0038 1.0225 1.0283 1.0046 1.0250 1.0054 1.0317 1.0096 1.0242 D im e n sio n W 1 (N e c k w id th ) , m m
X 10.51 10.39 10.37 10.26 10.64 10.47 10.75 10.68 10.64 10.42 10.88 10.89 S 0.14 0.04 0.06 0.05 0.11 0.11 0.10 0.12 0.06 0.02 0.06 0.10 RSD, % 1.31 0.36 0.59 0.44 1.03 1.07 0.93 1.09 0.55 0.19 0.57 0.95 A x 0.51 0.39 0.37 0.26 0.64 0.47 0.75 0.68 0.64 0.42 0.88 0.89
4 ANALYSIS AND DISCUSSION
In order to determine whether the measured results are significantly affected by surface roughness, standard deviations o f measured dimensions are compared with the average roughness o f samples. The level of roughness for 3D printed samples is N10, and respectively average roughness is 12.5 pm [2], Standard deviations for both base and scaled set are several times higher than average roughness, therefore surface roughness did not have any significant influence on the measured results.
The overall effect o f anisotropic scaling could be assessed if the results o f both base and scaled set are compared (Fig. 7). A comparison o f average errors between the sets reveals a considerable reduction o f errors for all scaled dimensions in the scaled set o f samples. A smaller error reduction is obtained for the neck width (W l) which is not scaled by own scale factor but indirectly by the anisotropic scale factor o f width (W).
H (4) W1(10) W (20) L (150)
Fig. 7. Average errors between sets
A comparison o f average relative standard deviations between the sets shows that there is no significant difference in deviations before and after scaling, except for the height o f samples (Fig.
8
).The analysis o f relative deviations for each experiment factor in the scaled set, reveals active relations within the considered factor. For dimensions: largest dimension - length (L) - has the lowest average relative deviation (1.000889), while the smallest - height (H) - has the highest relative deviation (1.015000). When comparing infiltrants: the samples infiltrated with the epoxy resin have the lowest average relative deviation (1.004735), while the samples infiltrated with the cyanoacrylate have the highest values (1.010592).
The samples oriented along the building direction X have smaller deviations (1.004993) than those oriented along Y direction (1.009605). Finally, the samples printed with layer thickness
0,1
mm do not show any significant difference in relative deviation compared to those printed with layer thickness 0.0875 mm: 1.006682 to 1.007915.Fig.
8
. Average relative standard deviations compared between setsConsidering particular combination and dimension, combinations 1YE and 2XW had the least average relative deviation o f specimen’s length (1.0003). For width, combinations 2YC (0.9998) had minimum and closest to it was 1XE (0.998), while for height it was combination 1YE (1.0038).
1.80% 1.60% 1.40%
1.20%
1.00%
0.80% 0.60% 0.40%
0.20%
0.00%
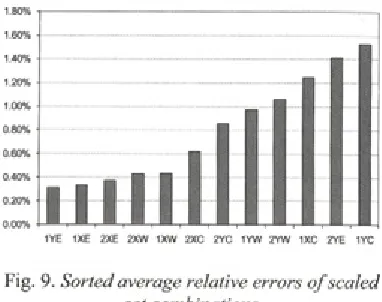
1YE 1XE 2XE 2XW 1XW 2XC 2YC 1YW 2YW 1XC 2YE 1YC
Fig. 9. Sorted average relative errors o f scaled set combinations
could be the fact that the most accurate combination is printed with higher layer thickness as the second most inaccurate combination. Most likely the reason for this is that the accuracy o f combination 2YE is significantly influenced by the operator’s skills either during the cleaning o f samples or while applying the epoxy resin. Relative errors o f other combinations are equally distributed regarding the particular factor.
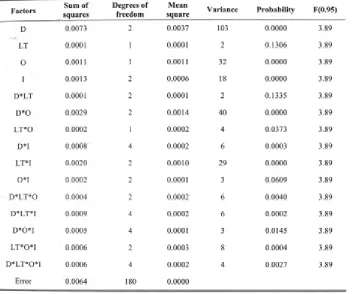
In order to understand completely the effect of factors on relative deviation and printing accuracy, we performed a factorial analysis o f variance (ANOVA). Since there is a significant difference in relative deviations between the measured dimensions, a dimension is considered as an additional factor for ANOVA calculations. It is considered with 3 levels - length, width and height. Other factors and their levels are considered according to the experiment design. ANOVA o f relative deviations is presented in Table 4. The abbreviations used for factors are: D - dimension; LT - layer thickness; O -
orientation; I - infiltrant.
The ANOVA calculation reveals that the dimension o f printed sample was the most influential factor on the relative deviation. Beside the dimension, sample orientation and infiltrant type also showed a significant influence on the relative deviation. However, the analysis did not prove any influence o f layer thickness variations.
Despite the lack o f influence when considered alone, the layer thickness variations had a significant influence in the interaction with the infiltrant type. The interaction o f dimension and sample orientation is also strongly emphasized according to the analysis o f variance. Other interactions o f factors have either smaller or insignificant influence when compared to the critical value o f Fischer’s distribution with the probability o f 0.95 and respective degrees of freedom (
1
; 180).To avoid an oversight o f the possible significant interaction o f particular variants within a particular experiment combination, we also performed a differential analysis o f the influence o f particular factor variants within the other factor.
Table 4. Anova o f relative deviations in scaled set
F a c to r s S u m o f s q u a r e s
D e g r e e s o f
f r e e d o m
M e a n
s q u a r e V a r ia n c e P r o b a b ilit y F ( 0 .9 5 )
D 0.0073 2 0.0037 103 0.0000 3.89
LT 0.0001 1 0.0001 2 0.1306 3.89
O 0.0011 1 0.0011 32 0.0000 3.89
I 0.0013 2 0.0006 18 0.0000 3.89
D*LT 0.0001 2 0.0001 2 0.1335 3.89
D *0 0.0029 2 0.0014 40 0.0000 3.89
LT*0 0.0002 1 0.0002 4 0.0373 3.89
D*I 0.0008 4 0.0002 6 0.0003 3.89
LT*I 0.0020 2 0.0010 29 0.0000 3.89
0*1 0.0002 2 0.0001 3 0.0609 3.89
D*LT*0 0.0004 2 0.0002 6 0.0040 3.89
D*LT*I 0.0009 4 0.0002 6 0.0002 3.89
D*0*I 0.0005 4 0.0001 3 0.0145 3.89
LT*0*I 0.0006 2 0.0003 8 0.0004 3.89
D*LT*0*I 0.0006 4 0.0002 4 0.0027 3.89
For that purpose, a thorough reading o f
results for each combination and reading o f
appropriate multifactor charts were performed
(Fig. 10 and Fig. 11).
Differential analysis reveals one particular effect in the interaction o f dimensions and building orientation. Although the interaction o f those factors appears significant for the experiment, it is mainly caused by big variances o f height. Other dimensions did not show any significant variances regarding the building orientation.
D:L D: W D: H
Fig. 10. Average relative deviations fo r layer thickness 1
Fig. 11. Average relative deviations fo r layer thickness 2
M ultifactor charts show that relative deviations o f samples printed with smaller layer thickness
2
, are grouped in narrower clusters than relative deviations o f larger layer thickness1
.Therefore, smaller layer thickness 2 provided a better overall precision o f samples.
5 CONCLUSION
The obtained experiment results clearly show that the scaling o f 3D printed samples provides a better dimensional precision of samples. Furthermore, the significant differences in relative errors and relative standard deviations between measured dimensions prove the adequacy o f anisotropic scaling for samples with significant differences between the main dimensions. A limitation o f the anisotropic scaling exists for dimensions that are not scaled directly with their own scale factor, as it was presented in this paper for dimension o f neck width (W l).
Although a comparison o f average relative errors reveals the combinations w ith m inor errors, from the factorial analysis o f variance it can be concluded that an appropriate combination of 3DP processing factors should be selected regarding the significant dimension o f the printed sample. For the accuracy o f the largest dimension, i.e. length, the sample should be printed with default layer thickness
0,1
mm, oriented toward building direction X and infiltrated with the epoxy resin. Since there is a significant interaction o f factors, i.e. layer thickness and the infiltrant type, from differential analysis it could be concluded that a combination o f the default layer thickness and infiltration with the wax is also the appropriate selection for both considered building orientations. The accuracy of the medium dimension (width) could be improved if the printed sample is infiltrated with the epoxy resin, while other processing factors did not show any significant influence. The accuracy o f the smallest dimension (height) could be improved if the printed sample is infiltrated with wax or epoxy resin and the sample is oriented towards building direction X.From the overall analysis the following could be concluded for the particular processing factor:
• The layer thickness: smaller layer thickness provides better overall precision o f samples.
the least accurate are samples infiltrated with cyanoacrylate.
The building orientation: the samples oriented towards direction X are more accurate than samples oriented towards direction Y.
Further researches could also be performed to improve the accuracy o f the considered 3DP system like the experimental measurement o f test sample behaviour and a finite-element based simulation using a non-linear visco-elastic constitutive model similar to the one published in [13].
Although it is possible that some o f the presented conclusions are valid for similar machines or even rapid prototyping techniques, all conclusions should be considered only for the selected 3D printer and selected materials. New materials and new equipment for 3D printing are developed constantly and could demand new analyses.
6
ACKNOW LEDGM ENTThe authors wish to thank Professor Pero Raos and system engineer M iroslav M azurek for supporting the work on this paper; and also Vedran Galeta for the assistance in experiments; and Professor Ž eljka Rosandić for proofreading the manuscript. The work presented in this paper was' financially supported by the M inistry o f Science, Education and Sports, Republic o f Croatia through the scientific project No. 152-
1521473-3111.
7 REFERENCES
[1] Dimitrov, D. et al.( 2006) Advances in three dimensional printing - state o f the art and future perspectives. Rapid Prototyping Journal, voi. 12, no. 3, p. 136-147.
[2] Pilipović, A. et al. (2007) Experimental analysis o f properties o f materials for rapid prototyping. The International Journal o f Advanced Manufacturing Technology.
[3] Yao, A. W. L. and Tseng (2002) Y. C. A robust process optimization for a powder type rapid prototyper. Rapid Prototyping Journal, voi.
8
, no. 3, p. 180-189.[4] Lanzetta, M., Sachs, E. (2003) Improved surface finish in 3D printing using bimodal powder distribution. Rapid Prototyping Journal, voi. 9, no. 3, p. 157-166.
[5] Stampfl, J., Liska, R. (2005) New M aterials for Rapid Prototyping Applications. Macromolecular Chemistry and Physics, no. 206, p. 1253-1256. [
6
] Dimitrov, D. et al. ( 2006) Investigatingthe achievable accuracy o f three dimensional printing. Rapid Prototyping Journal, voi. 12, no 1, p. 42-52.
[7] Patirupanusara, P. et al. (2007) Effect of binder content on the material properties o f polymethyl methacrylate fabricated by three dimensional printing technique.
Journal o f Materials Processing
Technology.
[
8
] Pahole, I. et al. (2005) Rapid prototyping processes give new possibilities to numerical copying techniques. Journal o f Materials Processing Technology, voi. 164-165, p. 1416-1422.[9] W ebster, D. (2007) ZPrint 7.5 Software Manual. Z Corporation, Burlington.
[10] Webster, D. (2006) ZPrinter 310/ DESIGNmate Mx Hardware Manual. Z Corporation, Burlington.
[11] M aterial Safety Data Sheet zp l3 0 Powder. Z Corporation, Burlington, (2007).
[12] Webster, D. (2007) Z-Max™ User Guide High-Strength Epoxy Infiltrant. Z Corporation, Burlington.