Genetic Structure of Salinity Tolerance in Rice at Seedling Stage
Somayeh Sanchouli1, Mahmood Ghorbanzade Neghab1, Hossein Sabouri2 and Mohammad Zare Mehrjerdi1
1 Faculty of Agriculture, Shirvan Higher Education Complex, North Khorassan, Iran
2 Department of Plant Production, Faculty of Agricultural and Natural Resources Sciences, Gonbad Kavous
University, Gonbad Kavous, Iran
A R T I C L E I N F O A B S T R A C T
Article history:
Received 14 January 2019 Accepted 17 February 2019 Available online 29 February 2019
The Oryza sativa L. F8 population derived from a cross between salt tolerance
cv. Ahlemi Tarom and salt sensitive cv. Neda was used in the study. Germinated seeds floated on water for 3 d, and after were transferred to float on Yoshida's nutrient solution for 11 d. two weeks after sowing, the seedling was transferred to nutrient solution containing 51.19 mM NaCl (electrical conductivity 6 dSm-1)
for 7 d, then NaCl concentration was increased to 163.8 mM (12 dSm-1) for
further 7 d.After this period, the traits were measured. The linkage map was performed using F8 populations, 40 SSR markers, 16 ISSR markers (76 alleles),
2 IRAP markers (7 alleles) and iPBS marker (3 alleles). The map length was 1419 cM with an average distance of 13.07 cM between the 2 adjacent markers. The QTL analysis showed that a total of 73 QTLs were identified that controlled 20 traits under normal and stress conditions. Among the QTLs, qCHLN-8, qSLN-8, qWLN-3, qWLN-9, qLAN-3, qLAN-8 and qLAN-9, qRFWN-1, qRFWN-3b and qRFWN-8, qFBN-7, qRDN-1a and qRDN-3 and qNaKSHN-5 under normal conditions and qSL-8, qLL-1a, qNaR-3, qKSH-1 and qKSH-4 and qNaKSH-4 under salinity stress conditions were identified. There are more than 20% explanations for phenotypic changes in the traits. These QTLs, due to the high percentage of justification after validation, could be a good candidate for selection programs with the help of markers in the population of recombinant lines of rice.
2015 UMZ. All rights reserved.
Keywords:
ISSR QTL mapping
Quantitative Traits Loci Salinity SSR
*Corresponding author: H. Sabouri
hos.sabouri@gmail.com
p-ISSN2423-4257 e-ISSN 2588-2589
Please cite this paper as: Sanchouli S, Ghorbanzade Neghab M, Sabouri H, Zare Mehrjerdi M. 2019. Genetic structure of salinity
tolerance in rice at seedling stage. J Genet Resour 5(1): 22-30. doi:10.22080/jgr.2019.16063.1128
Introduction
Rice (Oryza sativa L.) is a major source of food and energy for more than 2.7 billion people on a daily basis and is planted on approximately one-tenth of the earth's arable land (Bizimana et al., 2017). Rice is one of the most important cereal crops and serves as the staple food for over one-third of the world's population (Mohammadi-Nejad et al., 2010). However, the productivity of rice is greatly affected by soil salinity which is the second most widespread soil problem after drought, in rice growing areas of the world (Sabouri and Sabouri, 2008; Islam et al., 2011). Soil salinity is key abiotic stress for crop productivity worldwide and it is a major abiotic stress for rice (Ren et al. 2005; Jing et al. 2017). Salinity is an increasing concern for the productivity of staple food crop. Crops with improved salt tolerance are highly needed to cultivate saline lands (Srivastava et al., 2018).
(2016) identified 6 QTLs for different agronomic traits under salt stress conditions. These QTLs were 52.1% and 65.81% of phenotypic variance. The results reported by Gimhani et al. (2016) showed QTL 83 for 11 traits in response to salinity stress, which explained 5.39 to 49.9% of the phenotypic variance. Although there have been extensive studies on QTL mapping for salinity tolerance in rice, little or no information has been reported on the mapping of salinity tolerance in local rice populations. The aim of the present study was to identify QTLs related to salt tolerance by using the Iranian rice population.
Materials and Methods
Oryza sativa L. F8 population derived from a cross between the salt tolerance Ahlemi Tarom (ATM) and the salt sensitive Neda (NAD) were used in this study. The genetic material which involved 96 lines was used to evaluate salt tolerance. The seeds placed at 50 ˚C for 3 d to break dormancy, then germinated at 35 ˚C for 48 h. Finally, the germinated seeds were sown in holes of the Styrofoam board with a nylon net bottom, which floated on water for 3 d, and then were transferred to float on Yoshida's nutrient solution (Yoshida et al. 1976) for 11 d. Two weeks after sowing, the seedling was transferred to a nutrient solution containing 51.19 mM of NaCl (electrical conductivity 6 dSm-1) for 7 d, then NaCl concentration was increased to 163.8 mM (12 dSm-1) for further 7 d. This experiment was conducted in the controlled conditions with 16-h photoperiod, the irradiance of 1500 µmol m -2s-1, day/night temperature of 29/21˚C and minimum relative humidity of 70%. The culture solution was renewed weekly and the pH was adjusted daily to 5.5 by addition of either NaOH or HCl. After salt stress exposure for 2 weeks, plants were harvested and the first standard tolerance ranking (STR) test was recorded according to Gregorio et al. (1997). Then, root length (RL), shoot length (SHL), fresh weight of root (FWRO) and fresh weight of shoot (FWSH) were recorded. F8 lines were washed with deionized water and dried in a forced-air oven (70 ˚C). Followed by measuring root dry weight (DRWRO) and shoot dry weight (DWSH). Sodium and potassium of shoot and root were measured according to Thomas et al. (1967) method. DNA was extracted from the main culm at seedling stage according to Saghi Maroof et al (1994) method.
Forty SSR primer pairs, 16 ISSR markers (76 alleles), 2 IRAP markers (7 alleles) and 1 iPBS marker (3
alleles) which were appropriately distributed on 12 rice chromosomes were chosen according to Chen et
al (1997), Temnykh et al. (2000) and Kalendar et al.
(2010). The SSR marker Saltol was used on chromosome 1. In addition, ISSR, iPBS, IRAP markers were used to check the rate of polymorphism from previous articles.
Polymerase chain reaction (PCR) was carried out in a total volume of 0.01 cm-3 containing 2 ng of template DNA, 39.2 µmol dm-3 of each primer, 117.6 mmol dm-3 of dNTP, 156.8 mmol dm-3 of MgCl2, 19.6 unit of Taq polymerase, and 0.098 cm3 of 10× PCR buffer. PCR amplification was performed on a thermal cycler (BIORAD, America) in a genetic laboratory of Gonbad University of Iran. PCR products were separated on 6% (m/v) polyacrylamide gels (38:2 acrylamide:bis acrylamide) and detected by fast silver staining as described by An et al. (2009). Using Mapmanager QtbX17 program, 12 linkage groups were constructed with a minimum LOD score of 2. Map distances between markers were presented in centiMorgan (cM) using the Kosambi function (Kosambi, 1944) of the program.
Results
Under normal conditions, 4 QTLs for stem length (qSLN) were detected on chromosomes of 3, 8, 9 and 10. Among the identified QTLs, qSLN-8 had an explanation of more than 23% for a phenotypic variance. In terms of salt stress for stem length (qSL), 5 QTLs were detected on chromosomes of 3, 8, 9 and 10. Among the identified QTLs, qSL-8 had an explanation of more than 26% for a phenotypic variance. This QTL was common in both normal conditions and salinity stress (Table 1 and 2).
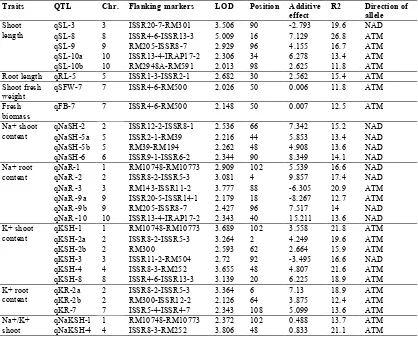
Table 1. Putative QTLs for salt tolerance in the seedling stage the F8 population derived from Ahlemi Tarom*. Direction of allele R2 Additive effect Position LOD Flanking markers Chr. QTL Traits NAD 19.6 -2.793 90 3.506 ISSR20-7-RM301 3 qSL-3 Shoot
length qSL-8 8 ISSR4-6-ISSR13-3 5.009 16 7.129 26.8 ATM
ATM 16.7 4.155 96 2.929 RM205-ISSR8-7 9 qSL-9 ATM 13.4 6.278 34 2.306 ISSR13-4-IRAP17-2 10 qSL-10a ATM 11.8 2.625 98 2.013 RM2948A-RM591 10 qSL-10b ATM 15.4 2.562 30 2.682 ISSR1-3-ISSR2-1 5 qRL-5 Root length ATM 11.8 0.006 50 2.026 ISSR4-6-RM500 7 qSFW-7 Shoot fresh weight ATM 12.5 0.007 50 2.148 ISSR4-6-RM500 7 qFB-7 Fresh biomass NAD 15.2 7.342 66 2.536 ISSR12-2-ISSR8-1 2 qNaSH-2 Na+ shoot
content qNaSH-5a 5 ISSR2-1-RM39 2.216 44 5.853 13.4 NAD
NAD 13.6 4.908 48 2.262 RM39-RM194 5 qNaSH-5b NAD 14.1 8.349 90 2.344 ISSR9-1-ISSR6-2 6 qNaSH-6 NAD 16.6 5.539 102 2.909 RM10748-RM10773 1 qNaR-1 Na+ root
content qNaR -2 2 ISSR8-2-ISSR5-3 3.081 4 9.857 17.4 NAD ATM 20.9 -6.305 88 3.777 RM143-ISSR11-2 3 qNaR -3 ATM 12.7 -8.267 18 2.179 ISSR20-5-ISSR14-1 9 qNaR -9a NAD 14 7.517 96 2.427 RM205-ISSR8-7 9 qNaR -9b NAD 13.6 15.211 40 2.343 ISSR13-4-IRAP17-2 10 qNaR -10 ATM 21.8 3.558 102 3.689 RM10748-RM10773 1 qKSH-1 K+ shoot
content qKSH-2a 2 ISSR8-2-ISSR5-3 3.264 2 4.249 19.6 ATM ATM 15.9 2.664 62 2.593 RM300 2 qKSH-2b NAD 16.6 -3.495 92 2.72 ISSR11-2-RM504 3 qKSH-3 ATM 21.6 4.807 48 3.655 ISSR8-3-RM252 4 qKSH-4 ATM 18.9 6.225 20 3.139 ISSR4-6-ISSR13-3 8 qKSH-8 ATM 18.9 7.13 6 3.364 ISSR8-2-ISSR5-3 2 qKR-2a K+ root
content qKR-2b 2 RM300-ISSR12-2 2.126 64 3.875 12.4 ATM
ATM 13.6 5.099 108 2.343 ISSR5-4-ISSR4-7 7 qKR-7 ATM 13.7 0.488 102 2.372 RM10748-RM10773 1 qNaKSH-1 Na+/K+
shoot qNaKSH-4 4 ISSR8-3-RM252 3.806 48 0.833 21.1 ATM
* Ahlemi Tarom= ATM, a salt tolerance variety; Neda= NAD, a salt sensitive variety.
It additive effect was 7.591 and its LOD was 396.2. No QTL was detected under stress conditions for this attribute (Table 1 and 2). In normal conditions, 1 QTL close to the RM39 marker was detected on chromosome 5. Parent NAD alleles have increased this trait. In terms of salt stress, QTL was detected in chromosome 7 for this trait (Table 1 and 2). In normal conditions, 5 QTLs were identified for Root fresh weight (RFW) on chromosomes 1, 2, 3 and 8, which explaining 18-25% of the phenotypic variance of the trait. The qRFWN-1, qRFWN-3b, and qRFWN-8 had an explanation of more than 20% for phenotypic variance and were close to the RM10773, ISSR11-2 and ISSR 13-3 markers. In the conditions of salinity, there was no genetic location controlling this trait (Table 1 and 2). In normal conditions, 5 QTLs were identified for chromosomes 5, 6 and 7 for fresh biomass (FBN). The qFBN-7 on chromosome 7 justified 21.6% of the phenotypic changes of the trait and had a LOD of 9.13 and an additive
phenotype, and they were called "major effect QTL". Their additive effects were 174.1 and -0.19 respectively. In the salinity stress conditions, the location of the root diameter controller gene was not detected.
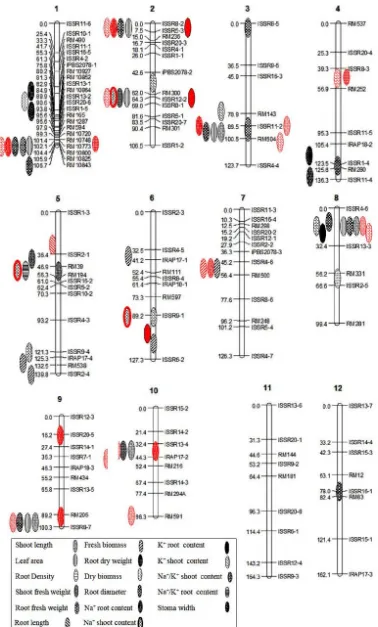
Under normal conditions, 2 QTLs for stomatal width (SWN) were detected on QTLs 1 and 4. These QTLs justified less than 10% of ariance of adjunctive phenotype. The alleles of the parent NAD reduced this trait. In salt stress conditions, the location of gene controller was not detected (Table 1 and 2). In normal conditions, no QTL was detected for sodium stem concentration while in salinity stress, 4 QTLs were detected on sodium stem concentrations (NaSH) on chromosomes 2, 5 and 6. The alleles of Neda parent increased this trait in all 4 QTLs. The qNaSH-2, had the highest R2 among these QTLs, with a justification of 15.2% of the phenotype variation (Table 1 and 2). Under normal conditions, 1 QTL was identified on chromosome 4 for sodium root concentrations (NaRN). This QTL explained 12.3% of phenotypic variation and was located at an interval of RM280-ISSR11-4. In terms of salt stress, 6 QTLs were located on chromosomes 1, 2, 3, 9 and 10 for sodium root concentrations (NaR) (Fig. 1). The qNaR-3 had a justification of more than 20% for a phenotypic variance. This QTL was located at the distance between the markers of RM143-ISSR11-2. The effect of this QTL was -6.305, and the alleles of parents of ATM reduced this trait (Table 1 and 2). Under normal conditions, 5 QTLs for potassium stem (KSHN) were detected on chromosomes of 2, 3, 5, 6 and 8. The qKSHN-2 was able to justify 18.2% of the phenotypic variance of the trait. This QTL was closed to the RM300 marker and had an additive effect of 35.3. In salinity stress conditions, 6 QTLs were identified on chromosomes of 1, 2, 3, 4 and 8. The qKSH-1 and qKSH-4 indicated more than 20% of the phenotypic variance of the trait. These QTLs had a positive additive effect of 3.558 and 4.807mg/g, respectively (Table 1 and 2). In salt stress conditions, 3 QTLs for root potassium (KR) were identified on chromosomes of 2 and 7. qKR-2a, qKR-2b and qKR-7 were close to the ISSR5-3, ISSR12-2, and ISSR5-4 markers, respectively, and justified 9.9%, 12.4%, and 13.6% of the phenotypic variance of the attribute. Normally, this QTL attribute was not detected (Table 1
and 2). In normal conditions, 3 QTLs were identified for Na+ to K+ ratio on chromosomes of 2, 5 and 10. The qNaKSH-5 with an effect of 0.319 could justify 30.1% of phenotypic variation of the trait. This QTL was closed to the ISSR2-1 marker. In salinity stress conditions, 2 QTLs were detected for the Na+/K+ ratio on chromosomes of 1 and 4. The qNaKSH-4 was able to explain 21.1% of the phenotypic changes of the trait and had an additive effect of 0.833 mg/g. The alleles ATM have increased this trait (Table 1 and 2). In normal conditions, a QTL was detected for Na+/K+ ratio (NaKRN) on the chromosome of 5. This QTL was located between the RM39-RM194 markers and justified 19.1% of the variance of adjective phenotype. In salt stress conditions, the QTL of Na+/K+ ratio root was not detected (Table 1 and 2).
Discussion
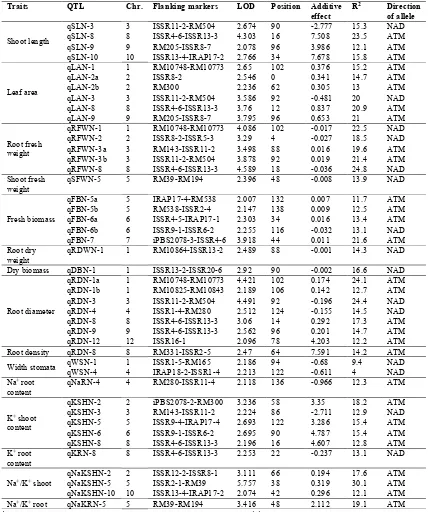
Table 2. Putative QTLs for the normal condition in the seedling stage the F8 population derived from Ahlemi Tarom* Direction of allele R2 Additive effect Position LOD Flanking markers Chr. QTL Traits NAD 15.3 -2.777 90 2.674 ISSR11-2-RM504 3 qSLN-3
Shoot length qSLN-8 8 ISSR4-6-ISSR13-3 4.303 16 7.508 23.5 ATM ATM 12.1 3.986 96 2.078 RM205-ISSR8-7 9 qSLN-9 ATM 15.8 7.678 34 2.766 ISSR13-4-IRAP17-2 10 qSLN-10 ATM 15.2 0.376 102 2.65 RM10748-RM10773 1 qLAN-1 Leaf area ATM 14.7 0.341 0 2.546 ISSR8-2 2 qLAN-2a ATM 13 0.305 62 2.236 RM300 2 qLAN-2b NAD 20 -0.481 92 3.586 ISSR11-2-RM504 3 qLAN-3 ATM 20.9 0.837 12 3.76 ISSR4-6-ISSR13-3 8 qLAN-8 ATM 21 0.653 96 3.795 RM205-ISSR8-7 9 qLAN-9 NAD 22.5 -0.017 102 4.086 RM10748-RM10773 1 qRFWN-1 Root fresh weight NAD 18.5 -0.027 4 3.29 ISSR8-2-ISSR5-3 2 qRFWN-2 ATM 19.6 0.016 88 3.498 RM143-ISSR11-2 3 qRFWN-3a ATM 21.4 0.019 92 3.878 ISSR11-2-RM504 3 qRFWN-3b NAD 24.8 -0.036 18 4.589 ISSR4-6-ISSR13-3 8 qRFWN-8 NAD 13.9 -0.008 48 2.396 RM39-RM194 5 qSFWN-5 Shoot fresh weight ATM 11.7 0.007 132 2.007 IRAP17-4-RM538 5 qFBN-5a Fresh biomass ATM 12.5 0.009 138 2.147 RM538-ISSR2-4 5 qFBN-5b ATM 13.4 0.016 34 2.303 ISSR4-5-IRAP17-1 6 qFBN-6a NAD 13.1 -0.032 116 2.255 ISSR9-1-ISSR6-2 6 qFBN-6b ATM 21.6 0.011 44 3.918 iPBS2078-3-ISSR4-6 7 qFBN-7 NAD 14.3 -0.001 88 2.489 RM10864-ISSR13-2 1 qRDWN-1 Root dry weight NAD 16.6 -0.002 90 2.92 ISSR13-2-ISSR20-6 1 qDBN-1 Dry biomass ATM 24.1 0.174 102 4.421 RM10748-RM10773 1 qRDN-1a Root diameter ATM 12.7 0.142 106 2.189 RM10825-RM10843 1 qRDN-1b NAD 24.4 -0.196 92 4.491 ISSR11-2-RM504 3 qRDN-3 NAD 14.5 -0.155 124 2.512 ISSR1-4-RM280 4 qRDN-4 ATM 17.3 0.292 14 3.06 ISSR4-6-ISSR13-3 8 qRDN-8 ATM 14.7 0.201 96 2.562 ISSR4-6-ISSR13-3 9 qRDN-9 ATM 12.2 4.203 78 2.096 ISSR16-1 12 qRDN-12 ATM 14.2 7.591 64 2.47 RM331-ISSR2-5 8 qRDN-8 Root density NAD 9.4 -0.68 94 2.186 ISSR1-5-RM165 1 qWSN-1 Width stomata NAD 4 -0.611 122 2.213 IRAP18-2-ISSR1-4 4 qWSN-4 ATM 12.3 -0.966 136 2.118 RM280-ISSR11-4 4 qNaRN-4 Na+ root
content ATM 18.2 3.35 58 3.236 iPBS2078-2-RM300 2 qKSHN-2
K+ shoot
content NAD 12.9 -2.711 86 2.224 RM143-ISSR11-2 3 qKSHN-3 ATM 15.4 3.286 122 2.693 ISSR9-4-IRAP17-4 5 qKSHN-5 ATM 15.4 4.787 90 2.695 ISSR9-1-ISSR6-2 6 qKSHN-6 ATM 12.8 4.607 16 2.196 ISSR4-6-ISSR13-3 8 qKSHN-8 NAD 13.1 -0.237 22 2.253 ISSR4-6-ISSR13-3 8 qKRN-8
K+ root
content ATM 17.6 0.194 66 3.111 ISSR12-2-ISSR8-1 2 qNaKSHN-2
Na+/K+ shoot qNaKSHN-5 5 ISSR2-1-RM39 5.757 38 0.319 30.1 ATM
ATM 12.1 0.296 42 2.074 ISSR13-4-IRAP17-2 10 qNaKSHN-10 ATM 19.1 2.112 48 3.416 RM39-RM194 5 qNaKRN-5 Na+/K+ root
Here we explored these QTLs associated with Na+ uptake in shoot and root located on chromosomes 1, 2, 3, 5, 6, 9 and 10, which was in compatible with the previous researches.
Jing et al (2017) have identified some QTLs associated with K+ concentrate on chromosome 1. Pandit et al. (2010) have reported 1 QTL associated with K+ concentrate on chromosome 1. In this study, we detected QTLs related to K+ content of shoot and root at the seedling stage. These QTLs were mapped on chromosomes 1, 2, 3, 4, 7 and 8. The qKR-2a, qKR-2b, qKR-7, qKSH-1, qKSH-qKR-2a, qKSH-2b, qKSH-3, qKSH-4, and qKSH-8 explained most of the total phenotypic variation of 18.9, 12.4, 13.6, 21.8, 19.6, 15.9, 16.6, 21.6 and 18.9, respectively.
We found QTLs related to Na+/K+ content ratio on chromosomes 1 and 4. QTLs associated with Na+/K+ content ratio in other reports were found on chromosomes 1 (Dahanayaka et al., 2017; Koyama et al., 2001), 2 (Ming zhe et al., 2005), 4 (Koyama et al., 2001, Dahanayaka et al., 2017) 10 and 12 (Grigorio, 1997). It is probably due to the low density of SSR linkage map.
We found QTL related for dry biomass on chromosome 1 on normal condition. Cui et al (2002) have reported some QTLs for dry biomass on chromosome 1, 3, 5, 6 and 9. In this study, we detected QTLs related shoot fresh weight and root dry weight. which were mapped on chromosomes 5 and 1, respectively. Most of the total phenotypic variation was belonged to qSFWN-5 and qRDWN-1 as 13.9 and 14.3, respectively. Lian et al (2005) identified QTLs for shoot fresh weight on chromosomes 1, 5, 6 and 11. Cui et al (2002) found some QTLs for root dry weight on chromosomes 1, 5 and 10.
Veldboom et al. (1994) showed that correlated traits often have QTLs that map to the same chromosomal region. In the present study, the QTLs associated with LA, RFW and RD in the region of ISSR11-2–RM504 chromosome 3 was overlapped, in normal conditions. The QTLs of qKSHN-8 and qSLN-8 on chromosome 8 and the QTLs of qSLN-9, qLAN-9 and qRDN-9 on chromosome 9 were
found the same map locations, in the distance between RM205-ISSR8-7 markers.
The qLAN-1, qRFWN-1, and qRDN-1 were located on chromosome 1 and at the distance of RM10748-RM10773 marker and had a positive and significant correlation (0.027*). The LA had a high correlation (0.186) with the RD, and this was QTLs in the various traits detected for these traits. In conditions of salt stress, although many QTLs were detected in similar regions, but it had low correlations. For example, qNaR-1 and qKSH-1 were located on chromosome 3 (r=-0.139) and qSL-9 and qNaR-9a were located on chromosome 9 (r=0.027).
According to the results in normal and saline conditions, it seems that there is a polyotropy effect of genes controlling the traits. Sabouri et al (2010) found qNA-3, qSTR-3, and qNAK-3 in chromosome 3 and qNAK-6, qK-6, qNA-6 and qSTR-6 were found at approximately the same map locations in chromosome 6, which indicated the high correlation.
In the present study, QTLs were identified for SHL on chromosomes 8, 9 and 10, which were common in normal and normal stress conditions. Also, in the distance between the ISSR4-6 and ISSR13-3 markers on chromosome 8, the location of the genotype controlling the KSH was detected, which was common in both normal conditions and salinity stress. In this study, genetic locations with more than 20% genes were identified for some traits, including qCHLN-8, qSLN-8, qWLN-3, qWLN-9, qLAN-3, qLAN-8 and qLAN-9, qRFWN-1, qRFWN-3b and qRFWN-8, qFBN-7, qRDN-1a and qRDN-3 and qNaKSHN-5 under normal conditions and qSL-8, qLL-1a, qNaR-3, qKSH-1 and qKSH-4 and qNaKSH-4 under salinity stress condition. These QTLs, due to the high percentage of justification after validation, could be a good candidate for selection programs with the help of markers in the population of recombinant lines of rice.
References
Bizimana JB, Luzi-kihupi A, Murori RW, Singh RK. 2017. Identification of quantitative trait loci for salinity tolerance in rice (Oryza sativa L.) using IR29/Hasawi mapping population. J Genet 96(4):571-582.
Chen X, Temnykh S, Xu Y, Cho YG, McCouch SR. 1997. Development of a microsatellite framework map providing genome-wide coverage in rice (Oryza sativa L.). Theor Appl Genet 95: 553-567. Cui KH, Peng SB, Xing YZ, Xu CG, Yu SB.
2002. Molecular dissection of seedling- vigor and associated physiological traits in rice. Theor Appl Genet 105: 745-753. Dahanayaka BA, Gimhani DR, Kottearachchi
DR, Samarasighe WLG. 2017. QTL mapping for salinity tolerance using elite rice (Oryza sativa) breeding population. SABRAO J Breed Genet 49 (2): 123-134. Gimhani DR, Gregorio GB, Kottearchchi NS,
Samarasinghe WLG. 2016. SNP-based discovery of salinity- tolerant QTLs in a bi-parental population of rice (Oryza sativa). Mol Genet Genomics 291(6):2081-2099. Gregorio GB. 1997. Tagging salinity tolerance
genes in rice using amplified fragment length polymorphism (AFLP). doc. thesis. University of Philippines, Los Banos. Haq TU, Akhtar J, Gorham J, Khalid M. 2008.
Genetic mapping of QTLs, controlling shoot fresh and dry weight under salt stress in rice cross between CO39×Moroberekan. Pak J Bot 40(6):2369-2381.
Islam MR, Salam MA, Hassan L, Collard BCY, Singh RK, Gregorio GB. 2011. QTL mapping for salinity tolerance at seedling stage in rice. Emir J Food Agric 23(2):137-14.
Jing W, Deng P, Cao C, Zhang W. 2017. Fine mapping of qSKC-1, a major quantitative trait locus for shoot K+ concentration, in rice seedlings grown under salt stress. Breed Sci 67:286-295.
Kalendar R, Antonius K, Smýkal P, Schulman AH. 2010. iPBS: a universal method for DNA fingerprinting and retrotransposon isolation. Theor Appl Genet 121(8):1419-30 Khan MSK, Saeed M, Iqbal J. 2016. Quantitative trait locus mapping for salt tolerance at maturity stage in indica rice using replicated F2 population. Braz J Bot 39(2):641-650.
Kosambi DD. 1944. The estimation of map distances from recombination values. Ann Eugen 12:172-175.
Koyama ML, Levesley A, Koebner RMD, Flowers TJ, Yeo AR. 2001. Quantitative trait loci for component physiological traits determining salt tolerance in rice. Plant Physiol 125:406-422.
Lian X, Xing Y, Yan H, Xu G, Li X, Zhang Q. 2005. QTLs for low nitrogen tolerance at seedling stage identified using a recombinant inbred line population derived from an elite rice hybrid. Theor Appl Genet 112:85-96.
Mohammadi-Nejad G, Singh RK, Arzani A, Rezaie AM, Sabouri H, Gregorio GB. 2010. Evaluation of salinity tolerance in rice genotypes. Int J Plant Prod 4:199-208. Pandit A, Rai V, Bal S, Sinha S, Kumar V,
Chauhan M, Gautam RK, Singh R, Sharma PC, Singh AK, Gaikwad K, Sharma TR, Mohapatra T, Singh NK. 2010. Combining QTL mapping and transcriptome profiling of bulked RILs for identification of functional polymorphism for salt tolerance genes in rice (Oryza sativa L.). Mol Genet Genomics 284:121-136.
Pascual ED, Dela-Vina CB, Mendioro MS, Hernandez JE, Amas JC, Sajise AGC, Gregorio CB. 2017. New QTL for salt tolerance at the seedling stage in rice var. Hasawi using recombinant inbred lines. Philipp Agri Sci 100(2):391-401.
Rahman MA, Bimpong IK, Bizmana JB, Pascual ED, Arceta M, Swamy BPM, Diaw F, Rahman MS, Singh RK. 2017. Mapping QTLs using a novel source of salinity tolerance from Hasawi and their interaction with environments in rice. Rice 1-17. Ren HZ, Gao JP, Li LG, Cai XL, Huang W,
Chao DY, Zhu MZ, Wang ZY, Luan S, Lin HX. 2005. A rice quantitative trait locus for salt tolerance encodes a sodium transporter. Nature Genet 37 (10):1141-1146.
Sabouri H, Sabouri A. 2008. New evidence of QTLs attributed to salinity tolerance in rice. Afr J Biotechnol 7:4376-4383.
Sabouri H. 2010. Mapping of QTLs of germination characteristics in rice using microsatellite markers under salin condition. Iranain J Biol 23:333-342. Saghi Maroof MA, Biyaoshev RM, Yang GP,
chromosomal location, and population dynamics. Proc Natl Acad Sci USA 91:4566-5570.
Shahid-Masood, M, Seiji Y, Shinwari ZK, Anwar R. 2004. Mapping quantitative trait loci for salt tolerance in rice using RFLP. Pak J Bot 36(4): 825-834.
Srivastava N, Vadez V, Nigam SN; Upadhyaya HD, Narasu L. 2018. Screening groundnut (Arachis hypogaea L.) germplasm for salinity tolerance. J Genet Res. 4(2):130-140.
Temnykh S, Park WD, Ayres N, Cartinhour S, Hauck N, Lipovich L, Cho YG, Ishii T, McCouch SR. 2000. Mapping and genome organization of microsatellite sequences in
rice (Oryza sativa L.). Theor Appl Genet 100:697-712.
Thomas RL, Sheard RW, Moyer JR. 1967. Comparison of conventional and automated procedures for nitrogen, phosphorus, and potassium analysis of plant material using a single digestion. Agron J 59:240-243. Veldboom LR, Lee M, Woodman WL. 1994.
Molecular-marker facilitated studies in an elite maize population. 1. Linkage analysis and determination of QTL for morphological traits. Theor Appl Genet 88:7-16.