EXCHANGE RATE PASS-THROUGH (ERPT) AND ITS IMPLICATIONS FOR VIETNAM: VECTOR AUTOREGRESSIVE APPROACH FROM VIETNAM-KOREA TRADE DATA
DO Thi My Huong1+
CAO Hong Minh2
1,2Banking Academy of Vietnam
(+ Corresponding author)
ABSTRACT
Article History
Received: 14 November 2018 Revised: 18 December 2018 Accepted: 24 January 2019 Published: 6 March 2019
Keywords
Exchange rate pass-through (ERPT)
Import price Consumer price index Vector Autoregressive model Vietnam
Korea.
JEL Classification:
C32, E31, F31.
This article investigates the exchange rate pass-through (ERPT) into Vietnam’s import price and consumer price index employing the trade data between Vietnam and Korea for the period from Jan 2008 – March 2017 on a monthly basis. From the empirical outcome of the Vector Autoregressive (VAR) model, the ERPT coefficients for import price are quite low and statistically insignificant, which implies that the price of importing goods from Korea might depend mainly on other factors rather than KRW/VND exchange rate. On the contrary, the transmission from exchange rate to Vietnam’s consumer price index is so complete that a 1% shock in exchange rate can cause a change by 0.994% in consumer price index at lag order 2. This result is further confirmed by variance decomposition and Granger causality tests which reveal that the exchange rate shock builds the strongest influence on the fluctuation of Vietnam’s inflation rate.
Contribution/ Originality: This study is one of the first time series studies using the trade data between Vietnam and Korea to investigate ERPT into import prices and inflation in Vietnam. It also contributes to the limited critical review in this domain for the developing countries in South East Asia.
1. INTRODUCTION
In an open and highly integrated economy, exchange rate is one of the most vital macroeconomic factors
having both external and internal impacts. The influence of exchange rate changes on import price, as well as on
inflation, known as exchange rate pass-through (ERPT) has been studied in various research Beirne and
Bijsterbosch (2009); Faruquee (2006); McCarthy (2000); Ihrig et al. (2006). It is commonly seen that most of these
studies have focused on developed countries like the United States, the Euro area, Japan and OECD economies but less is discussed for developing countries. In Vietnam, while there have been a few writings using data from its main trading partners like Japan, no data however can be found in the case of Korea in spite of its having fifth rank in the list of Vietnam’s top trading partners over the last five years. Therefore, this is a major gap in research literature to Asian Economic and Financial Review
ISSN(e): 2222-6737 ISSN(p): 2305-2147
DOI: 10.18488/journal.aefr.2019.92.257.266 Vol. 9, No. 2, 257-266
In January, 2016, State Bank of Vietnam (SBV) announced that that flexible exchange rate mechanism shall be applied, in which exchange rate shall be pegged to eight strong currencies: USD, Bath, Euro, CNY, SGD, JPY, KRW and TWD. Known as one of the five largest trading partners of Vietnam, KRW is added into this basket. Thus, it is vital to make a closer analysis of the import prices and the inflation response to exchange rate shocks. This study will also suggest how controlling inflation effectively is always the top priority of policymakers in regulating monetary policy and main concerns of all economic researchers.
Graph-1. Vietnam 's top eleven main trading partners over the past five years.
Graph-2. Monthly KRW/VND exchange rate from 2008 to 2017.
2. LITERATURE REVIEW
There are a few studies that have revealed how the magnitude and speed of exchange rate pass-through may change across countries varying on size and openness. For example, a recent study estimating the dynamic exchange rate pass-through to consumer prices for Nigeria (Zubair et al., 2013) suggests that ERPT is found incomplete, low, and fairly slow due to the large share of import in Nigeria’s consumption basket. This implies that importers should practice pricing to market strategy for this market. This also suggests that money supply contributes more to inflation compared to the exchange rate. Bangura et al. (2012) presented a result of their study which revealed that although ERPT is incomplete but significant, suggesting that exchange depreciation is a potential significant source of inflation in this country. In another research (Bussière et al., 2014; Oloba, 2014;
Prempeh et al., 2017) conclude that import price elasticity tends to be correlated across countries and is found
higher in emerging market economies than in advanced economies. These studies overall emphasizes upon an enhanced understanding of exchange rate pass-through, particularly highlighting the role of external factors in economic management in almost countries.
In Asia region, there are only a few studies on ERPT. Cortinhas (2007) investigates the degree of exchange rate pass-through to domestic price in all five members of ASEAN. While there is no evidence of exchange rate pass-through to import prices in Philippines, Thailand exhibits a clear case of exchange rate pass-through to import prices. In the case of Singapore and Malaysia, there appears to be a case of exchange rate disconnect. Another study
by Ghosh and Rajan (2007) suggests that since Asian economies are highly trade-dependent they are potentially
susceptible to ERPT into domestic inflation via import price. Parsons and Sato (2004) estimate ERPT for four Southeast Asian countries, Indonesia, Thailand, Malaysia and the Philippines in terms of Japanese goods. The study reveals empirically that aggregate changes in the US dollar surpasses the import prices in these countries, while very little evidence is seen of ERPT of Japanese yen making an impact on the import prices in the ASEAN economies.
In Vietnam, there are a few studies in this field including Vo (2009); Nguyen and Nguyen (2010); Nguyen and
Luc (2012). “Using diverse methods including VAR, VECM, and OLS, the researchers demonstrate that the
pass-through to domestic prices is incomplete, but does not address the pass-pass-through inflation linkage”. Nhung and
Huyen (2017) use 7 main trading partners’ trade data at a highly disaggreated HS-9 digit that results in full
pass-through exchange rate movements to Vietnam imports except for electronic industry. However, there are very few studies focusing on the ERPT in the context of Vietnam import prices from Korea trade in spite of the fact that Korea has been the fifth largest trading partners over the past five years.
In terms of methodology, the estimation of pass-through is usually both single equation and system based approach. This includes 3 methods to measure ERPT: linear, Vector Error Correction Model (VECM) and VAR.
Ihrig et al. (2006) and Campa and Goldberg (2005) have used the linear approaches model. VECM method to
measure ERPT was used in studies such as Beirne and Bijsterbosch (2009). Finally, the VAR approach has proved to be the most popular method used by many researchers. According to Faruquee (2006) the VAR approach has several advantages compared with single-equation methods. In fact, after running VAR model, Cholesky variance decomposition can be applied to identify specific structural shocks affecting the system. Using this identification scheme, one can map the empirical results into a well-defined shock in an economic model of incomplete pass-through.
3. RESEARCH METHODOLOGY, EMPIRICAL FRAMEWORK AND DATA DESCRIPTION
3.1. Methodology
The study is developed upon two basic concepts including Purchasing Power Parity (PPP) Theory and Pricing to Market by Krugman (1986). PPP presents the direct channels of transmission of ERPT into import prices. The Pricing to Market may be used as the theoretical explanation of degree of exchange rate pass-through found in countries with high percentage of imported goods.
Purchasing power parity (PPP) is the theory that is used to conduct empirical framework. The theory shows two currencies are in equilibrium or at par when a market basket is priced the same in both countries. The equation is described as follows:
(1)
Where h denotes the home country, f is the foreign country; is the imported price measured in home
country; currency. is the export price measured in foreign country currency, E is the nominal exchange rate
between home currency and foreign currency.
Based on this law, one to one relationship between the exchange rate and domestic prices occurs which suggests a complete pass-through. However, Krugman (1986) provides additional explanation of the empirical findings of incomplete pass-through. His theory postulates that because of market and product segmentations, exporting firms discriminate prices across destination market. Exporting firms set their prices as the sum of marginal cost and destination specific mark- up. These destination specific mark-ups are adjusted in response to exchange rate changes, there by absorbing part, or all, of the exchange rate change. The markup is presented as follows:
(2)
(3)
Where shows competitive pressure in the home country market and represents demand pressure in
both home and foreign market. From there above equations, we get:
(4)
We take logarithm equation:
(6)
This equation shows that import price is affected by the exchange rate e, marginal cost of production of foreign firms c*, the home price level p and market demand for both home and foreign country y. The elasticity of import
price with respect to the change of exchange rate is called ERPT shown as . If , there are complete
pass-through effects. If , we have zero pass-through and if we have limited or incomplete
pass-through.
3.2. Empirical Framework
Initially, this study used VAR approach in E-views 9 to measure the level of ERPT. Second, Impulse Response test, Variance Decomposition and Granger Causality test were used to identify specific structural shocks to the
system. The study followed the matrix of VAR approach by McCarthy (2000):
(7)
Where Yt denotes 6 vectors of variables [IMP, NEER, OPI, CPI, OUTPUT GAP, TRADE OPENNESS], ω0 is intercept, βi is coefficient of matrices 6x6 and ut is error term.
IMP: Import price index. OPI: oil price index, NEER: nominal effective exchange rate between KRW and VND, CPI: consumer price index, Output gap and Trade openness.
3.3. Data Description
In order to estimate ERPT into import price and domestic price index, this study employed monthly time series data from January 2008 to March 2017. The data was collected from International Financial Statistics (IFS) by IMF and Vietnam’s General Statistics Office (GSO). For consistent and effective results, all the variables except for the output gap were taken in the natural logarithms and seasonally adjusted to remove seasonal effects.
The description of data components is as follows:
NEER is monthly nominal exchange rate between KRW and VND. This is calculated by applying exchange rate between USD/KRW and USD/VND, taken from IFS.
Import price index (IMP) is obtained from Korea’s export price index assuming that the export prices of commodities from Korea are the same across all importing markets.
CPI is consumer price index, available from IFS.
Output Gap is used as a proxy for domestic demand pressure. It is defined as the difference between real output and potential output (Output gap = Real GDP – Potential GDP). If the real output is larger than the potential output or the output gap is positive, the economy is growing beyond its full capacity. Hence the output gap is used to measure the excess demand in the economy. Due to the constraint of data availability of monthly GDP, this study used Industrial Production Index (IPI) as a replacement. The Hodrick-Prescott filter in E-views was employed to calculate Output gap.
Oil price is used to capture the foreign demand pressure. This study used UK Brent oil price indices obtained from IFS.
4. EMPIRICAL RESULTS
4.1. Unit Root Tests
The Augmented Dickey-Fuller test (ADF) is conducted to examine whether the time-series data are stationary or not. The results are shown in Table 1. As can be seen from the results of unit root tests, Output gap is stationary while all other variables are integrated series of order one, i.e. I(1) at 1% or 5% level of significance.
Table-1. Unit root tests.
Variables t- statistic ADF test with Interceptp –value ADF test with Intercept and Trendt- statistic p –value
Dlnneer -5.105980* 0.0000 -5.338322* 0.0001
Dlnimp -9.073221* 0.0000 -9.066785* 0.0000
Dlncpi -5.198068* 0.0000 -5.417100* 0.0001
outputgap -5.746012* 0.0000 -5.717739* 0.0000
Dlnoil -6.459865* 0.0000 -6.436315* 0.0000
Dlntrade -4.130180* 0.0014 -4.009481** 0.0114
*: statistical significance at 1%. **: statistical significance at 5%.
4.2. VAR Estimation
The optimal lag length is selected based on different criteria: LR (sequential modified LR test statistic), AIC (Akaike information criterion), HQ (Hannan-Quinn information criterion). The result from lag length selection criteria in Table 2 reveals that the optimal lag order should be 2.
Table-2. Lag length selection criteria.
Lag LogL LR FPE AIC SC HQ
0 740.0399 NA 1.70e-14 -14.68080 -14.52449 -14.61754
1 898.0542 293.9066 1.48e-15 -17.12108 -16.02691 -16.67825
2 1144.670 429.1118 2.21e-17* -21.33340* -19.30137* -20.51100*
3 1157.065 20.07953 3.61e-17 -20.86130 -17.89140 -19.65933
4 1191.064 50.99875* 3.90e-17 -20.82128 -16.91353 -19.23974
5 1222.021 42.72099 4.59e-17 -20.72043 -15.87481 -18.75932
6 1252.597 38.52493 5.62e-17 -20.61193 -14.82846 -18.27126
7 1275.128 25.68551 8.44e-17 -20.34256 -13.62122 -17.62231
8 1307.879 33.40630 1.09e-16 -20.27758 -12.61838 -17.17777
* indicates lag order selected by the criterion.
LR: sequential modified LR test statistic (each test at 5% level). FPE: Final prediction error.
AIC: Akaike information criterion. SC: Schwarz information criterion. HQ: Hannan-Quinn information criterion.
Table-3. Exchange rate pass-through to import price.
Variable Coefficient Standard error
Constant 0.007** 0.003
dlnimp(-1) 0.268* 0.096
dlnimp(-2) -0.348* 0.097
dlnneer(-1) -0.239 0.375
dlnneer(-2) 0.386 0.426
dlncpi(-1) 0.006*** 0.432
dlncpi(-2) 0.679l 0.360
dlnoil(-1) -0.003 0.026
dlnoil(-2) -0.005 0.026
outputgap(-1) 0.0004 0.0003
outputgap(-2) 0.0002 0.0003
Table 3 and Table 4 indicate the exchange rate pass through coefficients to import price and consumer price index respectively. As can be seen from the results, in the case of Vietnam-Korea trade, there is almost a complete transmission of exchange rate to consumer price index. Specifically, at lag order 2, a shock by 1% in exchange rate leads to 0.994% change in consumer price index. The pass-through effect to import price is lower at 0.268% and 0.348% corresponding to 1% change in exchange rate. The coefficients of exchange rate pass-through to import price, however, are statistically insignificant.
Table-4. Exchange rate pass-through to consumer price index.
Variable Coefficient Standard error
Constant 0.0009 0.0008
dlnimp(-1) -0.0006 0.003
dlnimp(-2) 0.0002 0.003
dlnneer(-1) 0.008 0.010
dlnneer(-2) 0.994* 0.011
dlncpi(-1) 0.007 0.011
dlncpi(-2) -0.0005 0.010
dlnoil(-1) 0.0002 0.0007
dlnoil(-2) -0.0004 0.0007
outputgap(-1) 3.35E-06 8.28E-06
outputgap(-2) -2.12E-06 8.53E-06
dlntrade(-1) -3.14E-05 0.0006
dlntrade(-2) 1.16E-05 0.0004
*: statistical significance at 1%. **: statistical significance at 5%. ***: statistical significance at 10%.
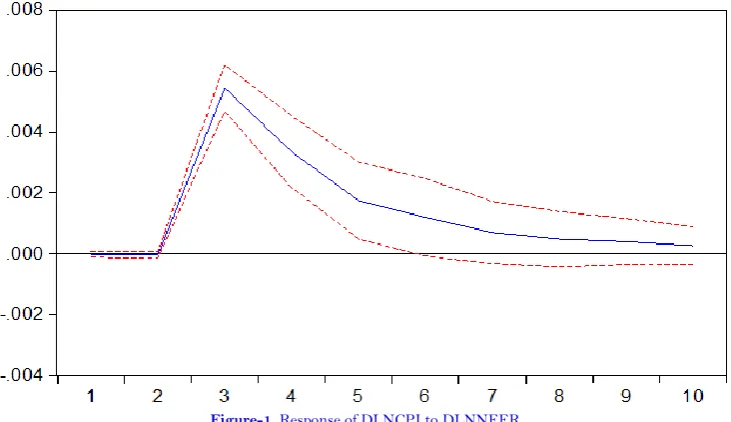
4.3. Impulse Response Function
The next two graphs exhibit typical shocks of NEER and their impact on concerned variables including CPI and IMP through time.
The response of CPI to a shock of NEER is seen as nearly complete pass-through. The highest level can be seen at the third month period which decreases gradually until it comes to zero at the eighth month period.
Import price index reacts slightly to the change of NEER. But this movement is statistically significant from the second month, rather than the third month. It increases from the third month to the fifth month before reducing to nearly zero in the tenth month.
Figure-2. Response of DLNIMP to DLNNEER.
When comparing between the response of import price index and the reaction of CPI to the shock of NEER, it is found that NEER can have greater influence on inflation (CPI) than on import price (CPI).
4.4. Variance Decomposition
Variance decomposition shows which shock is the greatest contributor in explaining the change of a variable through time (in a ten-month period).
Table 5 illustrates that NEER is the most important factor contributing to the movement of CPI variable, accounting for around 93% during this period. This confirms above results. On the other hand, the movement of IMP is mostly explained by its own change in the previous phase, followed by NEER around 6% as shown in Table 6.
Table-5. Variance Decomposition of DLNCPI.
Period S.E. DLNIMP DLNNEER DLNCPI DLNOIL OUTPUT GAP DLNTRADE
1 0.000531 0.155683 0.040790 99.80353 0.000000 0.000000 0.000000 2 0.000533 0.162928 0.500565 99.02747 0.023240 0.272144 0.013657 3 0.005673 6.882113 92.24145 0.873048 0.000837 0.002429 0.000123 4 0.006615 5.203475 93.51834 0.643865 0.526226 0.066883 0.041212 5 0.006849 4.901691 93.77490 0.600566 0.492066 0.191152 0.039621 6 0.006965 4.830544 93.66838 0.581974 0.496489 0.362425 0.060185 7 0.007008 4.888713 93.51425 0.575329 0.524690 0.437416 0.059598 8 0.007029 4.901351 93.43838 0.572005 0.563449 0.465563 0.059249 9 0.007042 4.891341 93.42130 0.569903 0.582150 0.476023 0.059287 10 0.007048 4.885009 93.41573 0.568961 0.590234 0.480638 0.059428
Source: Authors’ calculation using Eviews 9.0.
Table-6. Variance Decomposition of DLNIMP.
Period S.E. DLNIMP DLNNEER DLNCPI DLNOIL OUTPUT GAP DLNTRADE
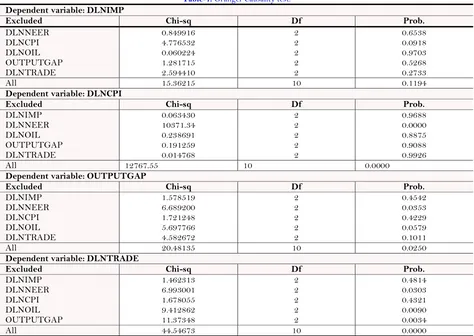
4.5. Granger Causality Test
The above outcomes are further confirmed by the results of Granger causality test shown in Table 7. As indicated, DLNEER Granger causes DLNCPI, which suggests that the domestic inflation rate is directly affected by the fluctuation in exchange rate. Together with DLNOIL, DLNNEER also has direct Granger causality on OUTPUTGAP. DLNNEER, once again, does Granger cause DLNTRADE, implying that the level of trade openness is influenced by the exchange rate trend. The oil price and output gap are also found to have Granger causality on the level of trade openness.
Table-7. Granger Causality test.
Dependent variable: DLNIMP
Excluded Chi-sq Df Prob.
DLNNEER DLNCPI DLNOIL OUTPUTGAP DLNTRADE 0.849916 4.776532 0.060224 1.281715 2.594410 2 2 2 2 2 0.6538 0.0918 0.9703 0.5268 0.2733
All 15.36215 10 0.1194
Dependent variable: DLNCPI
Excluded Chi-sq Df Prob.
DLNIMP DLNNEER DLNOIL OUTPUTGAP DLNTRADE 0.063430 10371.34 0.238691 0.191259 0.014768 2 2 2 2 2 0.9688 0.0000 0.8875 0.9088 0.9926
All 12767.55 10 0.0000
Dependent variable: OUTPUTGAP
Excluded Chi-sq Df Prob.
DLNIMP DLNNEER DLNCPI DLNOIL DLNTRADE 1.578519 6.689200 1.721248 5.697766 4.582672 2 2 2 2 2 0.4542 0.0353 0.4229 0.0579 0.1011
All 20.48135 10 0.0250
Dependent variable: DLNTRADE
Excluded Chi-sq Df Prob.
DLNIMP DLNNEER DLNCPI DLNOIL OUTPUTGAP 1.462313 6.993001 1.678055 9.412862 11.37348 2 2 2 2 2 0.4814 0.0303 0.4321 0.0090 0.0034
All 44.54673 10 0.0000
Source: Authors’ calculation using E-views 9.0.
5. CONCLUSION
Funding: This study received no specific financial support.
Competing Interests: The authors declare that they have no competing interests.
Contributors/Acknowledgement: Both authors contributed equally to the conception and design of the study.
REFERENCES
Bangura, M., E. Caulker and S. Pessima, 2012. Exchange rate pass-through to inflation in Sierra Leone: A structural vector autoregressive approach. Journal of Monetary and Economic Integration, 12(1): 93-123.
Beirne, J. and M. Bijsterbosch, 2009. Exchange rate pass-through in central and eastern European member states. Working Paper No. 1120. European Central Bank, Euro System.
Bussière, M., S. Delle Chiaie and T.A. Peltonen, 2014. Exchange rate pass-through in the global economy: The role of emerging market economies. IMF Economic Review, 62(1): 146-178. Available at: https://doi.org/10.1057/imfer.2014.5. Campa, J.M. and L.S. Goldberg, 2005. Exchange rate pass-through into import prices. Review of Economics and Statistics, 87(4):
679-690.
Cortinhas, C., 2007. Exchange rate pass-through in ASEAN: Implications for the prospects of monetary integration in the region (2007). NIPE Working Paper No. 2/2007.
Faruquee, H., 2006. Exchange rate pass-through in euro area. IMF Staff Papers, 53(1): 63-88.
Ghosh, A. and R.S. Rajan, 2007. A survey of exchange rate pass-Through in Asia. Asian-Pacific Economic Literature, 21(2): 13-28. Available at: https://doi.org/10.1111/j.1467-8411.2007.00199.x-i1.
Ihrig, J., M. Marazzi and A. Rothenberg, 2006. Exchange-rate pass-through in the G-7 countries. International Finance Discussion Papers No. 851.
Krugman, P.R., 1986. Pricing to market when the exchange rate changes. NBER Working Paper No. w1926. Available from SSRN: https://ssrn.com/abstract=278027.
McCarthy, J., 2000. Pass-through of exchange rates and import prices to domestic inflation in some industrialized economies. Working Paper 79, Bank for International Settlements, Basel.
Nguyen, T.N.T. and V.C. Luc, 2012. Exchange rate shift to domestic prices in Vietnam (in Vietnamese). Journal of Development and Integration, 7(17): 7–13.
Nguyen, T.T.H. and D.T. Nguyen, 2010. Macroeconomic determinants of Vietnam’s inflation 2000–2010: Evidence and analysis. VEPR Working Paper, UNDP Vietnam, 1-51.
Nhung, N.C. and T.T.T. Huyen, 2017. Exchange rate pass-through into Vietnamese import prices by industries and by countries. International Business Management, 11(11): 1834-1843.
Oloba, O., 2014. Exchange rate movements, import and economic growth in Nigeria (1986-2010). International Journal of Business, Economics and Management, 1(6): 115-124.
Parsons, C. and K. Sato, 2004. Exchange rate pass-through in ASEAN. Paper Presented at the 9th International Convention of the East Asian Economic Association, Hong Kong, November 12-14.
Prempeh, K.B., A. Sekyere and E.K. Addy, 2017. A multivariate analysis of determinants of profitability: Evidence from selected manufacturing companies listed on the Ghana stock exchange. Journal of Accounting, Business and Finance Research, 2(1): 26-33. Available at: https://doi.org/https://doi.org/10.20448/2002.21.26.33.
Vo, V.M., 2009. Exchange rate pass-through and its implication for inflation in Vietnam (Working Paper No. 0902).
Zubair, A., O. George and A.R. Sanusi, 2013. Exchange rate pass-through to domestic prices in Nigeria: An empirical investigation. Central Bank of Nigeria Economic and Financial Review, 51: 1-28.