CMS detector performance
Daniel Teyssier on behalf of the CMS collaboration1,a
III Phys. Institut A, RWTH Aachen
Abstract. The CMS experiment at the LHC collected in 2011 around 5/fb of integrated luminosity at 7 TeV center-of-mass energy. The CMS detector has shown an excellent data taking efficiency. The global CMS and several subdetector performances will be pre-sented. The goal of the 2012 operations is to collect again 5/fb by the end of June and finally more than 15/fb at the end of 2012, with a new center-of-mass energy at 8 TeV and higher luminosity. The CMS detector should cope with these new conditions and the first results from 2012 data will be given.
1 Introduction
The CMS detector [1] collected already enough data in 2011 and 2012 to cover a broad physics pro-gram. The higher center-of-mass energy at 8 TeV in 2012 allowed to strengthen the Higgs boson sensitivity as well as to look for new physics [2]. We will review the CMS detector performances, starting from all sub-detectors up to the physics object identification.
2 CMS data taking performance
At the end of June 2012, the CMS experiment collected about 5/fb of usable data for analysis at a center-of-mass energy of 7 TeV and the same amount of data at 8 TeV. Fig. 1 shows both delivered and recorded integrated luminosities for the 2011 data. The overall data taking efficiency (defined as the ratio of the recorded over delivered integrated luminosity) by CMS is around 91% in 2011 and 93% in 2012.
We present in Fig. 2 the fraction of operational channels per subdetector. The average value of working channels for all subsystems is around 98%, which shows the good longterm behaviour of the different components. The experiment is closed since 2009 and should be re-opened in 2013 for the first LHC long shutdown, allowing for upgrades and some repairs in order to recover some channels.
3 Status of the different sub-detectors
3.1 Trigger
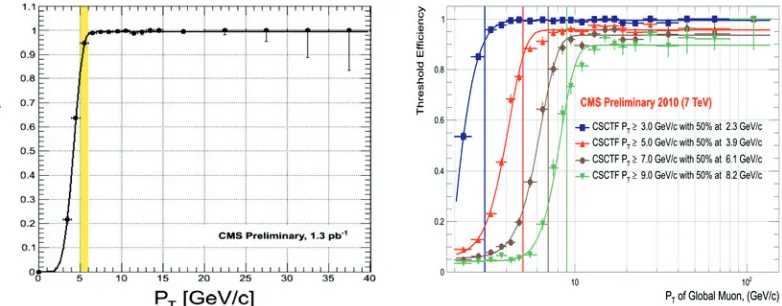
The first step of the data taking is the Level 1 (L1) trigger [1] followed by the High Level Trigger (HLT) [1] in order to reduce the rate of data written on disk. The output of the L1 trigger is 100 kHz while the output of the HLT is around 300 Hz. We present as an example in Fig. 3 and Fig. 4 the turn-on curves for the L1 muons in the barrel (left) and in the endcaps (right) using the first data at 7 TeV. In both cases, a plateau efficiency close to 100% is reached after some lowpT muon cuts. The prescale factors will increase with the instantaneous luminosity to satisfy the requirements of the HLT,
a e-mail:[email protected]
DOI: 10.1051/
C
Owned by the authors, published by EDP Sciences, 2014 ,
/2014 00 020 02 (2014) Conferences
EP Web ofJ 70 0 7 0 ep confj
8 8
Fig. 1.Delivered (red) and recorded (blue) integrated lu-minosity during the 2011 data taking.
Fig. 2. Percentages of working channels for all sub-detectors.
Fig. 3.L1 barrel muon (|η|<1.2) turn-on curve using the first data at 7 TeV.
Fig. 4.L1 endcap muon (1.2<|η|<2.4) turn-on curves using the first data at 7 TeV, presented for several L1 trigger bits usingpT cuts from 3 to 9 GeV.
raising the threshold of the first unprescaled single object triggers. For instance in the latest 2012 data, the first unprescaled HLT single non-isolated muon trigger bit requires the muon to have pT greater than 40 GeV.
3.2 Tracker
The silicon tracker [1] is composed of two parts : the inner part (pixel detector) and the outermost part (strip detector). The pixel detector is the nearest part to the beam pipe and is made of 100·150
3.3 Calorimeters
3.3.1 Electromagnetic calorimeter
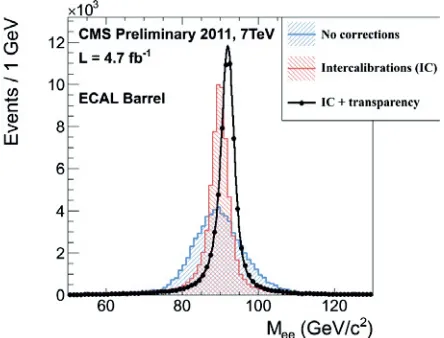
The electromagnetic calorimeter (ECAL) [1] is made of around 76000 scintillating PbWO4 crys-tals. The ECAL barrel energy resolution for electrons had been measured from beam tests :σE/E = 2.8%/√E(GeV)+12%/E (GeV)+0.3%. Fig. 5 shows the reconstructed invariant mass using the Z decaying into electron events in the barrel from the 2011 data [3]. Both distributions using the single channel intercalibration and the transparency correction are also shown. The mass resolution is 1.6% for Z into electron events in the ECAL barrel.
Fig. 5.Reconstructed invariant mass from Z into electron events in the barrel, using the data taken at 7 TeV in 2011. The blue line shows the uncorrected distribution, while the red line is using the single channel intercalibra-tion. The black line shows the result using both intercalibration and transparency correcintercalibra-tion.
3.3.2 Hadronic calorimeter
In the barrel, the hadronic calorimeter (HCAL) [1] is using brass and plastic scintillators with 7000 channels. The forward calorimeters are made with steel and quartz fibres (around 2000 channels). The HCAL design resolution isσE/E = 120%/√E (GeV) +6.9%. Using isolated tracks with a momentum above 5 GeV, the hadronic calorimeter mean response is presented in Fig. 6 (barrel) and Fig. 7 (endcaps) [4], showing a correct scale energy for jet components withpT higher than 15 GeV in both barrel and endcaps.
3.4 Muon system
The muon system [1] is using three different technologies : the drift tubes (DT) in the barrel and the cathode strips chambers (CSC) in the endcaps in order to reach a good spatial resolution, and the resistive plate chambers (RPC, both in barrel and endcaps) for a good timing resolution.
3.4.1 Drift tubes
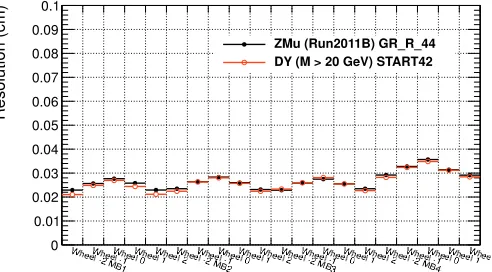
There are 250 DT chambers in the barrel up to|η| =1.2, totalizing 172000 channels. The single hit resolution is in average around 250μm as shown in Fig. 8 using the 2011 data at 7 TeV. The outermost
Fig. 6.HCAL mean response in the barrel, using the first data at 7 TeV.
Fig. 7.HCAL mean response in the endcaps, using the first data at 7 TeV.
chambers (MB4) have a worse resolution as they are only measuring the rφcoordinates : without the
θangle, the time of propagation of the signal along the wires is not corrected.
Fig. 8.The DT single hit resolution is shown for the five wheels in the barrel and the four type of chambers, using the 2011 data at 7 TeV. The black line shows the data using Z into muon events and the red line shows the corresponding simulation.
3.4.2 Cathode strips chambers
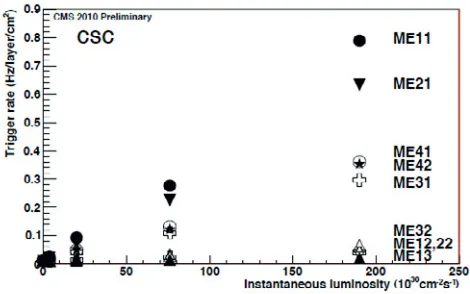
The endcaps contain 468 CSC chambers that cover the region between|η|=0.9 and|η|=2.4, with a total of 180000 channels. The hit resolution is varying between 56 to 140μm. One potential problem of the endcaps is the background increasing with the luminosity. Fig. 9 shows that the trigger rate due to the background only is well under control for the CSC chambers.
3.4.3 Resistive plate chambers
Fig. 9.CSC background trigger rate as a function of the luminosity, using the first data at 7 TeV.
of 3 ns. The RPC chambers allow to give the correct bunch crossing assignment without any ambiguity. Fig. 10 shows the muon efficiency using the DT and CSC muon detectors alone (black curve) and also while adding the RPC chambers (red curve). The muon efficiency using the whole muon system is always higher than 95% and close to 98% for low momentum muons [5]. The usage of the RPC chambers allows to gain in efficiency for the low momentum muons.
Fig. 10.Muon efficiency as a function of the muon momentum in GeV, using the first data at 7 TeV.
4 Object identification performance
4.1 Muons
The muon momentum resolution, combining tracker and muon system, is around 1-2% for muonpT lower than 100 GeV and up to 5% for TeV muons in the barrel. Fig. 11 represents the dimuon mass spectrum collected using a superimposition of the different dimuon trigger paths. It shows also an overview of all resonances ”re-discovered” at the LHC up to the Z boson. The muon resolution is enough to distinguish the low mass resonances, using only the first 2011 data.
Fig. 11.Dimuon masss spectrum using different trigger paths in the 2011 data.
4.2 Jets and missing transverse energy
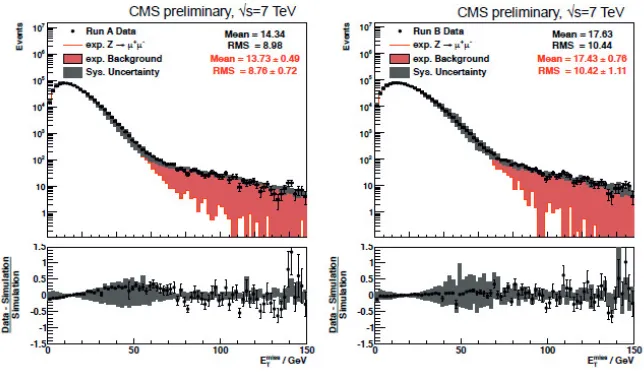
The jet composition using dijet and Zμμ+jet samples shows that there is an agreement between the sim-ulation and the 2011 data for track (charged hadrons), ECAL (photons) and HCAL (neutral hadrons) energies to within 1% in the barrel [6]. Such accuracy is also relevant in order to determine the miss-ing transverse energy (MET), one important miss-ingredient of the searches for supersymetry. The MET should be corrected in the simulation with jet energy scale and the jet energy resolution which is also smeared to match that observed in the data. After such corrections, the MET distributions agree very well between simulation and data as shown in Fig. 12, using Z events decaying into muons [7].
5 Conclusion
The CMS detector performed excellently in all aspects. The data taking efficiency is very high for both 2011 and 2012, and the operational channels fraction is still in average around 98.5% for the various sub-systems. The observed resolutions for all sub-detectors are within the design resolutions, allowing the different objects identification to perform very well. The CMS detector is also ready to cope with higher luminosity and as a consequence higher pile-up conditions.
Acknowledgments
This work was supported by the BMBF (Bundesministerium f¨ur Bildung und Forschung).
References
1. CMS Collaboration,The CMS experiment at the CERN LHC, JINST 3:S08004 (2008).
2. CMS Collaboration,CMS Technical Design Report, Vol. II: Physics Performance, J. Phys. G 34, 995 (2007).
3. CMS Collaboration,ECAL Detector Performance, 2011 Data, CMS DP-2012/007. 4. CMS Collaboration,HCAL Performance from first Collisions Data, CMS DPS-2010/025. 5. CMS Collaboration,Performance of the CMS Resistive Plate Chambers (RPC) in 2011, CMS
DP-2012/001.
6. CMS Collaboration,Jet Energy Scale Performance in 2011, CMS DP-2012/006. 7. CMS Collaboration,MET Performance in 2011 CMS Data, CMS DP-2012/003.