A Real Time System for the Analysis of Sickle
Cell Anemia Blood Smear Images Using Image
Processing
Parvathy B.H.1, Hariharan S2, Aruna N.S.3
U.G Student, Department of Electronics and Communication Engineering, Sahrdaya College of Engineering and Technology, Kodakara, Thrissur, India1
Professor, Department of Electrical and Electronics Engineering, College of Engineering, Trivandrum, Kerala, India2 Research Scholar, Department of Electrical and Electronics Engineering, College of Engineering, Trivandrum, India3
ABSTRACT: Sickle Cell Anaemia is a blood disorder which affects many people in various parts of the world.It not only includes Asia, Africa, Mediterranean region, USA but also in India. This disease mainly affects RBC’s where the RBC will be Sickled in shape or half moon shaped. It is possible to cure this disease easily,if it can be detected at an earlier stage before severe complications occurs. In the present paper we have designed a real time system for the diagnosis of sickle cell anaemia from blood smear images.
KEYWORDS: Sickle Cell Anaemia (SCA), Real time systems, Blood smear images, Digital image processing, Segmentation, Feature Extraction
I. INTRODUCTION
1. Real time processing systems
Real time processing systems are interactive processing systems.It is used to describe the interaction between a human and a computer device for a near instantaneous response of the device to an input by a human user. The result of processing appears effectively and instantaneously once the input is available. A real time system is one that process information and produces a response within a specified time,else risk severe consequences including failure. Real time systems can be classified into two, soft real time systems and hard real time systems. Systems where failure to meet response time constraints leads to catastrophic system failure (Patient dying before corrective action is performed) are called hard real time systems. The systems where uncomfortably long response time are a nuisance but the system still function even if deadlines are sometimes not met are called soft real time systems. A real time image processing platform requires high resolution high frame rate video input, low latency operating system scheduling, high processing performance etc. The advantages of real time image processing are; it is fast and continues,helps to eliminate user errors,allows automating the business if time is very limited, the customer can see the results immediately. The disadvantages of real time systems are a computer must be dedicated to the task and a computer must be continuously online. The applications of real time systems include region of interest processing, formulating the algorithm in a multi resolution frame work, mobile robot, video based interfaces etc.
2. Blood smear image analysis
causes changes in blood cells. Sickle cell anaemia is a blood related disease which causes changes in shape of RBC. In this condition the shape of RBC will become sickle shaped or half moon shaped ones. Sickle cell anaemia is most commonly detected by the examination of RBC. Due to the development of Computer Science, computer vision, digital image processing and pattern recognition several automated methods have been developed by engineers and scientists which makes the analysis process accurate, faster, continuous and interactive within a very small interval of time. Computer based methods are now increasingly used to improve the quality of medical services. Artificial intelligence is the area of computer science focussing on developing machines that can engage on behaviours that humans consider intelligent. In microscopic image analysis we observe the image of blood cells through a microscope attached with a camera interfaced with a computer. Using these arrangements we can acquire the image in the computer. Using suitable algorithms, necessary software can be developed for the detection and diagnostic process, without human errors and relatively faster. Identification of disease is a critical step for curing the disease. Microscopic analysis of peripheral blood smears by medical professionals is an important test in the procedures for the diagnosis of any blood related disease. Accurate diagnosis of disease is critical for curing and controlling the disease. In olden days the process was only carried out by expert medical professionals alone. Now a days these works are carried out by automated systems based on digital image processing algorithms and computer vision methods.
3. Digital image processing
Digital image processing techniques are important in the analysis of medical images. It includes image enhancement, image filtering, segmentation, image masking, edge detection etc. Image enhancement consists of contrast stretching, unsharp masking, edge detection etc. Image filtering is mainly used for removing noise from an image. There are several filtering methods which include, mean filter, median filtering,Gaussian filter, Laplacian filter etc. Segmentation includes region growing, splitting and merging and thresholding etc. Segmentation subdivides an image into its constituent parts. Medical fields like bioinformatics and biomedical imaging are using several machine vision techniques require, image processing components with sufficient accuracy. This is true in biomedical image processing which has experienced vigorous growth. Digital image processing techniques are used today in a wide range of applications; share a common need for methods capable of enhancing pictorial information for human interpolation and analysis. In the image processing after acquiring a digital image, the main tasks are enhancement, segmentation, measurement and data analysis. Image enhancement methods are often used to emphasise certain features and to remove artifacts respectively. Two types of measurements are made; feature measurements are defined by a segmentation process and field measurements are obtained globally from complete images. Finally, these features and field measurements must be analysed.
4. Segmentation Ostu’s segmentation
Otsu’s method is a type of global thresholding in which it depend only gray value of the image. Otsu method was proposed by Scholar Otsu in 1979. Otsu method is global thresholding selection method, which is widely used because it is simple and effective. Otsu’s thresholding chooses the threshold to minimize the intraclass variance of the thresholded black and white pixels. The algorithm assumes that the image contains two classes of pixels following bi-modal histogram (foreground pixels and background pixels), it then calculates the optimum threshold separating the two classes so that their combined spread (intra-class variance) is minimal, or equivalently (because the sum of pairwise squared distances is constant), so that their inter-class variance is maximal.
Watershed segmentation
of water. There are different technical definitions of a watershed. In graphs, watershed lines may be defined on the nodes, on the edges, or hybrid lines on both nodes and edges. Watersheds may also be defined in the continuous domain. There are also many different algorithms to compute watersheds. Watershed algorithm is used in image processing primarily for segmentation purposes.The watershed transform can be classified as a region-based segmentation approach. When simulating this process for image segmentation, two approaches may be used: either one first finds basins, then watersheds by taking a set complement; or one computes a complete partition of the image into basins, and subsequently finds the watersheds by boundary detection. To be more explicit, we will use the expression ‘watershed transform’ to denote a labelling of the image, such that all points of a given catchment basin have the same unique label, and a special label, distinct from all the labels of the catchment basins, is assigned to all points of the watersheds. Watershed transform is not applied to the original image, but to its (morphological) gradient. This produces watersheds at the points of grey value discontinuity, as is commonly desired in image segmentation. Segmentation by watershed transform is a fast, robust and widely used in image processing and analysis, but it suffer from over-segmentation. Watershed represents the boundaries between adjacent catchments. The minimum can be interpreted as markers of watershed regions and the watershed can be interpreted as contours. Many pre-processing techniques are proposed by the different researchers (filters, morphological operators) were then designed to reduce the number of regions not significant.The key points of this method are;Morphologicalreconstruction,Extract the markers of regions application of watershed transform.
5. Feature extraction
Feature extraction deals with extracting features that result in some quantitative information of interest of features that are basic for differentiating one class of objects from another. There are two types of feature extraction geometrical feature extraction and textural feature extraction .The textural feature extraction include either Herralicks features such as energy,entropy, angular second moment, inverse difference moment,etc. or Conner’s features.Geometrical features are extracted in this paper.The area, perimeter,major axis length, minor axis length, formfactor, compactnessare calculated for a single sickle cell.
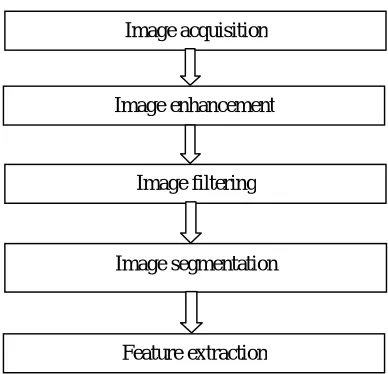
II. BLOCK DIAGRAM FOR DIAGNOSIS BASED ON IMAGE PROCESSING TECHNIQUES
Fig 1 Block schematic of proposed image processing system
III. RELATED WORK
Biomedical images can be classified into macroscopic and microscopic images. Examples of macroscopic images are images of internal organs such as liver, kidney, pancreas etc. Microscopic images include microscopically small objects such as blood cell images. For the diagnosis of blood cell related diseases microscopic image analysis is very important. Many researchers have developed automatic diagnostic systems for the analysis of red blood corpuscles [1-8]. Someother researchers have developed automatic and semiautomatic systems for the studyof whiteblood corpuscles [9-10].
Medical professionals have developed a series of methods for the treatment of sickle cell anemia[11-15].
IV.RESULTS AND DISCUSSIONS
In the present paper a real time system have been designed, developed and implemented. The system makes use of image processing techniques for visualization along with featureextraction to collect quantitative information from images. Image quality have been improved or enhanced with the help of developed software sothat the physician involved in the treatment of this disease can observe the images carefully and based on his/her observation, suitable changes can be made in their treatment methodology. Based on the signs and symptoms first of all the physician will do the diagnosis. By means of a camera attached microscope interfaced with the computer the observed images can be visualized or stored in the memory for further processing.
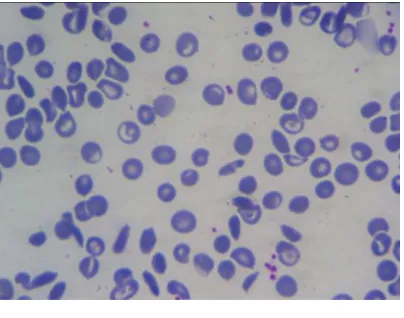
Blood cell images of sickle cell anemia affected patients have been collected from various Government hospitals where people came for treatment purpose. A data base has been prepared with the help of physicians and data analysis is made use for getting the results obtained in this section. Another data set of sickle cell anemia affected patients has been obtained from Gonzalez Hidalgo’s group working in this field. Grey scale images and colour images have been used for image analysis purpose. Image features are extracted from input images and they are tabulated. Image analysis is performed by making use of these features.
The original image is shown in fig. 2(a). Image pre-processing is performed by means of some image processing steps for improving the quality of input image. Image enhancement step is added using un-sharp masking as shown in fig. 2(b) which is one of the most simple and reliable method for implementing in clinical environment. Another basic
Image acquisition
Image enhancement
Image filtering
Image segmentation
image operation filtering which provides good quality input images for the observer. We have implemented few image filtering methods but it is found that median filtering as in fig 2(c) is the one which is more suitable for this work.
After performing these simple pre-processing steps image segmentation is done with the help of watershed segmentation fig 2(d) and Ostu’s segmentation fig 2(e). We could get good segmentation by making use of this method. The region of interest analysis has been implemented for getting better segmentation. Segmentation is a high level image processing technique used in machine vision and image processing which provide very good segmentation result. In this work few image features are estimated such as form factor and compactness.
Form factor = 4* pi* area / perimeter 2 (1) Compactness = Perimeter 2/Area (2)
Form factor gives the classification as normal cell, abnormal cell and sickle cell. The form factor one means the cell is a normal cell. If the form factor is less than one then cell is abnormal. If the form factor is far less than one, then the cell is sickle cell. It is a dimensionless quantity. Compactness is the measure of shape.
Fig 2 (a) Input image
(c)Median filtering
(d)Coloured watershed for visualisation
(e)Ostu’s segmentation
In the table 1 for feature extraction the information about a single sickle cell is studied its area in pixels, perimeterin pixels, major axis length, minor axis length formfactor,compactness are found. This table helps to understand the nature of a single cell. The form factor classifies a cell into three categories normal, abnormal, and sickled cell.
Table1:Table for feature extraction of sickle cell
V. CONCLUSION
Computer aided disease diagnosis system are gaining importance due to their accuracy, reliability fast and continuous operations. Diagnosis is the process of identifying a disease by its signs, symptoms and from the results of various diagnostic procedures. The conclusion reached through this process is called a diagnosis. In this work we have developed a simple, reliable and accurate real time system for the diagnosis of blood cell related disease such as sickle cell anaemia. Image processing techniques are utilised for drawing the clinical information along with other signs and symptoms. For removing the noise necessary filters have to be implemented.For segmenting the images a modified form of watershed algorithm and a thresholding method is utilised.
We have tested this system through two databases .The first one is the data set given by Gonzalez et.al. The second database is collected from the local people affected by sickle cell anaemia with the help of medical professionals who are involved in the treatment of this in the government hospitals. More properties of this model have to be investigated and should be tested on several more databases. However, databases are proprietary and difficult to obtain. Trained and experienced expert services are also required to evaluate the quality of diagnosis performed by the system followed by the adjustment of utilities.
VI.ACKNOWLEDGEMENT
First of all the authors like to express their thanks to Professor Gonzalez for providing their original image databases for sickle cell affected blood smear images without which this work could not be initiated .We thank the doctors of Govt. hospitals ofKerala for providing all helps to collect more data of the patients.
I would like to thank Professor Praveena Department of Biomedical Engineering Sahrdaya College Of EngineeringTrissur Kodakara for helping us to acquire blood smear images of sickle cell anaemia and for permitting us to use their setup of camera attached microscope interfaced with the computer for the visualising sickle cell red blood cells to confirm the disease. We are really indebted to the lab staffs of Biomedical Engineering Department of Sahrdaya College of Engineering and Technology to complete the project in time .The authors also like to thank Center Engineering Research And Development (CERD), Govt. of Kerala College of Engineering Trivandrum for providing some grant for this project.
REFERENCES
[1] P.Paneerselvam,”Application of embedded system for a genetic disease,sickle cell aneamia”,IEEE Transaction on Advances in Electrical Engineering(ICAEE),International conference , DOI:, pp 1-4,9-11 Jan 2014.
CELL NO. Area in pixels Perimeter in pixels Major axis length Minor axis length
Form factor Compactness
1
419
84.42
34.42
15.68
0.7389
17.01
2
531
94.08
36.86
18.51
0.7538
16.66
3
443
99.49
40.91
14.49
0.5623
22.34
4
413
86.52
32.78
16.37
0.6932
18.12
5
473
101.01
35.06
17.66
0.5825
21.57
6
468
109.01
42.59
14.39
0.4949
25.39
7
409
90.08
31.79
16.77
0.6334
19.84
8
489
98.32
31.38
20.17
0.6356
19.77
[2] Sunggwon Yang, “Web based mobile e-Diary for youth with Sickle Cell Disease”,IEEE Transactions on Consumer Communication and Networking Conference (CCNC) , DOI: 10.1109/CCNC.2012.6181012, Pages: 385 - 389,14-17 Jan 2012.
[3] M.Khalaf,A.J Hussain,D.Al-Jumeily,R.Keenan,”Robust Approach for Medical Data Classification and Deploying Self care Management
System for Sickle Cell Disease”,IEEE Transactions on Computer and Information Technology International
conference,DOI: 10.1109/CIT/IUCC/DASC/PICOM.2015.82,Pages: 575 – 580, 26-Oct 2015.
[4] M.Gonzalez-Hidalgo,F.A Gurrero-Pena,S.Herold-Garcia,“Red Blood Cell Cluster Separation from Digital Images for Use in Sickle Cell Disease”,IEEE Transactions on Biomedical and Health Informatics, Volume: 19, Issue: 4, 1514 – 1525, July 2015.
[5] B.Dodda, Basavanagoud, Dr.K Padma Priya, “A comprehensive review on estimating the blood cell count using various advanced techniques” International Journal of Latest Research in Science and Technology Volume 4.Issue 2:pp103-105, March-April 2015.
[6] Menika Sahu, Amit Kumar Biswas, K.Uma, “ Detection of Sickle Aneamia in Red blood cell:A Review”,International Journal of engineering and Applied Sciences(IJEAS),Volume-2,Issue-3,45-48,March 2015.
[7] Fenwa O.D.,Ajala F.A and Adedeji O.T,” Performance Evaluation of selected Noise Removal Algorithms in Sickle Cell Images”, International Journal of Emerging Trends and Technology in Computer Science Volume4,Issue 1,pp1-5,January-February 2015.
[8] Shasi Bala, Amit Doegar, “ Automatic Detection of Sickle cell in Red Blood Cell using Watershed Segmenttion”, International Journal Of Advanced Research In Computer And Communication Engineering, Volume 4, Issue 6, 488-491, June 2015.
[9] Leyza Baldo Dorini,Rodringo Minetto, and Neucimar Jeronima Leite,” Semiautomatic White Blood Cell Segmentation Based on Multiscale Analysis” IEEE Journal of Biomedical and Health Informatics,Volume 17,Issue.1,pages 250-256, Jan 2013.
[10] Sos Agaian, Senior Member, IEEE ,Monica Madhukar, and Antony T. Chronopoulos Senior Member,’’ Automated Screening System for Acute Myelogenous Leukemia Detection in Blood Microscopic Images’ IEEE Systems Journal,vol-8, Issue-3,995-1004, September.
[11] J. Makani,S. F. Ofori-Acquah, O. Nnodu, A. Wonkam, and K. Ohene-Frempong, “Sickle Cell Disease: New Opportunities and Challenges in Africa”, The Scientific World Journal Volume(2013) 2013, Article ID 193252, 16 pages, 2013.
[12] D. Weatherall, K. Hofman, G. Rodgers, J. Ruffin, and S. Hrynkow, “A case for developing North-South partnerships for research in sickle cell disease,” Blood, vol. 105, no. 3, pp. 921–923, 2005.
[13] Abdulrahman Saleh Al-Mulhim,Nedaa Abdullah Aldairi, Bashaeer Abdullah Al-Jalal,Manal Mubarak AlQuaimi, Marwa Fareed Al mulhim,Rehab Omar Al-Moagal.”surgery in sickle cell disease patient”,International journal of clinical and surgical,Volume 2 Issue 2, 39-61, 2014.
[14] ] E. Bollache; N. Kachenoura; R. M. Lang; V. Mor-Avi; A. R. Patel,” Left ventricular-aortic coupling in sickle cell disease underlies diastolic dysfunction”,IEEE conference publications Computing in Cardiology Conference (CinC),ISSN:2325-8861,713-716,6-9 Sept 2015.
[15] G. Washington; J. Ward; M. Kameka,”Spare Me: Towards an Empathetic Tool for Helping Adolescents & Teenagers Cope
with Sickle Cell” ,IEEE conference publications Healthcare Informatics (ICHI), 2015 International Conference