DOI: 10.1534/genetics.107.070821
A Soybean Transcript Map: Gene Distribution, Haplotype and
Single-Nucleotide Polymorphism Analysis
Ik-Young Choi,*
,1David L. Hyten,* Lakshmi K. Matukumalli,
†Qijian Song,*
,‡Julian M. Chaky,
§Charles V. Quigley,* Kevin Chase,** K. Gordon Lark,**
Robert S. Reiter,
††Mun-Sup Yoon,*
,‡‡Eun-Young Hwang,*
,‡Seung-In Yi,*
,§§Nevin D. Young,*** Randy C. Shoemaker,
†††Curtis P. van Tassell,
†James E. Specht
§and Perry B. Cregan*
,2*Soybean Genomics and Improvement Laboratory and†Bovine Functional Genomics Laboratory, USDA, ARS, Beltsville, Maryland 20705, ‡Department of Natural Resources and Landscape Architecture, University of Maryland, College Park, Maryland 20742,§Department of
Agronomy, University of Nebraska, Lincoln, Nebraska 68583-0915,**Department of Biology, University of Utah, Salt Lake City, Utah 84112,††Monsanto, St. Louis, Missouri 63167,‡‡Genetic Resources Division, National Institute of Agricultural
Biotechnology, Rural Development Administration, Suwon, 441-707, Republic of Korea,§§National Seed Management Office, Suwon, 442-400, Republic of Korea,***Department of Plant Pathology,
University of Minnesota, St. Paul, Minnesota 55108 and†††Department of Agronomy, USDA–ARS–CICG, Iowa State University, Ames, Iowa 50011
Manuscript received January 12, 2007 Accepted for publication February 16, 2007
ABSTRACT
The first genetic transcript map of the soybean genome was created by mapping one SNP in each of 1141 genes in one or more of three recombinant inbred line mapping populations, thus providing a picture of the distribution of genic sequences across the mapped portion of the genome. Single-nucleotide polymorphisms (SNPs) were discovered via the resequencing of sequence-tagged sites (STSs) developed from expressed sequence tag (EST) sequence. From an initial set of 9459 polymerase chain reaction primer sets designed to a diverse set of genes, 4240 STSs were amplified and sequenced in each of six diverse soybean genotypes. In the resulting 2.44 Mbp of aligned sequence, a total of 5551 SNPs were discovered, including 4712 single-base changes and 839 indels for an average nucleotide diversity ofu¼ 0.000997. The analysis of the observed genetic distances between adjacent genes vs. the theoretical distribution based upon the assumption of a random distribution of genes across the 20 soybean linkage groups clearly indicated that genes were clustered. Of the 1141 genes, 291 mapped to 72 of the 112 gaps of 5–10 cM in the preexisting simple sequence repeat (SSR)-based map, while 111 genes mapped in 19 of the 26 gaps.10 cM. The addition of 1141 sequence-based genic markers to the soybean genome map will provide an important resource to soybean geneticists for quantitative trait locus discovery and map-based cloning, as well as to soybean breeders who increasingly depend upon marker-assisted selection in cultivar improvement.
T
HE gene space of soybean [Glycine max(L.) Merr.] is as yet undefined. Mudgeet al. (2004) estimatedthat most genes in soybean are clustered in25% of the genome (275 Mbp). One suggestion for providing information relating to gene space was to place 2000– 3000 cDNA sequences onto the physical map (Stacey
et al. 2004). Another approach would be to genetically map coding sequences onto the existing simple sequence repeat (SSR)-based map (Songet al. 2004). The resulting
genetic map would not only indicate the positions of coding sequences, but also answer questions about relationships of coding sequences with existing SSR
and RFLP markers. These relationships are important in map-based cloning, quantitative trait locus discovery, and marker-assisted plant improvement. While a fairly extensive set of.1000 genetically mapped SSR markers is available to soybean breeders and geneticists (Cregan
et al. 1999; Songet al. 2004) the current map has 138
gaps of .5 cM in which no SSR marker is present. Twenty-six of these 138 gaps are.10 cM, which is trou-bling if these regions of low SSR marker density are also gene rich.
The presence of SSRs in expressed sequence tag (EST) sequence provides one means for the genetic mapping of the EST; however, the number of soybean ESTs that contain polymorphic SSRs appears rather lim-ited. Songet al. (2004) were successful in developing
and mapping only 24 polymorphic SSR markers from .136,000 soybean ESTs. Alternatively, discovery of single-nucleotide polymorphisms (SNPs, which include
1Present address:NICEM, CALS, Seoul National University, San 56-1,
Sillim-9-dong, Gwanak-gu, Seoul, 151-921, South Korea.
2Corresponding author:Soybean Genomics and Improvement
Labora-tory, Bldg. 006, Room 100, USDA, ARS, Beltsville, MD 20705. E-mail: [email protected]
single-base changes and insertion/deletions) in genic sequence would provide a source of markers that can be analyzed via PCR and other approaches. Because SNPs are more abundant than SSRs, they improve the odds of success in a diversity of applications including positional cloning, association analysis, QTL mapping, and the determination of genetic relationships among individ-uals. As of December 2006, almost 28 million human SNPs had been cataloged by the National Center for Biotechnology Information SNP database, dbSNP, of which.5.6 million had been validated. The discovery and application of SNPs in plant species has lagged behind that in humans. However, the pace of SNP dis-covery and application has increased in species including
Arabidopsis thaliana (Jander et al. 2002; Schmid et al.
2003, 2005; Nordborget al. 2005), maize (Zea maysL.)
(Tenaillonet al. 2001; Chinget al. 2002), rice (Oryza
sativaL.) (Nasuet al. 2002; Feltuset al. 2004), barley
(Rostokset al. 2005), poplar (Populus trichocarpaTorr. &
Gray) (Tuskan et al. 2006), and a number of other
species.
Two important factors influencing SNP discovery are the frequency of sequence variants and the presence of genome duplications. The frequency of sequence var-iants in soybean is low due to historical genetic bottle-necks and low sequence diversity in soybean’s wild ancestorG. soja(Sieb and Zucc.) (Hyten et al. 2006).
Zhuet al. (2003) reported that SNP frequency as
mea-sured by nucleotide diversity (u) was 0.00053 in 28.7 kbp of coding sequence analyzed in a diverse set of 25 soybean genotypes. There was more than a twofold higher nucleotide diversity in untranslated regions (UTRs), introns, and genomic DNA in close proximity to coding sequence (u ¼ 0.00111). These values are similar to those reported in humans (p ¼ 0.000751) from 1.2 billion bp of aligned human sequence (Sachidanandam
et al. 2001), which indicates that despite the low level of sequence variation, successful SNP discovery is still possible. In addition,.356,000 soybean EST sequences are available in GenBank, suggesting thatin silicoSNP discovery should be successful in soybean. However,in silicoSNP discovery in soybean is impeded by the nature of the soybean genome and limited genotypic diversity of available EST data. Nelsonet al. (2005) suggested the
in silicoanalysis of EST FASTA data as an approach to SNP discovery in an inbred species such as soybean. However, the duplicated nature of the soybean genome and the paucity of a large set of EST data from alter-native genotypes as well as sequencing errors inherent in FASTA data make in silico SNP discovery difficult. As a result of the duplicated nature of the soybean genome, a large proportion of soybean ESTs are mem-bers of paralogous sets of expressed genes. The soybean is likely an ancient tetraploid with a chromosome number of 2n¼40 (Hymowitz2004). Recent analyses
suggest that the soybean genome has undergone two major duplication events (Blanc and Wolfe 2004;
Schlueteret al. 2004). This complicates development
of sequence-tagged sites (STSs) required for resequenc-ing to either validatein silico-derived SNPs or forde novo
SNP discovery. The analysis of EST data to create the set of unique soybean genes or unigenes might reduce the problems associated with genome duplications and expedite selection of robust STSs. Vodkinet al. (2004)
compiled an initial set of 61,127 soybean unigenes on the basis of the alignment of 59ESTs. This was followed by 39-end sequencing of one cDNA from each of 27,513 unigenes. These sequence data provide an important resource for soybean SNP discovery.
The objective of this study was to develop STSs using EST and 39-unigene sequence and then to use the STSs for the discovery of SNPs via the resequencing of six diverse soybean genotypes. SNPs were discovered in .2000 STSs, and.1000 SNPs derived from genic se-quence were genetically mapped to create a transcript map that provides a map-based definition of the soy-bean gene space and will play a key role in the as-sembly of the whole-genome shotgun sequence.
MATERIALS AND METHODS
Plant materials: Zhu et al. (2003) indicated that the sequence analysis of six diverse soybean genotypes Archer, Minsoy, Noir 1, Evans, PI 209332, and Peking would permit discovery of 93% of the common SNPs (frequency .0.10) discovered in a diverse group of 25 genotypes. Among these six genotypes are the parents of four recombinant inbred line (RIL) mapping populations used in our laboratories. DNA of the six genotypes was isolated from bulked leaf tissue as described by Keimet al. (1988).
PCR primer selection in EST clusters:All ESTs available as of August 2003 generated from cultivars Williams and Williams 82 were clustered using the assembly program CAP3 with the requirement that all ESTs within a cluster should have.95% similarity. Each of the clusters was then individually analyzed for the presence of high Phred quality polymorphisms. All like sequences within a cluster were further grouped into smal-ler sets of similar sequences that were likely to be paralogs. Paralog sequence variants (PSVs) were identified and primers were designed to include the PSVs at the 39end of the primers with the intention of providing paralog-specific amplification. Primers were selected using Primer3 (Whitehead Institute, Massachusetts Institute of Technology, MIT).
Preliminary analysis of PCR primers:Each primer pair was used to amplify genomic DNA of Archer soybean. Amplifica-tion reacAmplifica-tions were performed with 20 ng of DNA, 0.1mmof forward and reverse primers, 13FailSafe PCR PreMix B buffer (Epicentre Technologies, Madison, WI) or a buffer consisting of 20 mmTris–HCl (pH 8.0), 50 mmKCl, 200mmeach dNTP, 1.0% glycerol, 1.5 mmMgCl
2, 2.0 ng/ml single-stranded DNA-binding protein, and Taq DNA polymerase in a 10-ml reaction volume (45 sec at 92°, denaturation; 45 sec at 58°, annealing; and 45 sec 68°, extension) for 40 cycles. PCR products were resolved on a 2.5% agarose gel stained with ethidium bromide. Reactions that gave no product or multiple products were reamplified with either a lower (no product) or a higher (multiple products) annealing temperature. The primer pairs that amplified a single discrete product were selected for further analysis.
The amplicon from each selected primer pair was prepared for sequence analysis by treatment with 4 units of shrimp alkaline phosphatase (SAP) and 4 units of exonuclease I incubated at 37°for 1 hr followed by 72°for 15 min to deac-tivate the enzymes. Labeling reactions were performed with 1 ml of PCR product, 0.5ml of BigDye Terminators, version 1.1 or 3.1 (Applied Biosystems, Foster City, CA), 0.3mmof one of the original PCR primers, 13 Taq DNA polymerase buffer (Promega, Madison, WI), and 1.75 mmof MgCl
2 in a 5-ml reaction volume (10 sec at 90°, denaturation; 5 sec at 50°, annealing; 60 sec at 60°, extension) for 40 cycles. The PCR products were labeled from both ends and the resulting termination products were analyzed on an ABI 3730 DNA analyzer. The two resulting sequence traces derived from opposite ends of each amplicon were analyzed and aligned with standard DNA analysis software Phred (Ewingand Green 1998) and Phrap (http://www.phrap.org/). Resulting align-ments and trace data were visually inspected in the Consed viewer (Gordonet al. 1998) to distinguish those amplicons that were locus specific and those that apparently resulted from amplification of two or more paralogous loci. Those primer sets that produced what appeared to be single-locus amplicons were used for PCR amplification of genomic DNA of the other five soybean genotypes Minsoy, Noir 1, Evans, PI 209332, and Peking. Resulting amplicons were treated with SAP and exonuclease I as described above, followed by sequence analysis on the ABI 3730. Forward and reverse sequence traces from the five genotypes as well as that from Archer were analyzed and aligned as described above. SNP discovery was carried out in the sequence alignments with a machine learning algorithm based on PolyBayes SNP discovery software (Marthet al. 1999; Matukumalliet al. 2006a).
Sequence analysis for STS verification and SNP discovery: Sequence traces for each putative SNP identified were visually inspected to verify sequence polymorphisms. Single-nucleotide changes and indels present in each alignment as well as the haplotypes present among the six genotypes were recorded as described by Matukumalliet al. (2006b).
Analysis of introns:Consensus sequence obtained from the Phrap alignment of the six soybean genotypes was aligned with the EST sequence to which primers were designed with the software alignment program bl2seq (http://www.ncbi.nlm. nih.gov) to determine the presence and length of introns.
Genetic mapping of SNP-containing loci: One SNP was mapped from SNP-containing STSs derived from the EST clusters and 39unigene sequence, as well as from the sequence of soybean genes deposited in GenBank. The allele present at each SNP locus was determined using single-base extension on either the Sequenom MassARRAY platform or the Luminex flow cytometer. The MassARRAY system is based on single-base primer extension technology. The MassARRAY technology uses matrix-assisted laser desorption ionization time-of-flight
(MALDI-TOF) mass spectrometry to measure directly the mass of the extension product(s) and then correlates the detected mass with a specific genotype (Griffinet al. 1999). Details of the protocol are available on the Sequenom web site: http:// www.sequenom.com/applications/hme_assay.php. Single-base extension technology was also used to map SNP-containing loci on the Luminex flow cytometer as described by Chen et al. (2000). SNPs were mapped in three different mapping populations including the University of Utah Minsoy3Noir 1 (M3N) and Minsoy3Archer (M3A) as well as the Evans3
PI 209332 (E 3PI) (Concibidoet al. 1996) RIL mapping populations. The first two populations were used in creating the current integrated linkage map (Songet al. 2004). A total of 89 RILs from the M3A population were assayed using the MassARRAY technology and the Luminex flow cytometry system. In the case of the M3N population, 89 RILs were assayed using MassARRAY genotyping and 75 RILs were genotyped using the Luminex flow cytometer. A total of 77 F6-derived RILs from E3PI were used for genetic mapping. SNPs in 500 genes in the M3N and 501 genes in the M3A populations, respectively, were analyzed using the MassARRAY system. SNPs in 337 genes in the M3N and 128 genes in the M
3 A populations, respectively, were analyzed using the Luminex flow cytometer. One hundred forty-six genes were mapped in the E3 PI population using the Luminex flow cytometer. A total of 233 SNPs in the M3N and 115 SNPs in the M3 A populations were genotyped using both analysis platforms. In those cases in which the same SNP was mapped using both the MassARRAY and Luminex systems, genotyping data with the least amount of missing data were used in map construction. To provide a set of markers common to the three mapping populations to expedite the JoinMap linkage anal-ysis, 77 RILs of the Evans3PI 209332 were genotyped with 155 SSR loci using the analysis system described by Wang et al. (2003).
Statistical analyses:Nucleotide diversity:Nucleotide diversity (u) was estimated as per Halushkaet al. (1999),
u¼K=aL
a¼X n
i¼2
1=ði1Þ;
whereKis the number of SNPs identified in an alignment ofn genotypes, L bp in length. Nucleotide diversity was deter-mined in both the intron and the exon sequence.
Haplotype diversity: Haplotype diversity was calculated in a manner identical to the calculation of gene diversity (Weir 1996) as 1PP2
ij, where Pij is the frequency of the jth
haplotype for theith locus summed across all haplotypes in the locus.
Distribution of SNPs in STSs: To determine if SNPs were evenly distributed in the fragments assayed, the theoretical SNP cumulative frequency distribution for SNPs was calcu-lated on the basis of the assumption of uniform distribution. This distribution was compared with the actual cumulative frequency distribution in these fragments using a Kolmogorov– Smirnov (KS) test (Gibbons1976). The KS test assessed the degree of agreement between a sample of empirically gath-ered values and a target theoretical distribution.
Consensus map construction: The data sets for JoinMap analysis consisted of 1023 A81-356022 3PI 468916, 1610 M
alphanumeric codes described by Creganet al. (1999) and Songet al. (2004). Recombination values were converted to genetic distances using the Kosambi mapping function.
Distribution of genic sequences—test of goodness-of-fit of theoretical and observed numbers of newly mapped genes to each linkage group: The chi-square statistic is commonly used to test for goodness-of-fit of an observed to a theoretical distribution. However, the test of each individual linkage group is problematic due to null degrees of freedom. Therefore, a permutation algorithm was designed to assess the significance level. For each permuta-tion, a total of 1141 SNP markers were randomly assigned to any position in a total length of 2388.61 cM (the total length of the 20 linkage groups) at 0.01-cM intervals. The theoretical number of genes assigned to each linkage group was com-pared to the observed number of genes mapped to each link-age group for each of 5000 permutations. The probability of goodness-of-fit was measured by the proportion of times that the observed number of genes in each linkage group was larger or smaller than expectation.
Distribution of genes within linkage groups: The theoretical distribution of map distances between adjacent genic sequences within linkage groups was estimated on the basis of the assumption of a random distribution of markers over the total length of the linkage map. The goodness-of-fit between observed and theoretical distributions was tested using chi-square analysis. Distribution of genes vs. SSR and RFLP loci:To estimate the relative proximities of genes on the newly developed tran-script map with the preexisting SSR and RFLP loci, the genetic distance between each SSR and RFLP locus to the two flanking genic loci was determined. Genic loci included both the loci mapped in this study as well as classical genes that were previously mapped and 37 genes that were mapped by virtue of an SSR they contained. The SSRs in these 37 genes were not included in the analysis. The proportions of genetic distances that fell in classes of 0.0–0.1 cM, 0.1–0.2 cM, 0.2–0.3 cM, etc., intervals were calculated both for SSRsvs. genes and for RFLPsvs. genes. The proportions of genetic distances
in the various distance classes allowed a comparison of the relative genetic proximities of SSR and RFLP loci to adjacent genes.
RESULTS
SNPs in EST clusters: A total of 160,000 ESTs from
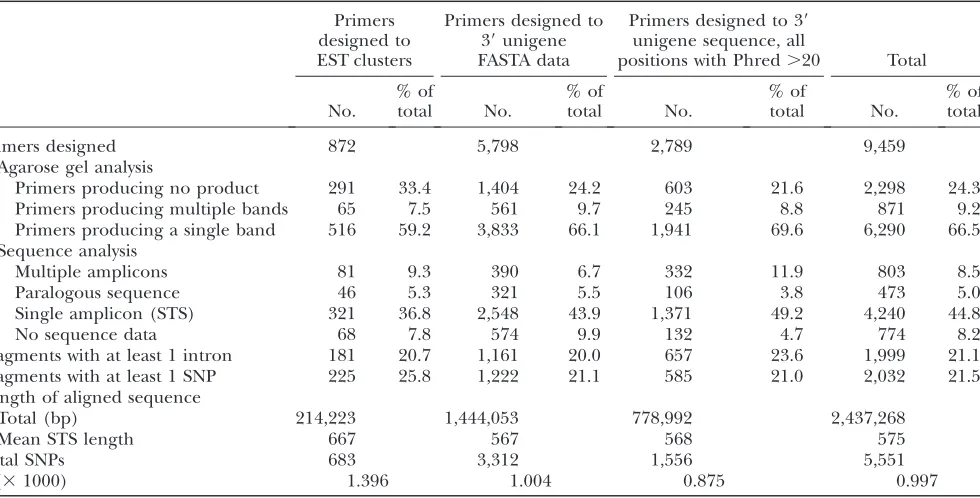
cultivars Williams and Williams 82 were clustered using CAP3 and then further grouped into subsets believed to correspond to paralogs. Primers were then designed to high Phred quality polymorphisms with the intention of providing paralog specificity. Of 872 primers tested, one-third failed to produce an amplicon and 516 (59.2%) produced a single band on agarose (Table 1). Upon sequence analysis of these amplicons in the genotype Archer, 367 (42.1%) produced generally high-quality sequence data allowing alignment of the 59and 39traces. In a number of instances, the sequence traces contained what appeared to be ‘‘heterozygous’’ posi-tions indicative of either haplotype variation or varia-tion between very similar homeologous loci. The 367 primers pairs that produced good-quality sequence data were used to amplify the corresponding fragment from the five additional genotypes Minsoy, Noir 1, Evans, Peking, and PI 209332 followed by sequence analysis from both ends. Alignment and analysis of these sequence traces with those from Archer soybean indicated that 46 fragments that contained heterozygous positions in Archer soybean also had identical heterozygous bases at the same positions in each of the five other genotypes. A typical example of this phenomenon is illustrated
TABLE 1
Number of PCR primers designed and results of PCR and sequence analysis in six soybean genotypes
Primers designed to EST clusters
Primers designed to 39unigene FASTA data
Primers designed to 39
unigene sequence, all
positions with Phred.20 Total
No.
% of
total No.
% of
total No.
% of
total No.
% of total
Primers designed 872 5,798 2,789 9,459
Agarose gel analysis
Primers producing no product 291 33.4 1,404 24.2 603 21.6 2,298 24.3
Primers producing multiple bands 65 7.5 561 9.7 245 8.8 871 9.2
Primers producing a single band 516 59.2 3,833 66.1 1,941 69.6 6,290 66.5
Sequence analysis
Multiple amplicons 81 9.3 390 6.7 332 11.9 803 8.5
Paralogous sequence 46 5.3 321 5.5 106 3.8 473 5.0
Single amplicon (STS) 321 36.8 2,548 43.9 1,371 49.2 4,240 44.8
No sequence data 68 7.8 574 9.9 132 4.7 774 8.2
Fragments with at least 1 intron 181 20.7 1,161 20.0 657 23.6 1,999 21.1
Fragments with at least 1 SNP 225 25.8 1,222 21.1 585 21.0 2,032 21.5
Length of aligned sequence
Total (bp) 214,223 1,444,053 778,992 2,437,268
Mean STS length 667 567 568 575
Total SNPs 683 3,312 1,556 5,551
in supplemental Figure 1 at http://www.genetics.org/ supplemental/ and suggested that the variation was PSV rather than haplotype variation. The analysis of the remaining 321 alignments indicated that they were the result of amplification from a single locus,i.e., an STS. One hundred eighty-one of these STSs contained one or more introns and 225 (25.8% of 872 primer pairs analyzed) contained at least one single-base change or indel, as detected by PolyBayes and verified by visual inspection of the alignments. The 321 STSs contained 214.2 kbp of aligned sequence and a nucleotide di-versity ofu¼0.001396.
SNP discovery in primers designed to 39 unigene
sequence data:In an attempt to increase primer
specifi-city, 39unigene sequence data were used in primer design such that one primer was positioned as far to the 39end of the unigene as possible. Of those primers designed to FASTA data, 24.2% did not produce a PCR product, which is slightly higher than the 21.6% that did not produce a PCR product when quality scores were used in primer design (Table 1). The proportion of primer sets that amplified multiple or paralogous loci was slightly different between the two groups. However, the pro-portion of primer pairs that resulted in an STS when primers were designed to sequence with a Phred score of$20 was 49.2%, which was greater than the 43.9% of successful STSs produced when primers were designed to FASTA sequence.
A total 8587 primer sets were designed to 39unigene sequence of which 4346 produced high-quality se-quence data from the analysis of the STSs amplified from genomic DNA of Archer soybean. As was the case with primers designed to the EST clusters, a number of the sequence traces contained heterozygous positions. The subsequent analysis of the 4346 amplicons from the five genotypes Minsoy, Noir 1, Evans, Peking, and PI 209332 indicated that in 427 alignments of traces from the six genotypes each of the genotypes had ‘‘hetero-zygotes’’ at the same positions, indicating that variation was between paralogs as described earlier and illustrated in supplemental Figure 1 at http://www.genetics.org/ supplemental/. A total of 3919 of the primers designed to 39unigene sequence resulted in what appeared to be a robust STS as indicated by the sequence analysis of the six genotypes and 1807 of these contained at least one
SNP. Thus, 21% of the primer pairs tested resulted in an SNP-containing amplicon.
Multiple amplicons: A total of 22.7% of the primers
designed and tested produced (1) multiple products on an agarose gel (9.2%), (2) multiple amplicons as de-termined by sequence analysis (8.5%), or (3) evidence of PSV as depicted in supplemental Figure 1 at http:// www.genetics.org/supplemental/ (5.0%).
Heterogeneity of nucleotide diversity among genes:
The analysis of 9459 primer pairs resulted in the devel-opment of 4240 sequence-tagged sites with an average length of 575 bp and a mean of 1.31 SNPs per fragment. The nucleotide diversity in the 2.44 Mbp of aligned genic sequence wasu¼0.000997. More than half of the gene fragments had no sequence variation, which suggested an uneven distribution of sequence variation among the fragments. The Kolmogorov–Smirnov test was con-ducted to compare the observed cumulative frequency distributions of SNPs in fragments with the theoretical distributions based upon the assumption of mutations being evenly distributed across the 4240 fragments. The observed and theoretical frequency distributions were determined to be significantly different (P , 0.01), indicating that there was heterogeneity in the nucleo-tide diversity of gene fragments analyzed in this study.
Characteristics of SNPs in exons and introns: The
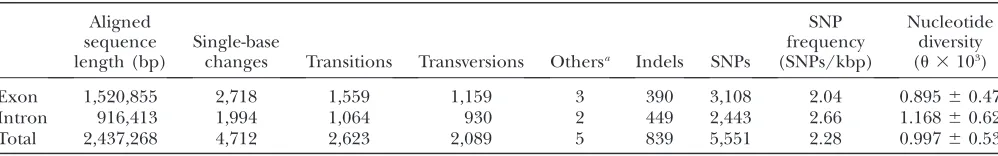
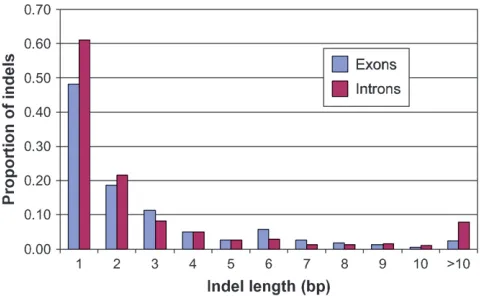
aligned sequence of the 4240 STSs resulted in the dis-covery of 5551 SNPs (Table 2). The analysis of the aligned sequence indicated that 91.6 kbp (37.6%) was intron sequence with a mean of 1.64 introns per gene fragment and an average intron length of 279 bp. The number of introns per gene fragment ranged from 1 to 8 and there were 2.66 SNPs/kbp in introns vs. 2.04 SNPs/kbp in exon sequence. Thus, the intron nucleo-tide diversity (u¼0.001168) was somewhat greater than that in the exons (u¼0.000895). Approximately 85% of the SNPs were single-base changes of which 55.7% were transitions and 44.3% transversions. In five cases, triallelic single-base changes were discovered in the six genotypes. The remaining 15% of the SNPs were indels that ranged in length from 1 to 104 bp, of which 14.3% were.5 bp in length and 4.8% were.10 bp in length. Fifty-one percent of the 827 indels were 1 bp in length. The distribution of indel lengths in exons and introns indicated that the proportion of indels in different
TABLE 2
Characteristics of SNPs in soybean genic sequence
Aligned sequence length (bp)
Single-base
changes Transitions Transversions Othersa Indels SNPs
SNP frequency (SNPs/kbp)
Nucleotide diversity (u3103)
Exon 1,520,855 2,718 1,559 1,159 3 390 3,108 2.04 0.89560.47
Intron 916,413 1,994 1,064 930 2 449 2,443 2.66 1.16860.62
Total 2,437,268 4,712 2,623 2,089 5 839 5,551 2.28 0.99760.53
a
length classes was fairly similar in exons and introns (Figure 1). There was a slightly higher proportion of indels of 1, 2, and.10 bp in introns while the propor-tion of 3- and 6-bp indels was greater in exons. Information relating to each of the 2032 SNP-containing STSs and the 5551 SNPs discovered as a result of the resequencing analysis is provided at http://bfgl.anri. barc.usda.gov/soybean/ (files: 2032-SNP-containing STS.xls and 5551-SNPs-2032 STS.xls).
Haplotype diversity: Among the six genotypes
ana-lyzed, just two haplotypes were found in 1502 (73.9%) of the 2032 gene fragments that contained a sequence
variant (Table 3). Only two haplotypes were found in 837 fragments with a single sequence variant, as well as many with multiple SNPs. Four or more haplotypes were observed in ,5% of the gene fragments. There was a mean of 2.31 haplotypes in the 2032 SNP-containing genes. Haplotype diversity in gene fragments that contained two or more SNPs was 0.4860.13.
Molecular function of genes: Since genes were
chosen randomly, it was anticipated that a diverse set of genes would be included in this study. This anticipa-tion was realized as is suggested by Figure 2. There were small differences among the proportions of genes in the various gene prediction classes for which primers were designed vs. STSs developed as opposed to those in which sequence diversity was discovered to permit genetic mapping. For example,12% of genes to which primers were designed were in the category of catalytic activity whereas 14% of loci that were mapped were in this category. Similarly, 1.3% of genes to which primers were designed were predicted to function in signal transduction whereas only 0.52% of these genes were mapped. In general, for most gene prediction catego-ries, such differences were relatively minor.
Genetic Mapping of STSs:A total of 1141 genes were
placed on the genetic map by virtue of a segregating SNP mapped in one or more of the three RIL mapping populations. In the case of the M3A population, 115 SNPs were mapped using both the Sequenom Mass Spectrometer MassARRAY technology and the Luminex
TABLE 3
Haplotype numbers in 2032 SNP-containing gene fragments
SNP haplotype no.
SNPs/fragment
Potential
haplotypes 2 3 4 5 6 Total
1 2 837 837
2 4 336 171 1 508
3 6 153 92 16 261
4 6 68 69 14 151
5 6 36 30 12 2 80
6 6 18 20 8 2 48
7 6 15 15 5 3 1 39
8 6 9 14 3 1 27
9 6 9 8 5 22
10 6 8 5 3 16
11 6 1 4 2 7
12 6 2 3 1 6
13 6 4 1 5
14 6 2 1 1 4
15 6 2 1 3
.15 6 6 10 1 1 18
Total fragments 1502 446 73 9 2 2032
Total haplotypes 3004 1338 292 45 12 4691
Proportion with haplotype no. 0.64 0.29 0.06 0.01 0.003
Mean haplotype no./fragment 2.31
flow cytometer on the same set of 89 RILs. Greater than 98.5% of RIL genotype calls were identical using both SNP detection platforms. Loci were placed on the existing framework map, which consists of 1015 SSR and 709 RFLP loci (Songet al. 2004). The genetic map with SSR,
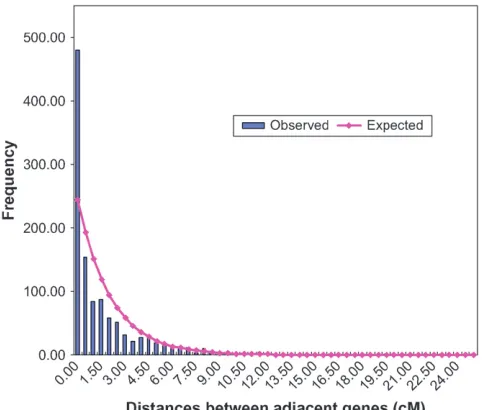
RFLP, SNP, and other loci is provided in supplemental data file 1 at http://www.genetics.org/supplemental/. On the basis of the lengths of the 20 linkage groups in the framework map, the predicted number of genes mapped per linkage group was determined assuming a random distribution of genes. A significantly greater than pre-dicted gene density occurred in 3 of the 20 linkage groups (E, J, and K) (Table 4), while a smaller than expected number of genes mapped to linkage group M. An additional analysis was undertaken to determine the nature of the distribution of genes within linkage groups. The analysis of the theoretical distribution of map distances between adjacent genic sequences clearly indicated that genes were clustered (Figure 3).
Distribution of genes vs. SSR and RFLP loci: To
estimate the relative proximities of genes on the newly developed transcript map to the preexisting SSR and RFLP loci, genetic distances of each SSR and RFLP locus to the two closest flanking genic loci were determined. The graph of the proportion of SSR and RFLP loci that fall at various intervals from the closest two flanking genes suggested little difference between the proxim-ities of SSR and RFLP loci to genes (Figure 4). However, a higher proportion of SSRs appeared to be in very close
proximity (0.0–0.5 cM) to genes than were RFLP loci. In addition, correlations of the number of genes with SSRs and genes with RFLPs on the 20 soybean linkage groups indicated a moderately strong relationship between SSR density and gene density. The correlation of SSR num-bers per linkage group with genes per linkage group was
r¼0.58 (P¼0.0075), whereas that between the numbers of RFLP loci and genic loci was substantially lower,r¼ 0.25 (P ¼ 0.29). Together these data suggested an ap-parent association between SSRs and genic sequence.
Gaps in the linkage map now populated with SNP
markers:In the Songet al. (2004) linkage map, a total
of 112 and 26 intervals between adjacent SSR markers are.5 and 10 cM, respectively. In the new map, a total of 291 genes were mapped in 72 of the 112 gaps with distances between 5 and 10 cM and 111 genes were mapped in 19 of 26 gaps .10 cM. Thus, sequence-based markers effectively filled many of the gaps between the preexisting sequence-based markers in the linkage map.
A soybean SNP database: To provide web-based
In addition, data related to SNP detection using (1) the Sequenom MassARRAY system including the assay ID, PCR, and single-base extension primer sequences and (2) the Luminex flow cytometer including PCR and
single-base extension primer sequences are available in the database.
DISCUSSION
SNP discovery in soybean:Of a total of 9459 primer
sets designed to EST sequence and examined for locus-specific PCR amplification followed by resequencing for SNP discovery, 21.5% were determined to contain a sequence variant. The low rate of SNP discovery reported here was, first, the result of the inability to develop robust STSs, and, second, the result of the low level of sequence variation in cultivated soybean. The difficulty of STS development stems from a number of factors. To facilitate specificity, the 872 primers designed to ESTs clustered using CAP3 frequently contained a PSV at their 39end. In some instances, the PSV bases may have been reverse transcriptase errors that would result in poor or absent PCR amplification. Reverse transcriptase errors have been documented to occur at frequencies of 1/1000–4000 bases in cDNA synthesis in Drosophila (Stapletonet al. 2002). Primer design across intron–
exon splice sites would also reduce the success of PCR amplification of primers designed to EST sequence. Likewise, the high level of duplication in the soybean genome complicated the development of STSs. More TABLE 4
Existing linkage group lengths, number of SSRs, RFLPs, and other marker types including RAPD, AFLP, and classical and isozyme loci in the SONGet al. (2004) consensus genetic linkage map and newly mapped genes
Linkage group length and preexisting marker nos. Newly mapped genes Linkage
group
Length
(cM) SSR RFLP
Other marker types
Total
markers Observed
Predicted based on LG length x2
A1 102.3 50 37 0 87 53 46 1.07
A2 165.7 64 46 6 116 78 75 0.12
B1 131.8 35 33 3 71 47 65 4.98
B2 125.0 36 42 10 88 47 51 0.31
C1 136.1 43 23 4 70 51 36 6.25
C2 157.9 53 44 3 100 53 70 4.13
D1a 120.9 53 37 11 101 45 52 0.94
D1b 138.0 58 19 4 81 57 69 2.09
D2 140.9 60 19 8 87 77 61 4.20
E 71.3 43 47 13 103 70 50 8.00*
F 151.4 64 41 8 113 72 69 0.13
G 126.0 63 53 13 129 68 53 4.25
H 124.0 38 41 5 84 48 57 1.42
I 120.9 40 32 4 76 54 59 0.42
J 91.2 50 43 5 98 74 44 20.45*
K 120.0 59 24 9 92 69 49 8.16*
L 117.0 52 43 4 99 41 53 2.72
M 146.3 51 24 3 78 39 64 9.77*
N 117.2 45 29 8 82 48 51 0.18
O 146.4 57 32 4 93 51 67 3.82
Total 2550.3 1014 709 125 1848 1141
*Significant deviation (P#0.01) from the predicted number of genes based on linkage group length.
than 20% of primers designed produced either multiple amplicons as determined by agarose gel analysis or single-band amplicons that yielded traces indicative of two or more amplicons. This would be anticipated in light of reports that, on average, a given chromosomal segment is duplicated 2.55 times in the soybean genome and that some segments are present as many as six times (Shoemakeret al. 1996).
The relatively low nucleotide diversity of cultivated soybean also contributed to the difficulty of SNP discovery. In the 2.44 Mbp of aligned sequence, nucle-otide diversity (u¼0.000997) was similar to that reported by Zhuet al. (2003) (u¼0.00086) in 66.6 kbp of coding
sequence and associated introns, untranslated regions, and perigenic sequence. The level of sequence diversity in cultivated soybean in relation to other cultivated spe-cies is relatively low. For example, in rice, Feltuset al.
(2004) reported 1.7 single-base changes plus 0.11 indels/kbp in 358 Mbp of low-copy DNA sequence on the basis of a comparison of draft sequences of the two rice subspeciesO. sativassp.indicaandjaponica. This is equivalent to a nucleotide diversity ofu ¼ 0.00181. A calculation from Kanazinet al. (2002) indicated
nucle-otide diversity ofu ¼ 0.0025 in 21.3 kbp of sequence analyzed in five diverse barley cultivars. Similarly, nucleotide diversity, u¼0.0023, in sorghum (Sorghum bicolor) (Hamblinet al. 2004) is more than twice that of
soybean. In modern maize (Z. maysL.) inbreds, Wright
et al. (2005) reported nucleotide diversity of u ¼ 0.00627, which is more than sixfold that of soybean. A similarly high nucleotide diversity of u ¼ 0.0077 was reported in a comparison of two sugar beet genotypes by Schneider et al. (2001). Along with low sequence
diversity, the heterogeneity of nucleotide diversity across the 2.44 Mbp of sequence analyzed in this study also reduced the number of SNP-containing genic fragments discoveredvs. what would have been antici-pated if polymorphisms had been distributed evenly across the 4240 STSs. This heterogeneity is likely the product of selective sweeps that occurred during soy-bean domestication, which resulted in regions of the cultivated soybean genome in which little or no sequence variation is present. Hytenet al. (2006) reported that
while only 6.8% of genes assayed in 26 wild soybeans [G. soja(Sieb and Zucc.)] contained no sequence variants, 24.5% showed no variation in a set of 52 exoticG. max
germ-plasm accessions. This suggests that nearly one-fifth of the cultivated soybean genome is genetically invariant as a result of selective sweeps associated with domestication.
The proportion of indels to total sequence variants in genic and perigenic sequence in soybean (15%) is quite similar to that reported in Arabidopsis. Schmid et al.
(2003) determined that 14% of sequence polymorphisms they detected via the resequencing of 12 genotypes were indels. In cultivated barley the comparable proportion is somewhat lower (8%) on the basis of an analysis of sequence polymorphisms in five diverse barley cultivars (Kanazin et al. 2002). In contrast, the frequency of
indels in and around maize genes greatly exceeds that reported to date for soybean and other plant species. Bhattramakkiet al. (2002) discovered 655 indels via
the sequence analysis of 502 genic loci (180,618 bp of aligned sequence) by the resequencing of eight diverse maize inbreds. This was an average of one indel every 276 bp. In this study, one indel was found every 2905 bp. While only six genotypes were analyzed in the case of soybean vs. eight in the work of Bhattramakki et al.
(2002), it is clear that the indel frequency is substantially lower in soybean genic sequence than in maize.
Haplotype diversity: The mean number of
haplo-types present among the 6 soybean genohaplo-types in the 2032 SNP-containing STSs was 2.31, which was only a little less than the 2.74 haplotypes found in 96 SNP-containing genic fragments analyzed in 25 diverse soybean genotypes by Zhu et al. (2003). Thus, using
the 6 genotypes identified by Zhuet al. (2003) as a subset
that would identify 93% of the common SNPs (fre-quency $0.10) was apparently successful. The limited haplotype diversity in soybean is comparable to that reported in other crop species. For example, Kilian
et al. (2006) determined haplotype diversity among 20 domesticated barley lines in 7 barley genes and reported an average of 2.4 haplotypes per locus. Another report Figure4.—Proportion of intervals between SSR loci (blue
from barley found an average of 2.81 haplotypes per STS via the analysis of 309 STSs with an average length of 466 bp in 7 cultivated and 1 wild barley (Hordeum vulgaressp.
spontaneum) genotype (Rostokset al. 2005). Chinget al.
(2002) analyzed fragments of 18 genes in 36 maize inbreds and found from 2 to 8 haplotypes with an average of only 4.4 haplotypes per gene. In cultivated soybean, the relatively limited haplotype diversity is suggested to be mainly a result of limited diversity in the wild progenitor compounded by a further loss of diversity as a result of domestication (Hytenet al. 2006).
A more comprehensive soybean genetic map: The
previous version of the soybean genetic map (Songet al.
2004) included 1015 PCR-based markers (SSRs). The addition of 1141 markers based upon gene sequence provides the first transcript map of soybean (supplemental data file 1 at http://www.genetics.org/supplemental/). The diversity of gene function associated with these transcripts offers researchers an opportunity to identify potential candidate genes for.1150 QTL reported thus far in soybean for a variety of traits related to biotic and abiotic stresses, plant growth and morphology, and seed quality (SoyBase: http://soybase.agron.iastate.edu/). This initial transcript map and the additional markers it contains should enhance both applied and basic soy-bean genetics and genomics research, including QTL discovery, marker-assisted selection, map-based cloning, and the anchoring of the physical to the genetic map. Doubling of the number of genetically mapped sequence-based markers is a step forward in creating the resources that will be needed to assemble the whole-genome shot-gun sequence of soybean (Joint Genome Institute
2006).
Distribution of genes and SSR and RFLP markers:
Clustering of the mapped genic loci reported here was not unanticipated. Mudgeet al. (2004) hybridized RFLP
probes derived fromPstI digestion of genomic DNA to arrayed BAC clones. Numerous cases of nonhomolo-gous probes hybridizing to common BAC clones in-dicated that the gene-derived RFLPs were clustered in the genome. These authors concluded that most genes in soybean are clustered in275 Mbp of the genome, which is25% of the 1100-Mbp genome. Our analysis clearly supported gene clustering on the genetic map, although it would be difficult to draw conclusions about the proportion of the genome that is gene richvs. gene poor. Such an analysis should be forthcoming as the soybean physical map progresses and the genome sequence becomes available.
An analysis of DNA sequence data from A. thaliana, rice, soybean, maize, and wheat (Triticum aestivium) (Morganteet al. 2002) concluded that the frequency
of SSRs was significantly higher in transcribed regions and that microsatellites (SSRs) are associated with low-copy portions of plant genomes rather than with regions of repetitive DNA. In contrast, empirical evidence from soybean indicated that end sequences of BAC clones
identified withPstI-derived RFLP probes were reported to have 50% more gene-like sequences and 45% less repetitive sequence than end sequences of BAC clones identified with microsatellite markers (Marek et al.
2001). These data suggested that in relation to SSRs, RFLPs tended to be more closely associated with gene-rich regions. Thus, the 138 gaps of .5 cM between adjacent PCR-based markers (SSRs) in the previous SSR-based genetic map of soybean (Song et al. 2004)
may include regions of interest to soybean genomicists and breeders because these gaps frequently contain one or more RFLP loci. On the basis of the transcript map developed via the positioning of 1141 genes on the preexisting SSR/RFLP map, SSR loci appear to be at least as closely associated with genic sequence as RFLP loci (Figure 4). Thus, whatever the relationship between genic sequence and SSR and RFLP markers, the gene-based SNPs mapped in this study effectively filled many of the 5- and 10-cM gaps in the previous map with at least one new PCR-based marker.
Access to SNP marker technology: The SNP
de-tection used here was conducted using two SNP detec-tion platforms. The Sequenom MassARRAY technology is well established and all the information required including redesigned PCR primers to amplify the SNP-containing fragment as well as the single-base extension primer for detection of the one SNP mapped per STS is available at http://bfgl.anri.barc.usda.gov/soybean/ (file: Sequenom Information.xls). Multiplex assays us-ing the MassARRAY technology can be designed from this information and genotyping services are available commercially. The assays conducted on the Luminex flow cytometer also used single-base extension. Single-base extension primers for the detection of one SNP in each of 502 STSs are available at http://bfgl.anri. barc.usda.gov/soybean/ (file: Luminex Information.xls). The Luminex flow cytometer has been demonstrated to be flexible in that, in addition to single-base extension assays, hybridization-based as well as oligonucleotide ligation assays (OLA) can be used on this platform. A comparison of single-base extension, hybridization, and OLA assays for SNP detection in soybean was reported by Lee et al. (2004). The single-base extension assays
were reported to be quite robust, but once optimized the hybridization system was actually more rapid and less costly per datapoint, making the latter assay more suitable for high-throughput marker-assisted selection. The 1141 gene fragments mapped in this study con-tained a total of 2928 SNPs. The data relating to the allele at each SNP locus in each STS will allow the user to design assays on the basis of an ever increasing number of SNP detection assay systems. These have been reviewed by Syva¨ nen (2001, 2005) and Ng and Liu
not be immediately available to soybean geneticists, a number of systems are currently available in addition to the Sequenom MassARRAY technology and the Lumi-nex flow cytometer. An iLumi-nexpensive and widely used alternative for the detection of a limited number of SNPs is based upon the alteration in a restriction endo-nuclease site by the presence of the SNP. These so-called cleaved amplified polymorphic sequences (CAPS) mark-ers (Glazebrook et al. 1998) have been successfully
used for quite some time. Thus, if a QTL is discovered in a particular region of the genome, SNPs in that region can be identified, assayed, and converted to CAPS markers and used in marker-assisted selection. CAPS assays can be conducted on agarose gels that are available in many plant-breeding laboratories. Indeed, a CAPS marker linked to the importantms2gene for male sterility at the bottom of linkage group O was obtained in this way (J. M. Chakyand J. E. Specht, unpublished results). As
additional SNP markers are placed on the map, more potential SNPs will be available in any given region of the genome from which to design assays for marker-assisted selection.
We thank Tina Sphon, Tad Sonstegard, the Bovine Functional Genomics Laboratory, Animal and Natural Resources Institute, and Beltsville Agricultural Research Center East DNA Sequencing Facility for assistance with the acquisition of sequence data. This work was supported by grants 3212, 4212, and 5212 from the United Soybean Board. The support of the United Soybean Board is greatly appreci-ated. The authors also thank Monsanto for their funding of the SNP genotyping that was conducted at Genaissance Pharmaceuticals by Min Seob Lee (Sequenom, San Diego).
LITERATURE CITED
Bhattramakki, D., M. Dolan, M. Hanafey, R. Wineland, D. Vaske
et al., 2002 Insertion-deletion polymorphisms in 39regions of maize genes occur frequently and can be used as highly informa-tive genetic markers. Plant Mol. Biol.48:539–547.
Blanc, G., and K. H. Wolfe, 2004 Widespread paleopolyploidy in
model plant species inferred from age distributions of duplicate genes. Plant Cell16:1667–1678.
Chen, J., M. A. Iannone, M. S. Li, J. D. Taylor, P. Riverset al.,
2000 A microsphere-based assay for multiplexed single nucleo-tide polymorphism analysis using single base chain extension. Genome Res.10:549–557.
Ching, A., K. S. Caldwell, M. Jung, M. Dolan, O. S. Smithet al.,
2002 SNP frequency, haplotype structure and linkage disequi-librium in elite maize inbred lines. BMC Genet.3:19. Concibido, V. C., R. L. Denny, D. A. Lange, J. H. Orfand N. D.
Young, 1996 RFLP mapping and marker-assisted selection of
soybean cyst nematode resistance in PI 209332. Crop Sci.36:
1643–1650.
Cregan, P. B., T. Jarvik, A. L. Bush, R. C. Shoemaker, K. G. Lark
et al., 1999 An integrated genetic linkage map of the soybean genome. Crop Sci.39:1464–1490.
Ewing, B., and P. Green, 1998 Base-calling of automated sequencer
traces using phred. II. Error probabilities. Genome Res.8:186–194. Feltus, F. A., J. Wan, S. R. Schulze, J. C. Estill, N. Jiang et al.,
2004 An SNP resource for rice genetics and breeding based on subspecies indica and japonica genome alignments. Genome Res.14:1812–1819.
Gibbons, J. D., 1976 Nonparametric Methods for Quantitative Analysis.
Holt, Rinehart and Winston, Austin, TX.
Glazebrook, J., E. Drenkard, D. Preuss and F. M. Ausubel,
1998 Use of cleaved amplified polymorphic sequences (CAPS)
as genetic markers in Arabidopsis thaliana. Methods Mol. Biol.
82:173–182.
Gordon, D., C. Abajianand P. Green, 1998 Consed: a graphical
tool for sequence finishing. Genome Res.8:195–202.
Griffin, T. J., J. G. Hall, J. R. Prudent and L. M. Smith,
1999 Direct genetic analysis by matrix-assisted laser desorption/ ionization mass spectrometry. Proc. Natl. Acad. Sci. USA 96:
6301–6306.
Halushka, M. K., J. B. Fan, K. Bentley, L. Hsie, N. Shen et al.,
1999 Patterns of single-nucleotide polymorphisms in candidate genes for blood-pressure homeostasis. Nat. Genet.22:239–247. Hamblin, M. T., S. E. Mitchell, G. M. White, J. Gallego, R. Kukatla
et al., 2004 Comparative population genetics of the panicoid grasses: sequence polymorphism, linkage disequilibrium and selec-tion in a diverse sample of sorghum bicolor. Genetics167:471–483. Hymowitz, T., 2004 Speciation and cytogenetics, pp. 97–136 in
Soy-beans: Improvement, Production, and Uses, edited by H. R. Boerma
and J. E. Specht. American Society of Agronomy, Crop Science
Society of America, Soil Science Society of America, Madison, WI. Hyten, D. L., Q. Song, Y. Zhu, I. Y. Choi, R. L. Nelson et al.,
2006 Impacts of genetic bottlenecks on soybean genome diver-sity. Proc. Natl. Acad. Sci. USA103:16666–16671.
Jander, G., S. R. Norris, S. D. Rounsley, D. F. Bush, I. M. Levin
et al., 2002 Arabidopsis map-based cloning in the post-genome era. Plant Physiol.129:440–450.
JointGenome Institute, 2006 DOE JGI to decode DNA of
soy-bean, a key alternative energy source (http://www.llnl.gov/ PAO/news/news_releases/2006/NR-06-01-05.html).
Kanazin, V., H. Talbert, D. See, P. DeCamp, E. Nevo et al.,
2002 Discovery and assay of single-nucleotide polymorphisms in barley (Hordeum vulgare). Plant Mol. Biol.48:529–537. Keim, P., T. C. Olsonand R. C. Shoemaker, 1988 A rapid protocol
for isolating soybean DNA. Soybean Genet. Newsl.15:150–152. Kilian, B., H. Ozkan, J. Kohl, A.vonHaeseler, F. Baraleet al.,
2006 Haplotype structure at seven barley genes: relevance to gene pool bottlenecks, phylogeny of ear type and site of barley domestication. Mol. Genet. Genomics276:230–241.
Lee, S. H., D. R. Walker, P. B. Cregan and H. R. Boerma,
2004 Comparison of four flow cytometric SNP detection assays and their use in plant improvement. Theor. Appl. Genet.110:
167–174.
Marek, L. F., J. Mudge, L. Darnielle, D. Grant, N. Hansonet al.,
2001 Soybean genomic survey: BAC-end sequences near RFLP and SSR markers. Genome44:572–581.
Marth, G. T., I. Korf, M. D. Yandell, R. T. Yeh, Z. Guet al., 1999 A
general approach to single-nucleotide polymorphism discovery. Nat. Genet.23:452–456.
Matukumalli, L., J. Grefenstette, D. Hyten, I.-Y. Choi, P. Cregan
et al., 2006a Application of machine learning in SNP discovery. BMC Bioinformtics7:4.
Matukumalli, L., J. Grefenstette, D. Hyten, I.-Y. Choi, P. Cregan
et al., 2006b SNP-PHAGE - high throughput SNP discovery pipeline. BMC Bioinformatics7:468.
Morgante, M., M. Hanafeyand W. Powell, 2002 Microsatellites
are preferentially associated with nonrepetitive DNA in plant ge-nomes. Nat. Genet.30:194–200.
Mudge, J., Y. Huihuang, R. L. Denny, D. K. Howe, D. Daneshet al.,
2004 Soybean bacterial artificial chromosome contigs an-chored with RFLPs: insights into genome duplication and gene clustering. Genome47:361–372.
Nasu, S., J. Suzuki, R. Ohta, K. Hasegawa, R. Yui et al.,
2002 Search for and analysis of single nucleotide polymor-phisms (SNPs) in rice (Oryza sativa, Oryza rufipogon) and estab-lishment of SNP markers. DNA Res.9:163–171.
Nelson, R. T., D. Grantand R. C. Shoemaker, 2005 ESTminer: a
suite of programs for gene and allele identification. Bioinfor-matics21:691–693.
Ng, J. K., and W. T. Liu, 2006 Miniaturized platforms for the
detec-tion of single-nucleotide polymorphisms. Anal. Bioanal. Chem.
386:427–434.
Nordborg, M., T. T. Hu, Y. Ishino, J. Jhaveri, C. Toomajianet al.,
2005 The pattern of polymorphism in Arabidopsis thaliana. PLoS Biol.3:e196.
Rostoks, N., S. Mudie, L. Cardle, J. Russell, L. Ramsay et al.,
based on genes responsive to abiotic stress. Mol. Genet. Ge-nomics274:515–527.
Sachidanandam, R., D. Weissman, S. C. Schmidt, J. M. Kakol, L. D.
Steinet al., 2001 A map of human genome sequence variation
containing 1.42 million single nucleotide polymorphisms. Na-ture409:928–933.
Schlueter, J. A., P. Dixon, C. Granger, D. Grant, L. Clarket al.,
2004 Mining EST databases to resolve evolutionary events in major crop species. Genome47:868–876.
Schmid, K. J., T. R. Sorensen, R. Stracke, O. Torjek, T. Altmann
et al., 2003 Large-scale identification and analysis of genome-wide single-nucleotide polymorphisms for mapping in Arabidop-sis thaliana. Genome Res.13:1250–1257.
Schmid, K. J., S. Ramos-Onsins, H. Ringys-Beckstein, B. Weisshaar
and T. Mitchell-Olds, 2005 A multilocus sequence survey
inArabidopsis thalianareveals a genomewide departure from a neutral model of DNA sequence polymorphism. Genetics169:
1601–1615.
Schneider, K., B. Weisshaar, D. C. Borchardtand F. Salamini,
2001 SNP frequency and allelic haplotype structure of Beta vul-garis expressed genes. Mol. Breed.8:63–74.
Shoemaker, R. C., K. Polzin, J. Labate, J. Specht, E. C. Brummer
et al., 1996 Genome duplication in soybean (Glycine subgenus soja). Genetics144:329–338.
Song, Q. J., L. F. Marek, R. C. Shoemaker, K. G. Lark, V. C. Concibido
et al., 2004 A new integrated genetic linkage map of the soybean. Theor. Appl. Genet.109:122–128.
Stacey, G., L. Vodkin, W. A. Parrott and R. C. Shoemaker,
2004 National Science Foundation-sponsored workshop re-port. Draft plan for soybean genomics. Plant Physiol.135:59–70. Stapleton, M., J. Carlson, P. Brokstein, C. Yu, M. Champeet al.,
2002 A Drosophila full-length cDNA resource. Genome Biol.
3:RESEARCH0080.
Syva¨ nen, A. C., 2001 Accessing genetic variation: genotyping single
nucleotide polymorphisms. Nat. Rev. Genet.2:930–942. Syva¨ nen, A. C., 2005 Toward genome-wide SNP genotyping. Nat.
Genet.37(Suppl.): S5–S10.
Tenaillon, M. I., M. C. Sawkins, A. D. Long, R. L. Gaut, J. F. Doebley
et al., 2001 Patterns of DNA sequence polymorphism along chro-mosome 1 of maize (Zea mays ssp. mays L.). Proc. Natl. Acad. Sci. USA98:9161–9166.
Tuskan, G. A., S. Difazio, S. Jansson, J. Bohlmann, I. Grigoriev
et al., 2006 The genome of black cottonwood, Populus tricho-carpa (Torr. & Gray). Science313:1596–1604.
VanOoijen, J. W., and R. E. Voorrips, 2001 JoinMap 3.0 Software for
the Calculation of Genetic Linkage Maps. Plant Research Interna-tional, Wageningen, The Netherlands.
Vodkin, L. O., A. Khanna, R. Shealy, S. J. Clough, D. O. Gonzalez
et al., 2004 Microarrays for global expression constructed with a low redundancy set of 27,500 sequenced cDNAs representing an array of developmental stages and physiological conditions of the soybean plant. BMC Genomics5:73.
Wang, D., J. Shi, S. R. Carlson, P. B. Cregan, R. W. Wardet al.,
2003 A low-cost, high-throughput polyacrylamide gel electro-phoresis system for genotyping with microsatellite DNA markers. Crop Sci.43:1828–1832.
Weir, B. S., 1996 Genetic Data Analysis II: Methods for Discrete
Popula-tion Genetic Data. Sinauer Associates, Sunderland, MA.
Wright, S. I., I. V. Bi, S. G. Schroeder, M. Yamasaki, J. F. Doebley
et al., 2005 The effects of artificial selection on the maize ge-nome. Science308:1310–1314.
Zhu, Y. L., Q. J. Song, D. L. Hyten, C. P. VanTassell, L. K. Matukumalli
et al., 2003 Single-nucleotide polymorphisms in soybean. Genetics
163:1123–1134.