CopyrightÓ2010 by the Genetics Society of America DOI: 10.1534/genetics.110.122150
The Effects of Demography and Linkage on the Estimation of Selection
and Mutation Parameters
Kai Zeng
1and Brian Charlesworth
Institute of Evolutionary Biology, School of Biological Sciences, University of Edinburgh, Edinburgh EH9 3JT, United Kingdom Manuscript received August 13, 2010
Accepted for publication September 27, 2010
ABSTRACT
We explore the effects of demography and linkage on a maximum-likelihood (ML) method for estimating selection and mutation parameters in a reversible mutation model. This method assumes free recombination between sites and a randomly mating population of constant size and uses information from both polymorphic and monomorphic sites in the sample. Two likelihood-ratio test statistics were constructed under this ML framework: LRTgfor detecting selection and LRTkfor detecting mutational bias. By carrying out extensive simulations, we obtain the following results. When mutations are neutral and population size is constant, LRTgand LRTkfollow a chi-square distribution with 1 d.f. regardless of the level of linkage, as long as the mutation rate is not very high. In addition, LRTgand LRTkare relatively insensitive to demographic effects and selection at linked sites. We find that the ML estimators of the selection and mutation parameters are usually approximately unbiased and that LRTkusually has good power to detect mutational bias. Finally, with a recombination rate that is typical for Drosophila, LRTghas good power to detect weak selection acting on synonymous sites. These results suggest that the method should be useful under many different circumstances.
T
HE strength of natural selection, the rate of mu-tation, and the intensity of genetic drift are key players in evolution, determining patterns of diversity within species and patterns of divergence between species (Kimura 1983; Gillespie 1991). Quantifying the relative contributions of these forces to DNA and protein sequences is a central topic in modern evolutionary research (Li 1997; Charlesworth and Charlesworth 2010). At the population genetics level, they are often studied using either the infinite sites model (Kimura1971) or the reversible mutation model (Wright1931, 1949). The standard version of both models allows only two variants at each nucleotide site in the genome. The infinite sites model assumes that mutation is unidirectional, from the ancestral state at a fixed site to the derived states, with no mutational events allowed at segregating sites; the reversible mu-tation model allows bidirectional mumu-tation between the two alleles, which can occur even at segregating sites. The latter model is arguably more realistic. Nonethe-less, these two models are intrinsically related to each other, with the infinite sites model approximating the reversible mutation model when the product of the effective population size and the mutation rate issuf-ficiently small (Kondrashov1995; Desaiand Plotkin 2008; see alsosupporting information,File S1).
The infinite sites assumption has formed the basis of many methods for estimating mutational and/or selec-tion parameters from polymorphism data collected within a species (Sawyer and Hartl 1992; Akashi and Schaeffer1997; Bustamanteet al.2002; Sawyer et al.2003, 2007; Eyre-Walkeret al.2006; Keightley and Eyre-Walker2007; Boykoet al.2008). We refer to this class of methods as Poisson random field (PRF) methods (Sawyerand Hartl1992). In most but not all applications, they require the polarization of ancestral and derived states at each polymorphic site using an outgroup species. Because modeling linkage between sites is theoretically and computationally extremely chal-lenging (Griffiths and Marjoram 1996; Neuhauser and Krone 1997; Stumpfand McVean 2003), linkage equilibrium between segregating sites is usually assumed. Simulations have shown that, when this assumption is violated, the PRF methods suffer from high false positive rates with respect to detecting selection (see Table 2 in Bustamanteet al.2001). To solve this problem, a method that requires estimation of recombination rates from the data and determination of significance using computer simulations has been developed (Zhuand Bustamante 2005).
The reversible mutation (RM) model has typically been used to study weak selection acting on synonymous codons (i.e., codon usage bias), usually assuming that the scaled mutation rate is so low that the infinite sites Supporting information is available online athttp://www.genetics.org/
cgi/content/full/genetics.110.122150/DC1.
1Corresponding author: Institute of Evolutionary Biology, School of Biological Sciences, University of Edinburgh, Ashworth Laboratories, King’s Bldgs., W. Mains Rd., Edinburgh EH9 3JT, United Kingdom. E-mail: [email protected]
assumption is approximately valid (Li 1987; Bulmer 1991; McVeanand Charlesworth1999). But this class of methods does not necessarily require polarization of mutations. Instead, it considers several predefined allelic classes (typically two; see Zeng2010 for a multi-allele version of the model), such as preferred and unpreferred codons at synonymous sites (Li 1987; Bulmer 1991; McVeanand Charlesworth 1999) or ATvs. GC base pairs in noncoding regions (Galtier et al.2006; Haddrilland Charlesworth2008; Zeng and Charlesworth 2010). Under this framework, several maximum-likelihood (ML) inference methods have recently been proposed (Maside et al. 2004; Cutter and Charlesworth 2006; Galtier et al. 2006; Zengand Charlesworth2009; Zeng2010); we refer to these methods as the RM methods. These methods also make the assumption of no linkage disequilibrium.
Given that the PRF methods are sensitive to the violation of the free-recombination assumption and that they are closely related to the RM methods, it is natural to ask whether the RM methods also tend to give false positive results in the presence of linkage. The answer to this question has important implications for the validity of the inferences that selection is acting on synonymous sites, as found in studies of Caenorhabditis (Cutterand Charlesworth 2006; Cutter 2008) and Drosophila (Masideet al. 2004; Bartolome´ et al. 2005; Comeron and Guthrie 2005; Zeng and Charlesworth 2009, 2010), and that GC base pairs are favored over AT base pairs by selection or biased gene conversion in non-coding sequences (Galtier et al.2006; Haddrilland Charlesworth2008; Zengand Charlesworth2010). In addition to linkage, another issue that needs consideration is demography. In their simplest form, both the PRF methods and the RM methods assume that the population is randomly mating and that its size is constant over time. These assumptions are often un-realistic. It is known that population structure or changes of population size can cause false inferences of selection from PRF methods, even if evolution is strictly neutral (Zhu and Bustamante 2005); new methods have been constructed to address this problem (Williamsonet al.2005; Keightleyand Eyre-Walker 2007; Boyko et al. 2008; Gutenkunst et al. 2009). However, it is unclear to what extent the RM methods produce false inferences of selection when the un-derlying demographic history of the species is ignored, especially as RM methods that incorporate population size changes have only recently been developed (Zeng and Charlesworth2009, 2010).
Finally, and more specifically relevant to the study of codon usage bias, it is important to know whether reliable inferences of selection can be obtained when applying the RM methods to synonymous sites that are embedded in a background of nonsynonymous sites that are potentially under stronger selection. It is known
that the interaction between linked selected sites, known as Hill–Robertson interference (HRI) (Hill and Robertson1966; Felsenstein1974; McVeanand Charlesworth2000; Comeronand Kreitman2002; Comeron et al. 2008; Kaiser and Charlesworth 2009; Segeret al.2010), can reduce the effectiveness of selection and distort allele frequency spectra at linked sites. We thus need to know whether HRI among sites subject to reversible mutation and selec-tion can cause the RM methods to produce false positive results.
In this study, we focus on the method of Zeng and Charlesworth (2009), a version of the RM method that is flexible enough to include the effects of de-mographic changes. To address the questions raised above, we generated random samples from simulated populations under various models and analyzed these samples using this method. When specific underlying assumptions are violated, we ask (1) whether selection and mutation parameters can be accurately estimated and (2) whether the tests for detecting selection and mutational bias tend to be conservative or give false positive results.
METHODS
The method of Zengeng and Charlesworthharlesworth (2009): This method is based on the RM model (Wright1949; Li 1987; Bulmer 1991; McVean and Charlesworth 1999). In its simplest version, it assumes a randomly mating Wright–Fisher population ofNdiploid individ-uals (see Table 1 for notation). Two alleles,A0andA1, are possible at an autosomal nucleotide site. The mutation rate from A0 to A1 is ku, and that in the reverse direction isu; mutation is said to be biased when k6¼1. The fitnesses of the three genotypes,A0A0,A0A1, andA1A1, are 1, 1 –s, and 1 – 2s(genic selection). Zeng and Charlesworth (2009) showed that the equilib-rium distribution of the frequency of A1 in the pop-ulation can be obtained by numerically solving a linear system jointly determined byN,u,k, ands.
For a sample ofnchromosomes, each composed ofL unlinked sites and taken randomly from the population, we can count the number of sites where A1 is repre-senteditimes, denoted asdi(0#i#n). We often call
D ¼ (d0, d1,. . ., dn) the (sample) allele frequency spectrum (L ¼ Pn
To detect selection, Zengand Charlesworth(2009) proposed the use of the following likelihood-ratio test statistic:
LRTg¼ 2 log
Lðu;k;g¼0jDÞ
Lðu;k;gjDÞ : ð1aÞ
For detecting mutational bias, the following statistic was proposed:
LRTk¼ 2 log
Lðu;k¼1;gjDÞ
Lðu;k;gjDÞ : ð1bÞ
Under the free recombination assumption, the distri-butions of these two statistics should converge to a chi-square distribution with 1 d.f., denoted asx2
1.
Proper statistical tests:A statistical test is referred to as a proper test if the observed rejection rate is close to the nominal significance level, which is 5% throughout this study. Statistically, we can use the Kolmogorov– Smirnov (KS) test (as implemented in the R software package) to determine whether the distribution of the P-values obtained by applying a test of interest to the simulated data (see below) is uniform on [0, 1], which should be the case if the test is proper.
Tajima’s D: The skewness of an observed frequency spectrum was measured by Tajima’sD(Tajima1989b). To see whether the observed Tajima’sDvalues are close to the theoretical minimum, we obtained values of the relative Tajima’sD(Schaeffer2002) whose minimum value is1.
To determine the level of significance for theDvalue calculated from a sample withS segregating sites, we first used the coalescent process to generate 15,000 random samples, each with S segregating sites, assuming
con-stant population size and complete linkage (Hudson 1990); a D value was obtained for each of these sam-ples. The observed D value was regarded as signifi-cant if it was smaller (or larger) than the 5th (or 95th) percentile of the simulated distribution (Wall and Hudson2001).
Forward simulation algorithms: We used a forward simulation algorithm to generate random samples. We modeled a haploid Wright–Fisher population (Ewens 2004, p. 20),e.g., with 1000 chromosomes, correspond-ing to a diploid population size of N ¼ 500. A small population size was used due to computational con-straints. Nonetheless, the fact that sample properties are determined by the compound parameters such as u and g under weak evolutionary forces (Ewens 2004, Chap. 5) provides the theoretical justification for ‘‘scaling down’’ the population size, provided that the u- and g-values for the true population size are pre-served. This rescaling method has been widely used in population genetics and has been shown to be highly effective (McVean and Charlesworth 2000; Tachida2000; Comeronand Kreitman2002; Kaiser and Charlesworth 2009). Haploids were used to avoid the complications of extreme associative over-dominance that can arise with strong selection in a small population (Charlesworthand Charlesworth1997; Palsson2002).
Each chromosome hadLsites, each with two possible variants,A0andA1. LetL0andL1be the numbers ofA0 andA1sites in a given chromosome (L01L1¼L). It was assumed that in this chromosome, in a given genera-tion, a Poisson number of A0 sites with mean kuL0 mutated to A1 and a Poisson number ofA1sites with mean uL1mutated to A0. In models with nonneutral evolution, fitnesses were recalculated after adding new mutations to all the chromosomes, assuming multipli-cative fitness over selected sites,
w¼ Y
fall selected sitesg
wi; ð2Þ
wherewi¼1siifA1is present at theith selected site andwi¼1 ifA0is present at this site.
In the absence of recombination, the next generation was formed by sampling with replacement from the current generation, with the chance of sampling a particular individual being proportional to its fitness. When recombination was present, to generate a new individual, two parental chromosomes were first cho-sen, then recombinants were constructed, and finally one of the two recombinants was randomly chosen to be retained in the new generation.
Recombination was assumed to be caused by either crossing over or gene conversion, or both. For each pair of parental chromosomes, the numbers of crossing over and gene conversion events were drawn from Poisson distributions with mean values ofcLandgL, respectively.
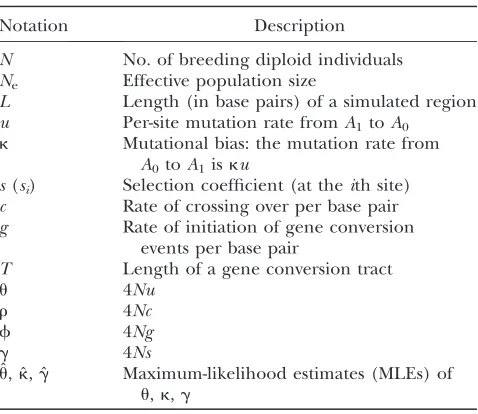
TABLE 1 Summary of notation
Notation Description
N No. of breeding diploid individuals Ne Effective population size
L Length (in base pairs) of a simulated region u Per-site mutation rate fromA1toA0
k Mutational bias: the mutation rate from A0toA1isku
s(si) Selection coefficient (at theith site) c Rate of crossing over per base pair g Rate of initiation of gene conversion
events per base pair
T Length of a gene conversion tract
u 4Nu
r 4Nc
f 4Ng
g 4Ns
ˆ
u, ˆk, ˆg Maximum-likelihood estimates (MLEs) of u,k,g
These events were randomly placed onto the chromo-some. For a gene conversion event,Tsites downstream of the initiation point were converted, where Twas a geometric random variable with meanE(T). For pur-poses of comparison with real populations, we used values ofcLandgLsuch that their products withNare comparable with the corresponding products with esti-mates of effective population size Ne for Drosophila populations, as described by Kaiserand Charlesworth (2009).
Neutral demographic models: Complete linkage between sites was assumed in all neutral demographic models. To examine the effects of changes of popula-tion size, we assumed that a populapopula-tion ofN1diploids was initially at statistical equilibrium. At time zero, the population size changed instantly to N2 and stayed constant afterward. The time since the change in population size is measured byt¼t/(2N2), wheret is the number of generations since the change. Similarly, a bottleneck model (Thorntonand Andolfatto2006) was also examined.
To model population structure, we used Wright’s symmetric island model with d demes (reviewed in Charlesworth and Charlesworth 2010, pp. 317– 320). Each deme had 2N¼500 chromosomes. Letmbe the probability that an individual is a migrant. Then the equilibrium value of the widely used measure of genetic isolation between demes,FST, is given by
FST ¼
1
114Nmðd=ðd1ÞÞ2: ð3Þ
Different values ofm and d were used; all haplotypes were sampled from one deme (Table 5), which is likely to maximize the distortion of variant frequency spectra caused by population structure (De and Durrett 2007). The effects of other sampling schemes were examined inTable S3.
Models of codon structure and selection at non-synonymous sites:To model codon structure, we assumed that, along the whole length of each chromosome, a pair of selected nonsynonymous sites was followed by a synonymous site (Kaiserand Charlesworth2009). At the beginning of each replicate simulation, the selection intensity for each nonsynonymous site (i.e., gi) was sampled from a log-normal distribution with shape and location parameters of 3.022 and 0.0368, respectively, and was assumed to be constant throughout this replicate. The shape and location parameters correspond to the expo-nentials of the standard deviation and mean of ln(s) (Loeweand Charlesworth2006). WithN¼500, this distribution gives a harmonic mean selection coefficient, sh, such thatNsh¼10. This corresponds approximately to the mean selection coefficient for nonsynonymous muta-tions that are segregating in a typical Drosophila popula-tion (Loewe and Charlesworth 2006; Loewe et al. 2006). The log-normal distribution was used because it has
been shown to provide good fit to the data obtained in population genetic surveys (Loeweand Charlesworth 2006; Loeweet al.2006; Boykoet al.2008). Furthermore, a recent simulation study showed that the above model can accurately predict the level of synonymous diversi-ties observed for Drosophila dot and neo-Y chromo-somes (Kaiserand Charlesworth2009). Synonymous sites may be either neutrally evolving or subject to weak selection. In the latter case, it was assumed that all synonymous sites were subject to the same selection intensity.
Burn-in time: Previous simulation studies showed that the time required to reach statistical equilibrium is of the order of 1/ugenerations under the reversible mutation model (McVeanand Charlesworth 2000; Tachida2000; Comeronand Kreitman2002). In this study, for each parameter combination, we inspected the amount of time needed to reach equilibrium. A burn-in period of at least 5/u generations was imple-mented before samples were taken.
Some implementation details: The simulation algo-rithms were written in the Java programming language. A chromosome was represented by an array of 64-bit-long integers (computer words), with the state of a given bit representing the state of a nucleotide site. To improve efficiency, the object-oriented features of the Java language were exploited to reuse the integer arrays as much as possible to avoid copying.
Predicting the effects of background selection: In the model with codon structure and selection on nonsynonymous sites, the effective population size, Ne, as estimated from the equilibrium diversity at linked, neutrally evolving sites, is reduced by selection at linked sites (Kaiser and Charlesworth 2009). Under the assumption that selected sites are close to deterministic mutation–selection balance (back-ground selection; Charlesworth et al. 1993), the expected reduction in neutral diversity can be calcu-lated as follows. We defineBasNe/N, whereN is the effective population size in the absence of selection at linked sites. According to Nordborg et al.(1996), we have
Bexp
X
i
u
si½11ð1siÞri=si2
; ð4Þ
repeated the sampling and calculation 1000 times and used the mean value ofBas the predicted reduction inNe.
RESULTS
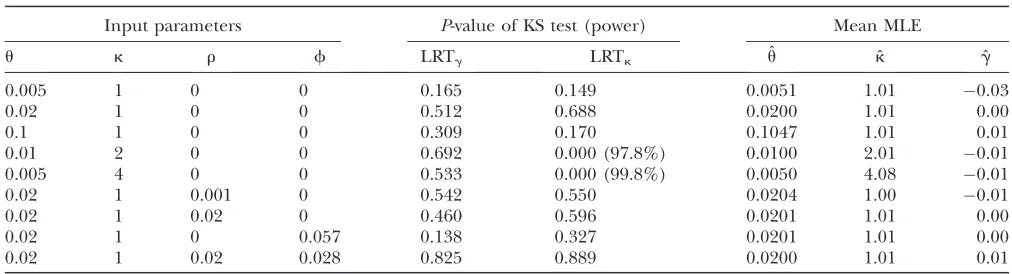
The effects of linkage on the method of Zeng and Charlesworth under neutrality in a constant-size pop-ulation:It is known that, under the infinite sites model, linkage between sites does not change the shape of the site frequency spectrum, but merely increases the variance (Hudson 1983; Bustamante et al. 2001). In Figure S1, we show that the same conclusion holds under the reversible mutation model considered here. The maximum-likelihood inference method of Zeng and Charlesworth (2009) assumes free recombina-tion between sites and uses both polymorphic and mono-morphic sites to infer the parameters of the model:u,k, and g. The extra variance induced by linkage raises concerns about the reliability of this method. To address this issue, we used our inference method to analyze random samples generated by the forward simulation algorithm (see methods), assuming neutrality and a constant population size, but with various levels of linkage between sites. Reassuringly, the results in Table 2 (see alsoTable S1) suggest that the inference method is approximately unbiased, regardless of the level of linkage. This is consistent with a previous theoretical study (Wiuf 2006), which showed that likelihood methods neglecting linkage provide consistent estima-tors under a wide range of neutral population genetic scenarios.
Zeng and Charlesworth (2009) constructed two likelihood-ratio tests, one to detect the signal of selec-tion (g¼0vs.g6¼0), denoted by LRTg, and the other to detect the presence of mutational bias (k¼1vs.k6¼1),
denoted by LRTk. Standard statistical theory suggests that, if data are generated under their respective null models, the P-values of these two tests should follow a uniform distribution on the interval [0, 1]; they are then regarded as proper tests. We used the KS test to deter-mine whether LRTgand LRTkare proper tests in the presence of linkage between sites (see methods). Intriguingly, both LRTgand LRTkare proper tests over a wide range of parameter combinations (Table 2; see also Table S1). In fact, an analysis using the quantile– quantile plot (Figure S2) suggests that, even with com-plete linkage, the distribution of these two test statistics conforms to a chi-square distribution with 1 d.f. (x2
1). These results suggest that LRTgand LRTkare likely to be proper statistical tests even when the data do not conform to the assumption of free recombination. Fur-thermore, LRTkseems to have good power to detect the presence of mutational biases (.97% in Table 2; see alsoTable S1).
The observation that linkage has only a limited influence on LRTgand LRTkis counterintuitive, espe-cially when considering the dramatic increase in vari-ance due to tight linkage (Figure S1). In Figure 1A, we plot summary statistics for the distributions of ˆu, ˆk, and ˆg as functions of the rate of crossing over, for the case whereu¼0.02,k¼1, andL¼10 kb (seeFigure S3for cases withL¼1 or 100 kb). Two features are of note. First, as the above results imply, all observed distribu-tions of ˆkand ˆg, regardless of the level of linkage, are indistinguishable from those obtained under the free recombination assumption. On the other hand, the distribution of ˆubecomes more variable as the level of linkage between sites increases (i.e., as r ¼ 4Nr de-creases). Thus, the results in Figure 1A suggest that the extra variance in the frequency spectrum induced by linkage between sites manifests itself mainly in the
TABLE 2
The effects of linkage on the method of ZENGand CHARLESWORTH(2009) with neutrality at all sites
Input parameters P-value of KS test (power) Mean MLE
u k r f LRTg LRTk ˆu ˆk gˆ
0.005 1 0 0 0.165 0.149 0.0051 1.01 0.03
0.02 1 0 0 0.512 0.688 0.0200 1.01 0.00
0.1 1 0 0 0.309 0.170 0.1047 1.01 0.01
0.01 2 0 0 0.692 0.000 (97.8%) 0.0100 2.01 0.01
0.005 4 0 0 0.533 0.000 (99.8%) 0.0050 4.08 0.01
0.02 1 0.001 0 0.542 0.550 0.0204 1.00 0.01
0.02 1 0.02 0 0.460 0.596 0.0201 1.01 0.00
0.02 1 0 0.057 0.138 0.327 0.0201 1.01 0.00
0.02 1 0.02 0.028 0.825 0.889 0.0200 1.01 0.01
The data were generated using a neutral model with L¼10 kb and 2N¼1000. When gene conversion was included, we assumedE(T)¼352 bp. Five hundred random samples, each composed of 15 chromosomes, were generated for each param-eter combination. The samples were analyzed by the method of Zengand Charlesworth(2009). TheP-values of the two likelihood-ratio tests, LRTgand LRTk, were examined using the Kolmogorov–Smirnov (KS) test. When the KS test detected a significant deviation, the proportion of samples where the null hypothesis for the likelihood-ratio test was rejected (i.e., the power) is given in parentheses.
increased variability of the distribution of ˆu. Additional simulations also suggest that, for the parameter values we have considered, withr $0.05, the distribution of ˆu becomes indistinguishable from that observed under free recombination (results not shown).
For LRTg, some exceptions to the above conclusions have been found. For example, whenu¼0.05,k¼2, andL¼10 kb, the KS test suggests that the distribution of the P-values deviates from uniformity (P ¼2.58 3 1013), and, at a significance level of 5%, LRTgrejects
neutrality in 14.8% of the random samples. As above, we plot the distributions of ˆu, ˆk, and ˆgas functions of the rate of crossing over (Figure 1B withL¼10 kb; see also Figure S3). As in the case with a lower mutation rate in Figure 1A, the variance of ˆuincreases sharply as r ap-proaches zero. However, with a high mutation rate, the variances of ˆkand ˆgalso increase asrdecreases, but to a much lesser extent than that of ˆu. In fact, using a two-sample Kolmogorov–Smirnov test, the distributions of ˆk and ˆgunderr¼0 are significantly different from those observed underr¼‘(theP-values for the two tests are 1.8 3 106 and 7.2 3 106, respectively). When a
moderate level of crossing over is introduced, the effects of linkage on the distributions of ˆkand ˆgvanish. For example, withr¼0.001, the two-sample KS test suggests that the two distributions are indistinguishable from those observed underr¼‘, and LRTgrejects 5.8% of the random samples.
Additional simulations suggest that, with complete linkage, a high mutation rate, and k 6¼ 1, the false positive rate of LRTgseems to be positively correlated with L, but crossing over tends to be effective in re-ducing false rejections (Table S1andFigure S3). In gen-eral, we find that LRTgtends to be too liberal when these three conditions are met simultaneously: (1)ku.0.05, (2)k.1, and (3)r,0.001 (Table S1). However, this situation has limited relevance to most eukaryote species, whose scaled per-site mutation rate is usually of the order of a few percent (see Figure 1.10 of Charlesworthand Charlesworth2010).
Neutral models with population size changes or population structure: Many methods for detecting selection assume that population size is constant over time. It is well known that violations of this assumption can make methods that rely on the infinite sites model become counterconservative (Simonsen et al. 1995; Jensenet al.2005; Nielsen2005; Zhuand Bustamante 2005; Zenget al.2006). In this section, we investigate the joint influence of linkage and demography on LRTg and LRTk. In the simulations, we assumed neutral evo-lution and complete linkage between sites.
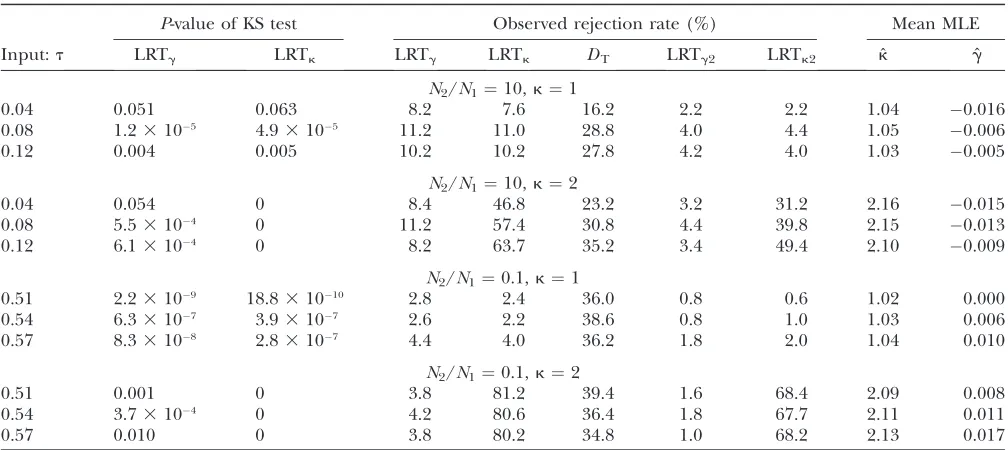
First, we modeled a 10-fold population expansion (i.e.,N2/N1¼10; seemethods). It is known theoreti-cally that an abrupt increase in population size causes an excess of rare mutations in the sample and, conse-quently, negative Tajima’s D values (Tajima 1989a; Slatkinand Hudson1991). This effect renders many
tests (e.g., Tajima’sD) counterconservative with respect to detecting purifying selection (e.g., Simonsen et al. 1995; Zenget al.2006). The results in Table 3 suggest that LRTg and LRTk tend to have slightly elevated rejection rates (up to 11%; see Table S2 for more Figure1.—The effects of linkage on the distributions of ˆu, ˆ
k, and ˆg. The data were generated under the assumptions of neutrality at all sites and a constant population size. The sim-ulated region was 10 kb in length, and the sample size was 15. The input parameters wereu¼0.02 andk¼1 (A) andu¼ 0.05 andk¼2 (B). The case ofr¼‘corresponds to the free recombination assumption. For the ease of presentation, the ˆ
u-values, for instance, were transformed using the formula ˆ
data) under this demographic model, although these two tests seem to be more conservative than Tajima’sD. In most cases, the KS test reveals that the distribution of P-values deviates significantly from the uniform dis-tribution. Interestingly, the method seems to produce roughly unbiased estimates of g and k, with the g-estimator behaving better than thek-estimator.
Extensive empirical investigations suggest that the following statistically ad hoc approach is effective in solving the problem of counterconservativeness: instead of usingx2
1, we can perform LRTgand LRTkassuming that they follow a chi-square distribution with 2 d.f. (x2
2); we refer to these twoad hoctests as LRTg2and LRTk2, respectively. Using data simulated under various mod-els, we find that LRTg2and LRTk2are more conservative than LRTgand LRTk(seeFigure S4for more details). For example, when the data were generated under the expansion model with t¼0.04 and k ¼1, LRTg2 re-jects 0.6, 2.2, and 5.4% of the samples at significance levels of 1, 5, and 10%, respectively; LRTk2has similar properties (Table 3). When generating data using the same expansion model but withk¼2, at a significance level of 5% the original LRTk rejects 46.8% of the samples, whereas thead hocLRTk2rejects 31.2% (Table 3). Note that, because type I error is uncontrolled for LRTk, we cannot equate the 46.8% rejection frequency to power. On the contrary, LRTk2, although conservative, has reasonable power to detect mutational bias in the
presence of recent population expansion (seeTable S2 for more data).
Next, we simulated a 10-fold population size reduc-tion (i.e., N2/N1 ¼ 0.1). In contrast to the case of population expansion, a reduction in population size usually generates an excess of variants with intermediate frequencies and, consequently, positive Tajima’s D val-ues (Fu1996). Under the assumed model, the rejection rates using Tajima’sDcan be as high as 40% (Table 3). For LRTg and LRTk, the KS test indicates that the distributions of these two test statistics usually do not follow a x2
1-distribution. Nonetheless, all the observed rejection rates are below the 5% nominal significance level. Hence, LRTgand LRTk tend to be conservative tests following a reduction in population size, so it is unnecessary to perform the even more conserva-tive LRTg2 and LRTk2. When mutational bias was in-cluded, LRTkhas80% power to detect its presence, whereas LRTk2 has 68% power. Again, we obtain approximately unbiased estimates ofgandk.
The third case we consider is a bottleneck model, which has been used to describe the evolution of non-African Drosophila melanogasterpopulations (Thornton and Andolfatto 2006). This model contains a brief bottleneck period, when the population size is reduced to 2.9% of the prebottleneck value, and is likely to induce false positive results with respect to detecting selection (e.g., Barton1998). In fact, Tajima’sDbecomes liberal,
TABLE 3
The effects of changes of population size on LRTgand LRTk
P-value of KS test Observed rejection rate (%) Mean MLE
Input:t LRTg LRTk LRTg LRTk DT LRTg2 LRTk2 kˆ gˆ
N2/N1¼10,k¼1
0.04 0.051 0.063 8.2 7.6 16.2 2.2 2.2 1.04 0.016
0.08 1.23105 4.93105 11.2 11.0 28.8 4.0 4.4 1.05 0.006
0.12 0.004 0.005 10.2 10.2 27.8 4.2 4.0 1.03 0.005
N2/N1¼10,k¼2
0.04 0.054 0 8.4 46.8 23.2 3.2 31.2 2.16 0.015
0.08 5.53104 0 11.2 57.4 30.8 4.4 39.8 2.15 0.013
0.12 6.13104 0 8.2 63.7 35.2 3.4 49.4 2.10 0.009
N2/N1¼0.1,k¼1
0.51 2.23109 18.831010 2.8 2.4 36.0 0.8 0.6 1.02 0.000
0.54 6.33107 3.93107 2.6 2.2 38.6 0.8 1.0 1.03 0.006
0.57 8.33108 2.83107 4.4 4.0 36.2 1.8 2.0 1.04 0.010
N2/N1¼0.1,k¼2
0.51 0.001 0 3.8 81.2 39.4 1.6 68.4 2.09 0.008
0.54 3.73104 0 4.2 80.6 36.4 1.8 67.7 2.11 0.011
0.57 0.010 0 3.8 80.2 34.8 1.0 68.2 2.13 0.017
Neutrality at all sites and complete linkage between sites were assumed. The time, t, since the change of population size is measured in units of 2N2generations; the values oftat which Tajima’sDshows high rejection rates are shown. For each parameter combination, we analyzed 500 random samples of 15 chromosomes each (L¼10 kb). For the expansion case (ku1¼4N1ku¼ 0.002), an observed value of Tajima’sD(DT) is significant if it is smaller than the 5th percentile value generated under neutrality, using the observed number of segregating sites; for the reduction case (ku1¼0.02), aDTis significant if it is larger than the 95th percentile.
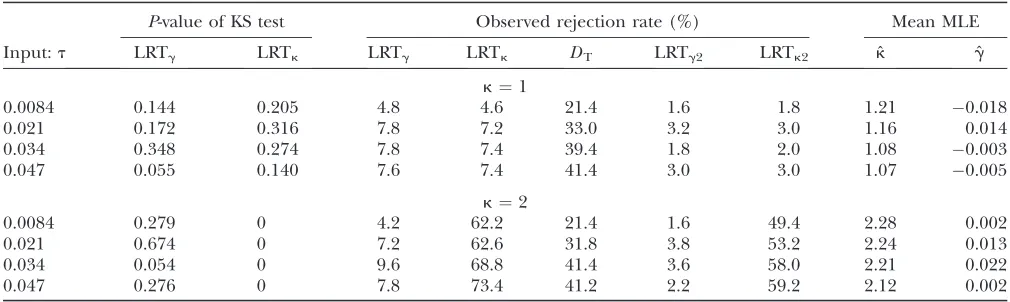
with up to 41.4% of the samples being rejected (Table 4). Nonetheless, the bottleneck event has only mild effects on LRTgand LRTk, and the KS test usually does not detect significant deviation from uniformity (Table 4). As under the expansion model, LRTg2and LRTk2tend to be very conservative. The mean value of ˆg is close to zero, but estimates ofktend to be upwardly biased, especially when the samples were taken shortly after the recovery of population size.
Finally, we consider the effects of population struc-ture. For simplicity, we adopted a finite island model in
the simulations (seemethods). The results are given in Table 5. First, data were generated under a two-deme model. Here, relatively low levels of geographic isolation (as measured byFST) were assumed. None of the three tests, Tajima’s D, LRTg, and LRTk, is significantly af-fected. LRTkhas only moderate power (50%) to de-tect mutational bias. Next, we modeled a case with a higher level of isolation and a larger number of demes (five demes in Table 5). Under this model, Tajima’sD becomes counterconservative, rejecting up to 22% of the samples. Encouragingly, LRTgand LRTkseem to be
TABLE 4
The effects of population bottlenecks on LRTgand LRTk
P-value of KS test Observed rejection rate (%) Mean MLE
Input:t LRTg LRTk LRTg LRTk DT LRTg2 LRTk2 kˆ gˆ
k¼1
0.0084 0.144 0.205 4.8 4.6 21.4 1.6 1.8 1.21 0.018
0.021 0.172 0.316 7.8 7.2 33.0 3.2 3.0 1.16 0.014
0.034 0.348 0.274 7.8 7.4 39.4 1.8 2.0 1.08 0.003
0.047 0.055 0.140 7.6 7.4 41.4 3.0 3.0 1.07 0.005
k¼2
0.0084 0.279 0 4.2 62.2 21.4 1.6 49.4 2.28 0.002
0.021 0.674 0 7.2 62.6 31.8 3.8 53.2 2.24 0.013
0.034 0.054 0 9.6 68.8 41.4 3.6 58.0 2.21 0.022
0.047 0.276 0 7.8 73.4 41.2 2.2 59.2 2.12 0.002
The bottleneck model of Thorntonand Andolfatto(2006) for describing the evolutionary history of non-AfricanD. mela-nogasterpopulations was simulated. This model assumes that the population with sizeNwas at equilibrium untiltb¼0.044 before the present, where time is measured in units of 2Ngenerations. Attb, the population size changed instantly to 0.029Nand stayed constant untiltr¼0.0084 before the present, when the population size recovered instantly toN, and stayed constant afterward.tis the time after the recovery of population size. The simulation assumed neutrality at all sites and complete linkage between sites. For each parameter combination, we analyzed 500 random samples of 15 chromosomes each, generated with 4Nu¼0.015 andL¼ 10 kb. An observed value of Tajima’sD(DT) is significant if it is smaller than the 5th percentile value generated under neutrality, using the observed number of segregating sites.
TABLE 5
The effects of population structure on LRTgand LRTk
Input P-value of KS test (power) Mean MLE
DT(%)
4Nm FST k LRTg LRTk kˆ ˆg
Two-deme model
1 0.2 1 0.792 0.733 1.03 0.018 7.6
1 0.2 2 0.275 0.000 (54.0%) 2.22 0.033 6.2
0.5 0.33 1 0.067 0.007 (5.2%) 1.04 0.009 9.6
0.5 0.33 2 0.690 0.000 (47.0%) 2.15 0.018 9.8
Five-deme model
1 0.39 1 0.322 0.258 1.01 0.016 13.8
1 0.39 2 0.787 0.000 (79.8%) 2.13 0.007 14.8
0.5 0.56 1 0.342 0.296 1.03 0.010 22.4
0.5 0.56 2 0.333 0.000 (72.6%) 2.18 0.028 18.6
proper tests, and LRTkseems have reasonable power to detect mutational bias. Note that these results are based on a sampling scheme where all chromosomes are taken from one deme. Nonetheless we have obtained similar conclusions using other sampling schemes (e.g., with one chromosome taken from one deme and all the rest from another deme;Table S3).
In summary, we suggest (i) that LRTgand LRTkare relatively insensitive to the neutral demographic models we have examined, (ii) that they tend to produce ap-proximately unbiased estimates of g and k, (iii) that LRTkseems to have reasonable power to detect muta-tional bias, and (iv) that the twoad hoctests, LRTg2and LRTk2, tend to be conservative and rarely produce false positive results even when LRTgand LRTkbecome too liberal. The observation that the mean of ˆg is usually close to zero, even though the frequency spectrum is distorted, is counterintuitive. In File S1, we present a numerical example based on the population expansion model, which may shed light on these seemingly paradoxical observations.
The effects of selection at nonsynonymous sites on linked, neutrally evolving synonymous sites:The original purpose of the method of Zeng and Charlesworth (2009) was to estimate the parameters governing the evolution of synonymous sites. In this regard, the models considered in the previous sections are unrealistic, since they assume neutrality and neglect the fact that synony-mous sites are linked to nonsynonysynony-mous sites in the same gene, which are under natural selection (Loewe and Charlesworth 2007). To address this issue, we con-ducted simulations taking into account codon structure and selection at nonsynonymous sites, but retaining the assumption of neutrality at synonymous sites (see methods). In particular, we assume that mutation is reversible at all sites and ku ¼ 0.02, which should be realistic for D. melanogaster (assuming Ne 106 and a
mean per site mutation rate of 5 3 109) (Kreitman
1983; Keightley et al. 2009). We sampled the fitness effects of the selected sites from a log-normal distribu-tion, which has been shown to provide a good fit to the data obtained from population genetic surveys (Loewe and Charlesworth 2006; Boyko et al. 2008; Kaiser and Charlesworth 2009). The statistics ob-tained on synonymous sites were then analyzed to ex-amine the performance of the method of Zeng and Charlesworth(2009).
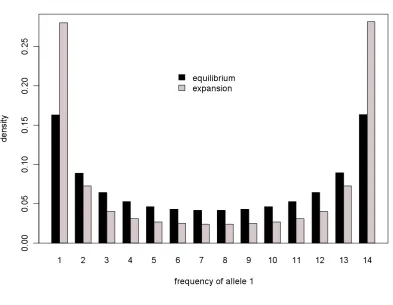
In a previous simulation study, Kaiser and Charlesworth(2009) concluded (i) that, with a large number of tightly linked nonsynonymous sites, the frequency spectrum at linked, neutrally evolving synon-ymous sites can be seriously distorted, showing extreme negative Tajima’sDvalues (see also Segeret al.2010), and (ii) that gene conversion alone is ineffective in removing HRI. Here, we substantiate these conclusions by includ-ing mutational bias in the simulation and by providinclud-ing distributions for the quantities of interest (Figure 2).
We highlight several observations. First, incorporat-ing mutational bias into the simulation has little impact on the frequency spectrum at synonymous sites (Figure S5). Second, the ineffectiveness of gene conversion in removing HRI is clearly demonstrated by the fact that the observed distribution of Tajima’s D under gene conversion overlaps substantially with that observed under complete linkage (Figure 2), although gene conversion was assumed to have occurred at a rate that is realistic for D. melanogaster (Hilliker et al. 1994; Loeweand Charlesworth2007). In contrast, with a rate of crossing over ofr¼0.04/bp, which should also be realistic forD. melanogaster[assumingNe106and a
mean per-site rate of crossing over of 108(Hey and
Kliman2002)], the distribution of Tajima’sDis much closer to the neutral expectation of zero. As noted previously, the effects of selection at linked sites on the frequency spectrum at synonymous sites become im-portant when there are a large number of linked selected sites. In fact, with.20 kb of tightly linked sites, the 97.5th percentile of the distribution of Tajima’sD barely overlaps with the neutral expectation of zero (Figure 2).
Figure 2.—The effects of selection at linked nonsynony-mous sites on the frequency spectrum at neutral synonynonsynony-mous sites. Along the whole length of a chromosome, a pair of se-lected nonsynonymous sites is followed by a neutral synony-mous site (seemethods). We setu¼0.02 andk¼1. To see whether the observed Tajima’sDvalues are close to the theo-retical minimum, we present values of the relative Tajima’sD statistic (Schaeffer2002). The mean values are indicated by :, and the intervals between the 2.5th and 97.5th percentiles are indicated by the thin (or dashed) lines. The parameter val-ues used in the case with gene conversion as the sole recombi-nation mechanism weref¼0.028 andE(T)¼352 bp. For the case with crossing over alone,r¼0.04. ForL,500 kb, the results are based on 250 random replicates; due to computa-tional constraints, 100 and 50 replicates were performed for L¼500 kb and 1 Mb, respectively.
To examine the details of the frequency spectra for derived alleles, we used the forward simulation algo-rithm to obtain the unique genealogy that relates all extant haplotypes in the absence of recombination. For each segregating site in the sample, we determined ancestral and derived alleles by comparing the extant sequences with the ancestral sequence at the most recent common ancestor for this sample. InFigure S6, the spectrum observed at synonymous sites is shown and compared to the neutral expectation. We observe an excess of low-frequency variants and a deficit of intermediate- and high-frequency ones. This is in line with the prediction under the standard background selection theory with weak selection (Charlesworth et al.1995; Fu1997; Gordoet al.2002).
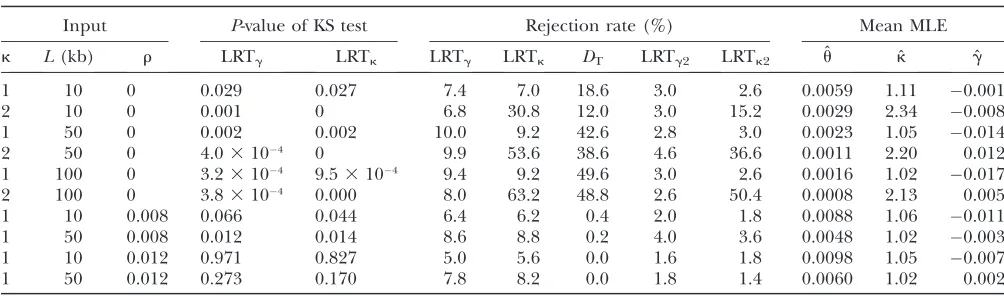
In the absence of recombination, Tajima’s D is counterconservative when applied to synonymous sites, with observed rejection rates up to 74% (Table 6 and Table S4). For LRTgand LRTk, their P-values are no longer uniformly distributed (Table 6), and the ob-served rejection rates are slightly elevated (,14%;Table S4). As in the case of population expansion, LRTg2and LRTk2 tend to be conservative, with all observed re-jection rates,5% (Table 6,Table S4, and Figure S7). Note that, because type I error is uncontrolled, power is undefined for LRTk in the case of no recombination. On the other hand, using LRTk2, we still have some power to detect mutational bias: 15.2% forL¼10 kb, 36.6% forL¼50 kb, and 50.4% forL¼100 kb (Table 6). Additional simulations suggest that a relatively high level of crossing over is necessary to reduce the effects of selection at linked sites on LRTg and LRTk. For example, withL¼10 kb,r.0.01 is necessary (Table 6). Note that, since the simulation model does not in-clude any noncoding regions, the rate of crossing over needed to alleviate the effects of selection at linked sites is likely to be overestimated. Nonetheless caution should be exercised when applying LRTg and LRTk
to genomic regions where crossing over is relatively infrequent; for these regions, LRTg2 and LRTk2 are probably more reliable.
The mean ML estimates forg tend to be unbiased, whereas those forkseem slightly upwardly biased when recombination is infrequent (Table 6). In all parameter combinations, the mean ˆu-values are severalfold lower than the input values (Table 6), and cases with largerL values tend to have smaller ˆu-values. This reflects the well-known fact that selection at linked sites reduces the level of neutral diversity, reflecting a reduction in Ne (McVean and Charlesworth 2000; Comeron et al. 2008; Kaiserand Charlesworth2009).
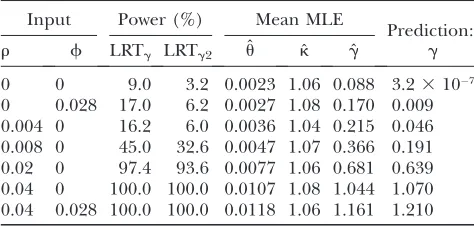
The power to detect selection at synonymous sites in the presence of linked nonsynonymous sites: In this section, we investigate whether LRTghas any power to detect natural selection at synonymous sites when there is strong HRI caused by linked nonsynonymous sites. To this end, we introduced weak selection on synonymous sites into the simulation model described in the pre-vious section. Here, the selection coefficient,s, against a deleterious mutation at a synonymous site was assumed to be constant across the entire simulated region. The region size was set to 50 kb and the input scaled intensity of selection at synonymous sites wasg¼2 (Table 7); very similar results were obtained when the size was 100 kb (results not shown). HRI tends to reduce Ne as mea-sured by equilibrium diversity at neutral sites, especially when there are a large number of linked selected sites (McVean and Charlesworth 2000; Comeron et al. 2008; Kaiser and Charlesworth 2009). As a conse-quence, the weak selective differences between the two variants at synonymous sites may be invisible to natural selection, due to their very small Nes (Stephan et al. 1999).
In the case of complete linkage, with the selection and mutation parameters for nonsynonymous sites used here, the observed diversity at neutral synonymous sites is
TABLE 6
The effects of selection at linked nonsynonymous sites on LRTgand LRTkfor neutral sites
Input P-value of KS test Rejection rate (%) Mean MLE
k L(kb) r LRTg LRTk LRTg LRTk DT LRTg2 LRTk2 ˆu kˆ gˆ
1 10 0 0.029 0.027 7.4 7.0 18.6 3.0 2.6 0.0059 1.11 0.001
2 10 0 0.001 0 6.8 30.8 12.0 3.0 15.2 0.0029 2.34 0.008
1 50 0 0.002 0.002 10.0 9.2 42.6 2.8 3.0 0.0023 1.05 0.014
2 50 0 4.03104 0 9.9 53.6 38.6 4.6 36.6 0.0011 2.20 0.012
1 100 0 3.23104 9.53104 9.4 9.2 49.6 3.0 2.6 0.0016 1.02 0.017
2 100 0 3.83104 0.000 8.0 63.2 48.8 2.6 50.4 0.0008 2.13 0.005
1 10 0.008 0.066 0.044 6.4 6.2 0.4 2.0 1.8 0.0088 1.06 0.011
1 50 0.008 0.012 0.014 8.6 8.8 0.2 4.0 3.6 0.0048 1.02 0.003
1 10 0.012 0.971 0.827 5.0 5.6 0.0 1.6 1.8 0.0098 1.05 0.007
1 50 0.012 0.273 0.170 7.8 8.2 0.0 1.8 1.4 0.0060 1.02 0.002
0.0015,13-fold lower than the input value of 0.02 (Table 6). This is consistent with observed levels of diversity on the Drosophila dot chromosome (Charlesworthet al. 2010). Hence, for synonymous sites under selection, 4Nes predicted from theNevalue corresponding to the neutral diversity level is equal to 2
130.15. The mean value of ˆgis 0.088 (Table 7), somewhat lower than this predicted value (seediscussion). Not surprisingly, with such a small 4Nes, neither LRTgnor LRTg2has any power to detect selection (Table 7). Introducing gene conversion does not signif-icantly increase the power of the two tests. These results imply that it will be hard to detect selection on synony-mous sites in parts of the genome with extremely reduced recombination (e.g., the dot chromosome in Drosophila), consistent with the evidence that selection on codon usage is greatly reduced in these regions (reviewed by Charlesworthet al.2010).
The power of LRTgstarts to increase as the rate of crossing over becomes higher (Table 7). Whenr¼0.02, about half of the typical value of 0.04 forD. melanogaster, LRTgachieves virtually 100% power in detecting selec-tion. Nonetheless, it should be noted that, for cases with r , 0.01, the power of LRTg should be interpreted with caution because of the problem of inflated type I error rates reported in the previous section. Encourag-ingly, the more conservative LRTg2 has only slightly reduced power compared to LRTg(e.g., 93.6%vs.97.4% forr¼0.02). Further, LRTg2can be applied to regions with reduced recombination, where LRTg is counter-conservative (e.g., whenr¼0.008).
In all cases, the estimates of k are approximately unbiased (Table 7). On the other hand, with higher levels of recombination the mean values of ˆu and ˆg
becomes closer to the input values of 0.02 and 2, although even under the highest level of recombina-tion (r ¼ 0.04 and f ¼ 0.028) the mean estimates of these two parameters are still lower than the input values, suggesting that the effects of selection at linked sites have not been completely removed. This reduction is due to the action of background selection (Charlesworth et al. 1993; Hudson and Kaplan 1994). In fact, using the theory developed by Nordborg et al.(1996) and Loeweand Charlesworth(2007), for r ¼ 0.02 and 0.04, the predicted effect on Ne at synonymous sites due to selection at linked nonsynon-ymous sites is Ne/N ¼0.32 and 0.54, respectively (see Equation 4); the expected 4Nes values for linked weakly selected sites are therefore 0.64 and 1.07, which are very close to the mean values of ˆggiven in Table 7, in agreement with the results of Stephanet al.(1999) for one strongly selected and one weakly selected site. However, when recombination rates are very low, the background selection formula tends to overestimate the reduction in Ne andg (Table 7) for reasons given in thediscussion.
If the above conclusions are correct, then the pre-vious estimate of g¼1.03 (Zengand Charlesworth 2009), obtained by analyzing twofold degenerate syn-onymous codons located in normally recombining re-gions in theD. melanogastergenome (c.1.15 cM/Mb;i.e., r .0.04), is likely to be close to the actual intensity of selection acting on these sites.
DISCUSSION
Properties of the methods based on the reversible mutation model: In a series of articles (Cutter and Charlesworth2006; Zengand Charlesworth2009, 2010; Zeng 2010), we proposed several methods for inferring the selection and mutation parameters using the reversible mutation model, which are especially suitable for detecting selection on synonymous muta-tions or on GCvs.AT variants in noncoding sequences. These methods have the following features: (1) They do not require the use of outgroup sequences to infer ancestral states and are thus free from the potential problem of false inference caused by misidentifica-tion of ancestral states (Baudry and Depaulis 2003; Hernandez et al. 2007); (2) they allow simultaneous estimation of selection and mutational bias parameters from population genetic data; and (3) they can be ex-tended to account for the effects of past changes of population size.
We have further shown here that the method of Zeng and Charlesworth (2009), a representative of the class of methods cited above, is fairly insensitive to the violation of the free recombination assumption. Addi-tionally, this method seems to be relatively insensitive to demographic changes, population structure, and selec-tion at linked sites, compared to the commonly used
TABLE 7
The power to detect selection at synonymous sites in the presence of linked selected nonsynonymous sites
Input Power (%) Mean MLE
Prediction:a
r f LRTg LRTg2 uˆ kˆ gˆ g
0 0 9.0 3.2 0.0023 1.06 0.088 3.23107 0 0.028 17.0 6.2 0.0027 1.08 0.170 0.009 0.004 0 16.2 6.0 0.0036 1.04 0.215 0.046 0.008 0 45.0 32.6 0.0047 1.07 0.366 0.191 0.02 0 97.4 93.6 0.0077 1.06 0.681 0.639 0.04 0 100.0 100.0 0.0107 1.08 1.044 1.070 0.04 0.028 100.0 100.0 0.0118 1.06 1.161 1.210
The simulation method was similar to that used in Table 6, with the additional feature that selection was acting on synon-ymous sites with intensityg¼2. In all cases,L¼50 kb,u¼ 0.02, andk¼1. For each parameter combination, the results were based on analyzing 500 random samples of 15 chromo-somes. Note that, for cases withr,0.01, the power of LRTg should be interpreted with caution because of inflated type I error rates (Table 6).
ag
-values predicted using the background selection for-mula forNe(Equation 4).
Tajima’sDand related tests for detecting skews in the site frequency spectrum (reviewed by Charlesworth and Charlesworth2010, pp. 287–291). In cases where our likelihood-ratio tests for detecting selection and mutational bias are counterconservative, we find that thead hocapproach of performing the tests with a chi-square distribution with 2 d.f. can effectively solve the problem of inflated type I error rates, while retaining reasonable power to detect selection and mutational bias (Tables 3 and 6).
We have paid particular attention to the effect of selection at linked sites on the behavior of neutral or weakly selected sites. Consistent with earlier work (Kaiser and Charlesworth2009; Segeret al.2010), we found that selection on nonsynonymous sites causes a large skew in the site frequency spectrum at neutral sites when the recombination rate is very low, with very negative values of Tajima’s D, many of which approach the minimal possible value (Figure 2). This pattern could easily be mistaken for the effect of a selective sweep, as discussed by Kaiserand Charlesworth(2009).
In addition, as mentioned in the description of the results shown in Tables 6 and 7, when sites subject to weak purifying selection, such as synonymous or noncoding sites, are embedded in a large low-recombination region containing many strongly selected sites, the estimated scaled intensity of selection,g ¼ 4Nes, for the weakly selected sites (Table 7) is reduced by considerably more than that predicted from the reduction inNecaused by the strongly selected (nonsynonymous) sites, as esti-mated from diversity at neutral sites (see the last section ofresults). This is probably caused by the additional HRI among the weakly selected sites themselves (McVean and Charlesworth 2000; Comeron and Kreitman2002; Comeronet al.2008).
For recombination rates that are typical of normally recombining regions of the Drosophila or human genomes, in the presence of the strongly selected sites, there is still a reduction inNefor neutral synonymous sites and in g for weakly selected sites, which is well predicted by the background selection equation (Equa-tion 4). But with low levels of recombina(Equa-tion, this equation tends to overestimate the reduction in Ne and g (Table 7). This phenomenon was noted pre-viously (Kaiserand Charlesworth2009) and reflects HRI between the nonsynonymous sites in regions with very low recombination rates, which weakens the effec-tive strength of selection acting on them. As a result, the deterministic mutation–selection model on which stan-dard background selection theory is based does not apply.
It should be noted that we have not attempted to construct a realistic model of genome structure for normally recombining genomic regions; the results shown in Tables 6 and 7 make no allowance for non-coding sequences either within or between genes, which are common in eukaryotes and can potentially serve as
spacers reducing HRI (Comeronand Kreitman2002), although there is evidence that noncoding regions are themselves under selection (e.g., Andolfatto 2005; Haddrillet al.2005). The effects of HRI that we have described here are probably overestimates of the true effects for genes in normally recombining regions. Further work is needed to determine the properties of more realistic models.
Differences between the PRF methods and the RM methods:The key difference between the PRF methods and the RM methods is that with PRF alleles are typically classified as ancestral and derived using outgroup sequences, whereas with RM alleles are assigned to several predetermined classes (typically two; see Zeng 2010 for a multiallele model) that are potentially selectively different. Examples of the latter include preferred and unpreferred synonymous codons (Li 1987; Bulmer 1991; McVean and Charlesworth 1999) or AT and GC in noncoding regions (Galtier et al.2006; Haddrilland Charlesworth2008; Zeng and Charlesworth 2010). The need to define selec-tively different allele classes makes it hard to apply the RM approach to such problems as the distribution of fitness effects of nonsynonymous mutations (Eyre -Walker et al. 2006; Keightley and Eyre-Walker 2007; Boykoet al. 2008). Further work is needed to determine whether the desirable properties of the RM methods can be used for this purpose.
A question that is raised by our results is the fact that close linkage does not seem to produce a high variance in the estimates ofgandkfrom the RM method (Figure 1), in contrast to the well-known effect of close linkage on the variance of estimates ofu(Hudson1983, 1990). The intuitive reason for this is that the variance of the estimate ofureflects the large stochastic variation in the size of gene genealogies; linked sites have a high covariance of tree sizes, which inflates the variance of the mean tree size across sites compared with that of a set of independent genealogies (Pluzhnikov and Donnelly 1996; McVean 2002). The associated vari-ability in the shapes of trees will also generate more variability in the frequencies of derived vs. ancestral variants for sets of closely linked sites compared with in-dependent sites, resulting in a higher frequency of false positive results of tests for selection from PRF methods (Bustamanteet al.2001; Zhuand Bustamante2005; Desaiand Plotkin2008).
Charlesworth 2009; Zeng2010), which is also little affected by tree size or shape. Similar considerations may apply to the effects of population structure and population size changes. Overall, therefore, there are reasons to expect that the RM approach is more robust than the PRF method. However, it is worth emphasizing that, due to computational constraints, the results presented in this study are based on a limited number of combinations of parameter values. Therefore, they should not be overinterpreted.
We thank Andrew Rambaut for valuable discussions on various computer algorithms. We also thank Noah Rosenberg and two anonymous reviewers for helpful comments. This study made use of the resources provided by the Edinburgh Compute and Data Facility (ECDF) (http://www.ecdf.ed.ac.uk/). The ECDF is partially supported by the e-Science Data, Information, and Knowledge Transformation (eDIKT) initiative (http://www.edikt.org.uk). K.Z. acknowledges sup-port from a Biomedical Personal Research Fellowship awarded by the Royal Society of Edinburgh and the Caledonian Research Foundation.
LITERATURE CITED
Akashi, H., and S. W. Schaeffer, 1997 Natural selection and the frequency distributions of ‘‘silent’’ DNA polymorphism in Dro-sophila. Genetics146:295–307.
Andolfatto, P., 2005 Adaptive evolution of non-coding DNA in Drosophila. Nature437:1149–1152.
Bartolome´, C., X. Maside, S. Yi, A. L. Grantand B. Charlesworth, 2005 Patterns of selection on synonymous and nonsynonymous variants inDrosophila miranda.Genetics169:1495–1507. Barton, N. H., 1998 The effect of hitch-hiking on neutral
geneal-ogies. Genet. Res.72:123–133.
Baudry, E., and F. Depaulis, 2003 Effect of misoriented sites on neutrality tests with outgroup. Genetics165:1619–1622. Boyko, A. R., S. H. Williamson, A. R. Indap, J. D. Degenhardt,
R. D. Hernandezet al., 2008 Assessing the evolutionary impact of amino acid mutations in the human genome. PLoS Genet.4:
e1000083.
Bulmer, M., 1991 The selection-mutation-drift theory of synony-mous codon usage. Genetics129:897–907.
Bustamante, C. D., J. Wakeley, S. Sawyerand D. L. Hartl, 2001 Direc-tional selection and the site-frequency spectrum. Genetics159:
1779–1788.
Bustamante, C. D., R. Nielsen, S. A. Sawyer, K. M. Olsen, M. D. Puruggananet al., 2002 The cost of inbreeding in Arabidopsis. Nature416:531–534.
Charlesworth, B., and D. Charlesworth, 1997 Rapid fixation of deleterious alleles can be caused by Muller’s ratchet. Genet. Res.
70:63–73.
Charlesworth, B., and D. Charlesworth, 2010 Elements of Evolu-tionary Genetics.Roberts & Co., Greenwood Village, CO. Charlesworth, B., M. T. Morgan and D. Charlesworth,
1993 The effect of deleterious mutations on neutral molecular variation. Genetics134:1289–1303.
Charlesworth, B., A. J. Betancourt, V. B. Kaiserand I. Gordo, 2010 Genetic recombination and molecular evolution. Cold Spring Harbor Symp. Quant. Biol.74:177–186.
Charlesworth, D., B. Charlesworthand M. T. Morgan, 1995 The pattern of neutral molecular variation under the background selec-tion model. Genetics141:1619–1632.
Comeron, J. M., and T. B. Guthrie, 2005 Intragenic Hill-Robertson interference influences selection intensity on synonymous muta-tions in Drosophila. Mol. Biol. Evol.22:2519–2530.
Comeron, J. M., and M. Kreitman, 2002 Population, evolutionary and genomic consequences of interference selection. Genetics
161:389–410.
Comeron, J. M., A. Willifordand R. M. Kliman, 2008 The Hill-Robertson effect: evolutionary consequences of weak selection and linkage in finite populations. Heredity100:19–31.
Cutter, A. D., 2008 Multilocus patterns of polymorphism and selec-tion across the X chromosome ofCaenorhabditis remanei.Genetics
178:1661–1672.
Cutter, A. D., and B. Charlesworth, 2006 Selection intensity on preferred codons correlates with overall codon usage bias in Cae-norhabditis remanei. Curr. Biol.16:2053–2057.
De, A., and R. Durrett, 2007 Stepping-stone spatial structure causes slow decay of linkage disequilibrium and shifts the site fre-quency spectrum. Genetics176:969–981.
Desai, M. M., and J. B. Plotkin, 2008 The polymorphism frequency spectrum of finitely many sites under selection. Genetics180:
2175–2191.
Ewens, W. J., 2004 Mathematical Population Genetics.Springer-Verlag, Berlin.
Eyre-Walker, A., M. Woolfitand T. Phelps, 2006 The distribu-tion of fitness effects of new deleterious amino acid mutadistribu-tions in humans. Genetics173:891–900.
Felsenstein, J., 1974 The evolutionary advantage of recombina-tion. Genetics78:737–756.
Fu, Y. X., 1996 New statistical tests of neutrality for DNA samples from a population. Genetics143:557–570.
Fu, Y. X., 1997 Statistical tests of neutrality of mutations against pop-ulation growth, hitchhiking and background selection. Genetics
147:915–925.
Galtier, N., E. Bazinand N. Bierne, 2006 GC-biased segregation of noncoding polymorphisms in Drosophila. Genetics172:221–228. Gillespie, J. H., 1991 The Cause of Molecular Evolution.Oxford
Uni-versity Press, Oxford.
Gordo, I., A. Navarroand B. Charlesworth, 2002 Muller’s ratchet and the pattern of variation at a neutral locus. Genetics161:835–848. Griffiths, R. C., and P. Marjoram, 1996 Ancestral inference from samples of DNA sequences with recombination. J. Comput. Biol.
3:479–502.
Gutenkunst, R. N., R. D. Hernandez, S. H. Williamsonand C. D. Bustamante, 2009 Inferring the joint demographic history of multiple populations from multidimensional SNP frequency data. PLoS Genet.5:e1000695.
Haddrill, P. R., and B. Charlesworth, 2008 Non-neutral pro-cesses drive the nucleotide composition of non-coding sequences in Drosophila. Biol. Lett.4:438–441.
Haddrill, P. R., B. Charlesworth, D. L. Halliganand P. Andolfatto, 2005 Patterns of intron sequence evolution in Drosophila are dependent upon length and GC content. Genome Biol.6:R67. Hernandez, R. D., S. H. Williamson and C. D. Bustamante, 2007 Context dependence, ancestral misidentification, and spurious signatures of natural selection. Mol. Biol. Evol. 24:
1792–1800.
Hey, J., and R. M. Kliman, 2002 Interactions between natural selec-tion, recombination and gene density in the genes of Drosophila. Genetics160:595–608.
Hill, W. G., and A. Robertson, 1966 The effect of linkage on limits to artificial selection. Genet. Res.8:269–294.
Hilliker, A. J., G. Harauz, A. G. Reaume, M. Gray, S. H. Clark et al., 1994 Meiotic gene conversion tract length distribution within the rosy locus of Drosophila melanogaster.Genetics 137:
1019–1026.
Hudson, R. R., 1983 Properties of a neutral allele model with intra-genic recombination. Theor. Popul. Biol.23:183–201. Hudson, R. R., 1990 Gene genealogies and the coalescent process,
pp. 1–44 inOxford Surveys in Evolutionary Biology, Vol. 7, edited by D. Futuyma and J. Antonovics. Oxford University Press, Oxford.
Hudson, R. R., and N. L. Kaplan, 1994 Gene trees with background selection, pp. 140–153 inNon-Neutral Evolution: Theories and Mo-lecular Data, edited by B. Golding. Chapman & Hall, London. Jensen, J. D., Y. Kim, V. B. DuMont, C. F. Aquadro and C. D.
Bustamante, 2005 Distinguishing between selective sweeps and demography using DNA polymorphism data. Genetics
170:1401–1410.
Kaiser, V. B., and B. Charlesworth, 2009 The effects of deleteri-ous mutations on evolution in non-recombining genomes. Trends Genet.25:9–12.
Keightley, P. D., and A. Eyre-Walker, 2007 Joint inference of the distribution of fitness effects of deleterious mutations and
ulation demography based on nucleotide polymorphism fre-quencies. Genetics177:2251–2261.
Keightley, P. D., U. Trivedi, M. Thomson, F. Oliver, S. Kumar et al., 2009 Analysis of the genome sequences of three Drosoph-ila melanogaster spontaneous mutation accumulation lines. Ge-nome Res.19:1195–1201.
Kimura, M., 1971 Theoretical foundation of population genetics at the molecular level. Theor. Popul. Biol.2:174–208.
Kimura, M., 1983 The Neutral Theory of Molecular Evolution. Cam-bridge University Press, CamCam-bridge, UK.
Kondrashov, A. S., 1995 Contamination of the genome by very slightly deleterious mutations: Why have we not died 100 times over? J. Theor. Biol.175:583–594.
Kreitman, M., 1983 Nucleotide polymorphism at the alcohol de-hydrogenase locus of Drosophila melanogaster. Nature 304:
412–417.
Li, W. H., 1987 Models of nearly neutral mutations with particular implications for nonrandom usage of synonymous codons. J. Mol. Evol.24:337–345.
Li, W. H., 1997 Molecular Evolution.Sinauer Associates, Sunderland, MA.
Loewe, L., and B. Charlesworth, 2006 Inferring the distribution of mutational effects on fitness in Drosophila. Biol. Lett.2:426–430. Loewe, L., and B. Charlesworth, 2007 Background selection in single genes may explain patterns of codon bias. Genetics175:
1381–1393.
Loewe, L., B. Charlesworth, C. Bartolome and V. Noel, 2006 Estimating selection on nonsynonymous mutations. Genetics172:1079–1092.
Maside, X., A. W. Leeand B. Charlesworth, 2004 Selection on codon usage in Drosophila americana. Curr. Biol.14:150–154. McVean, G. A., 2002 A genealogical interpretation of linkage
dis-equilibrium. Genetics162:987–991.
McVean, G. A. T., and B. Charlesworth, 1999 A population ge-netic model for the evolution of synonymous codon usage: pat-terns and predictions. Genet. Res.74:145–158.
McVean, G. A., and B. Charlesworth, 2000 The effects of Hill-Robertson interference between weakly selected mutations on pat-terns of molecular evolution and variation. Genetics155:929–944. Neuhauser, C., and S. M. Krone, 1997 The genealogy of samples in
models with selection. Genetics145:519–534.
Nielsen, R., 2005 Molecular signatures of natural selection. Annu. Rev. Genet.39:197–218.
Nordborg, M., B. Charlesworthand D. Charlesworth, 1996 The effect of recombination on background selection. Genet. Res.67:
159–174.
Palsson, S., 2002 Selection on a modifier of recombination rate due to linked deleterious mutations. J. Hered.93:22–26. Pluzhnikov, A., and P. Donnelly, 1996 Optimal sequencing
strat-egies for surveying molecular genetic diversity. Genetics 144:
1247–1262.
Press, W. H., S. A. Teukolsky, W. T. Vetterlingand B. P. Flannery, 1992 Numerical Recipes in C: The Art of Scientific Computing. Cam-bridge University Press, CamCam-bridge, UK.
Sawyer, S. A., and D. L. Hartl, 1992 Population genetics of poly-morphism and divergence. Genetics132:1161–1176.
Sawyer, S. A., R. J. Kulathinal, C. D. Bustamanteand D. L. Hartl, 2003 Bayesian analysis suggests that most amino acid replace-ments in Drosophila are driven by positive selection. J. Mol. Evol.
57(Suppl. 1): S154–S164.
Sawyer, S. A., J. Parsch, Z. Zhangand D. L. Hartl, 2007 Prevalence of positive selection among nearly neutral amino acid replace-ments in Drosophila. Proc. Natl. Acad. Sci. USA104:6504–6510.
Schaeffer, S. W., 2002 Molecular population genetics of sequence length diversity in the Adh region of Drosophila pseudoobscura. Genet. Res.80:163–175.
Seger, J., W. A. Smith, J. J. Perry, J. Hunn, Z. A. Kaliszewska et al., 2010 Gene genealogies strongly distorted by weakly inter-fering mutations in constant environments. Genetics184:529– 545.
Simonsen, K. L., G. A. Churchilland C. F. Aquadro, 1995 Properties of statistical tests of neutrality for DNA polymorphism data. Genet-ics141:413–429.
Slatkin, M., and R. R. Hudson, 1991 Pairwise comparisons of mi-tochondrial DNA sequences in stable and exponentially growing populations. Genetics129:555–562.
Stephan, W., B. Charlesworthand G. McVean, 1999 The effect of background selection at a single locus on weakly selected, par-tially linked variants. Genet. Res.73:133–146.
Stumpf, M. P., and G. A. McVean, 2003 Estimating recombination rates from population-genetic data. Nat. Rev. Genet.4:959–968. Tachida, H., 2000 Molecular evolution in a multisite nearly neutral
mutation model. J. Mol. Evol.50:69–81.
Tajima, F., 1989a The effect of change in population size on DNA polymorphism. Genetics123:597–601.
Tajima, F., 1989b Statistical method for testing the neutral mutation hypothesis by DNA polymorphism. Genetics123:585–595. Thornton, K., and P. Andolfatto, 2006 Approximate Bayesian
inference reveals evidence for a recent, severe bottleneck in a Netherlands population of Drosophila melanogaster. Genetics
172:1607–1619.
Wall, J. D., and R. R. Hudson, 2001 Coalescent simulations and sta-tistical tests of neutrality. Mol. Biol. Evol.18:1134–1135; author reply 1136–1138.
Williamson, S. H., R. Hernandez, A. Fledel-Alon, L. Zhu, R. Nielsenet al., 2005 Simultaneous inference of selection and population growth from patterns of variation in the human genome. Proc. Natl. Acad. Sci. USA102:7882–7887.
Wiuf, C., 2006 Consistency of estimators of population scaled pa-rameters using composite likelihood. J. Math. Biol.53:821–841. Wright, S., 1931 Evolution in Mendelian populations. Genetics16:
97–159.
Wright, S., 1949 Adaptation and selection, pp. 365–389 inGenetics, Palaeontology, and Evolution, edited by G. Jepson, G. Simpsonand E. Mayr. Princeton University Press, Princeton, NJ.
Zeng, K., 2010 A simple multi-allele model and its application to identifying preferred/unpreferred codons using polymorphism data. Mol. Biol. Evol.27:1327–1337.
Zeng, K., and B. Charlesworth, 2009 Estimating selection inten-sity on synonymous codon usage in a nonequilibrium popula-tion. Genetics183:651–662.
Zeng, K., and B. Charlesworth, 2010 Studying patterns of recent evolution at synonymous sites and intronic sites in Drosophila melanogaster. J. Mol. Evol.70:116–128.
Zeng, K., Y. X. Fu, S. Shiand C. I. Wu, 2006 Statistical tests for de-tecting positive selection by utilizing high-frequency variants. Genetics174:1431–1439.
Zhu, L., and C. D. Bustamante, 2005 A composite-likelihood ap-proach for detecting directional selection from DNA sequence data. Genetics170:1411–1421.
GENETICS
Supporting Information
http://www.genetics.org/cgi/content/full/genetics.110.122150/DC1
The Effects of Demography and Linkage on the Estimation of Selection
and Mutation Parameters
Kai Zeng and Brian Charlesworth
K. Zeng and B. Charlesworth 2 SI
FILE S1
We adopt the matrix-based representation of the reversible mutation model described in ZENG and CHARLESWORTH
(2009). Consider a diploid Wright-Fisher population (EWENS 2004, p. 20), whose size in generation t is Nt. At an autosomal
nucleotide site, two selectively indifferent variants, A0 and A1, can occur. Mutation is reversible: the per generation mutation
rate from A0 and A1 is u, and that in the reverse direction is u. Let fi(t) be the probability that A1 is represented i times in the
population at time t, and pij(t) be the probability that the number of copies of A1 changes from i in generation t to j in
generation t+1 (Eq. 3 in ZENG and CHARLESWORTH 2009). Standard Markov chain theory implies the following recursion
relationship (KARLIN and TAYLOR 1975)
. (A1)
ZENG and CHARLESWORTH (2009) showed that fi(t) can be decomposed into two sub-processes
(A2)
In (A2), f1,i(t) is the probability that the mutant allele A1 is currently represented i times in the population, having originated at
a site fixed for A0. The second sub-process involves mutations originating at sites fixed for A1, such that the mutant allele A0 is
currently represented 2Nt – i times in the population (i.e., A1 is represented i times). For the first sub-process, we have the
following recursion formula
. (A3)
Under the infinite sites assumption of t = 4Ntu << 1, (A3) can be approximated by
(A4)
where i,1 is the Kronecker delta, which takes the value of one if i = 1 and the value of zero otherwise, and