Selection in a Subdivided Population With Dominance or
Local Frequency Dependence
Joshua L. Cherry
1Department of Organismic and Evolutionary Biology, Harvard University, Cambridge, Massachusetts 02138
Manuscript received October 21, 2002 Accepted for publication January 2, 2003
ABSTRACT
The interplay between population structure and natural selection is an area of great interest. It is known that certain types of population subdivision do not alter fixation probabilities of selected alleles under genic, frequency-independent selection. In the presence of dominance for fitness or frequency-dependent selection these same types of subdivision can have large effects on fixation probabilities. For example, the barrier to fixation of a fitter allele due to underdominance is reduced by subdivision. Analytic results presented here relate a subdivided population that conforms to a finite island model to an approximately equivalent panmictic population. The size of this equivalent population is different from (larger than) the actual size of the subdivided population. Selection parameters are also different in the hypothetical equivalent population. As expected, the degree of dominance is lower in the equivalent population. The results are not limited to dominance but cover any form of polynomial frequency dependence.
N
ATURAL populations are likely to be character- been the case of underdominance (heterozygote disad-vantage), which can serve as a barrier to the fixation of ized by some kind of population structure. Thepopulation-genetic and evolutionary consequences of a fitter genotype. Subdivision reduces this barrier, and this effect has been interpreted as a simple case of such structure have been investigated since the
begin-nings of population genetics (Wright 1931, 1939, Wright’s “shifting balance” theory (Lande1985), a the-ory that has been a topic of debate for many decades. 1943). Much work has centered on the amount of
poly-morphism maintained in a subdivided population (Slat- Formally equivalent to dominance is a form of locally frequency-dependent selection. For example, selection
kin 1977; Maruyama and Kimura 1980; Nagylaki
1998) and on the distribution of allele frequencies that favors an allele when it is locally common, but disfavors it when it is rare, is similar to underdominance,
(Maruyama, 1972a,b,c). A closely related topic is the
effective size of a subdivided population (Wright1939; and underdominance may be considered a case of posi-tive frequency dependence. Frequency dependence
Maruyama 1970a; Slatkin 1981, 1991; Takahata
1991;NeiandTakahata1993;SantiagoandCabal- may have any form; it need not be restricted to the linear case that is formally equivalent to dominance.
lero 1995; Whitlock and Barton 1997; Wang and
Caballero1999). Analytic results, including expressions for fixation
probabilities, have been obtained for selection with One area of interest is the interaction of population
structure with selection.Maruyama(1970b, 1974) has dominance in the low-migration limit (Slatkin 1981; shown that fixation probabilities are unaffected by pop- Lande1985). Simulations have provided results for in-ulation subdivision under simple genic selection and termediate cases, where the migration rate is neither fairly general conditions of migration patterns. Under very low nor sufficiently high to make subdivision irrele-a finite islirrele-and model of subdivision with irrele-a lirrele-arge number vant (Slatkin1981;Spiritoet al.1993). Here I present of demes, the trajectory of allele frequency over time is analytic results that are not restricted to the weak-migra-approximately the same as that in a panmictic popula- tion limit for a finite island model of subdivision. These tion with a different size and different selection coeffi- results relate the subdivided population to a hypotheti-cient (Cherry andWakeley2003). cal equivalent panmictic population that differs from If the assumption of genic selection is relaxed, the the actual population in both its size and its selection problem becomes more difficult. Subdivision affects parameters. The selection parameterh, which is a mea-fixation probabilities when there is dominance for fit- sure of dominance for fitness (or degree of frequency ness or when the relative fitnesses of genotypes depend dependence), is in effect moved toward 1⁄
2 (additive on their frequencies. An area of particular interest has fitness or no frequency dependence) by subdivision. This result can be generalized to more complicated forms of frequency dependence. The existence of an equivalent panmictic population allows application of
1Address for correspondence:2307 Massachusetts Ave., Cambridge, MA
02140. E-mail: [email protected] established diffusion results to the subdivided
tion. Such quantities of fixation probabilities and ex- need to consider the probability distribution of the al-lele frequency in theith deme,xi. If drift within a deme pected times to fixation can be calculated.
is strong compared to selection, the population as a whole in effect serves in the short term as a source MODELS AND RESULTS
population for any subpopulation, with constant allele frequencyx. Under these conditions the distribution of Consider a finite island model of population
struc-ture, in which a finite number of demes (“islands”) within-deme allele frequency is a beta distribution whose probability density function is
exchange migrants with one another. The population consists ofDdemes, each containingNhaploid orN/2
diploid individuals. Each generation involves migration, 1 B(a,b)x
a⫺1
i (1⫺xi)b⫺1, selection, and genetic drift. The order in which these
occur makes little difference when selection coefficients where a ⫽2Nmx,b⫽2Nm(1⫺x), and the beta func-and migration rates are small compared to unity, so this tion B is defined by B(a,b)⫽兰10xa⫺1(1 ⫺ x)b⫺1dx order need not be specified. The migration rate (the (Wright1931;DobzhanskyandWright1941). The expected fraction of genes that come from outside the moments of this distribution follow from the recursion deme in any generation) is given bym, and selection properties of the beta function, namely thatB(a⫹1,b)⫽ operates in a manner to be specified below. (a/(a⫹b))B(a,b). The first, second, and third moments Three processes, selection, drift, and migration, alter of this distribution area/(a⫹ b), (a ⫹1)a/(a ⫹b ⫹ the frequency of an allele in a deme each generation. 1)(a⫹b), and (a⫹2)(a⫹ 1)a/(a⫹b⫹2)(a ⫹b⫹ Migration is symmetric in the island model, so it does 1)(a ⫹ b), respectively. These are all that we need to not affect the overall allele frequency x (it does not know to treat the case of dominance or linear frequency affect the mean, and its effect on the variance is negligi- dependence.
ble). The effects of selection and drift are approximately The beta-distribution approximation is valid when additive. The mean change inxresults from selection, selection is weak compared to drift in a subpopulation, whereas the variance is the result of genetic drift. in the sense that |sˆ|Ⰶ 1/N. This condition must hold
Dominance: Cherry andWakeley(2003) analyzed for all allele frequencies. In the present case, sˆ(x i) ⫽ the case of genic selection in an island model of subdivi- 2hs(1⫺ x
i)⫹ (2s⫺ 2hs)xi takes on its most extreme sion. This analysis can be extended to cases where there values at allele frequencies of zero or one. Thus the is dominance for fitness, including over- and underdom- constraint on the strength of selection becomes inance. These cases are equivalent, in terms of their
|2Nhs|Ⰶ 1 (2)
usual diffusion approximations, to a certain form of frequency-dependent selection. Diffusion results for
and dominance in a panmictic population are well
estab-lished. I show that, under certain conditions, the diffu- |2N(1⫺ h)s|Ⰶ1 . (3) sion for a subdivided population is equivalent to that
This condition allows selection to be strong compared for some panmictic population. As in the case of genic
to drift in the population as a whole and hence allows selection, this equivalent panmictic population differs
selection to have a large effect on the fate of an allele. from the subdivided population not only in size, but
The stochastic change in allele frequency in a deme also in fitness parameters.
comes from the binomial sampling of alleles. Thus the Suppose that the fitnesses of genotypesaa, Aa, and
variance of the change in allele frequency in the ith AA are 1, 1 ⫹ 2hs, and 1⫹ 2s. The fitness difference
deme is ⵑ(1/N)xi(1 ⫺ xi). Using expressions for the between the two alleles is 2hswhen paired with an a
first two moments of the beta distribution we can show allele and 2s⫺2hswhen paired with anAallele. Thus
that the variance of the change in population-wide fre-the mean selective difference between fre-the two allelessˆ,
quencyxis given by which might be called the marginal selection coefficient
(by analogy to the marginal fitness), depends on the
V⌬x⫽ 1 D2
兺
i
(1/N)xi(1⫺xi)⬇ 1
NDExi(1⫺ xi) allele frequency and is given by
sˆ(x)⫽2hs(1 ⫺x)⫹(2s⫺ 2hs)x (1)
⫽ 1 ND
2Nm
2Nm ⫹1. (4)
in an unstructured population with nonassortative mat-ing. This can be rewritten assˆ(x)⫽2hs⫹(2s⫺4hs)x,
The variance definition of effective population sizeNe which makes it clearer thatsˆ(x) has the formk0⫹ k1x,
is given byV⌬x⫽(1/Ne)x(1⫺ x). Thus we have with k0⫽ 2hsandk1⫽ 2s⫺ 4hs.
Now consider a subdivided population. We are
inter-Ne⫽DN/
冢
2Nm2Nm⫹1
冣
⫽冢
1⫹ 1 2Nm冣
DN. ested in the mean and variance of the change in overallallele frequency from one generation to the next, M⌬x
(Wright1943;NeiandTakahata1993). It is identical The parameterization involvingsandh cannot be ap-plied to symmetric over- or underdominance:swould to the effective size obtained in the analogous context
for the case of genic selection (CherryandWakeley have to be zero for symmetry, while hswould have to be nonzero for over- or underdominance. One parame-2003).
The mean change, on the other hand, is affected by terization that can represent the symmetric cases is that involving k0 and k1. A more commonly used notation the more complex selection scheme. For theith deme,
the change in allele frequency xi due to selection is for dominance gives the fitnesses ofaa,Aa, andAAas 1, 1 ⫹ s1, and 1 ⫹ s2. Let s1e and s2e be the effective approximately sˆ(xi)xi(1 ⫺ xi) ⫽ (k0 ⫹ k1xi)xi(1 ⫺ xi).
We are interested in the mean of this quantity. Using values ofs1ands2. Using the fact thats1⫽2hsands2⫽ 2s, we obtain
the approximation that thexiare beta distributed with a⫽2Nmxandb⫽ 2Nm(1⫺x), along with expressions
for the first three moments of a beta distribution, we s1e⫽
冢
2Nm 2Nm⫹1冣 冤冢
Nm Nm⫹ 1
冣
s1⫹1 2
冢
1 Nm⫹1
冣
s2冥
can show that the mean change inxis given bys2e⫽
冢
2Nm 2Nm⫹1冣
s2. M⌬x⫽冤冢
k0⫹k1/2 Nm⫹1
冣
⫹冢
Nm Nm⫹1
冣
k1x冥 冢
2Nm
2Nm⫹1
冣
x(1⫺x) . (5)Note thats1edepends on s2as well ass1. This expression has the form (k0e⫹ k1ex)x(1⫺x).
To-In the symmetric case s2 ⫽ 0. If we lets⬘ ⫽ s1 then gether with the form of V⌬x (Equation 4), this shows
both homozygotes have fitness 1 and the heterozygote that the diffusion for the subdivided population is
equiv-has fitness 1⫹s⬘. Ifs⬘eis the effective value ofs⬘under alent to that for a panmictic population with altered
subdivision, we have parameters. The constantsk0eandk1eare to be
interpre-ted as the effective values ofk0 andk1, i.e., the values
s⬘e ⫽
冢
2Nm 2Nm⫹ 1冣 冢
Nm Nm⫹ 1
冣
s⬘. that, in a hypothetical Wright-Fisher population withsizeNe, yield roughly the same trajectory of allele
fre-More complicated forms of selection: The analysis quency as does the actual subdivided population. From
given above applies when the frequency dependence of Equation 5 it follows that
the selective difference between the alleles has the form sˆ(x)⫽k0⫹k1x. This case includes an arbitrary degree k0e⫽
冢
2Nm2Nm⫹ 1
冣 冢
k0⫹ k1/2Nm⫹ 1
冣
of dominance when the relative fitnesses of the diploid genotypes do not depend on their frequencies. This is k1e⫽冢
2Nm2Nm⫹ 1
冣 冢
NmNm⫹ 1
冣
k1. (6) not the only possible form of frequency dependence; sˆ(x) can in principle have any form whatsoever. Can we Converting back to notation involvinghandsand their obtain diffusion approximations for more complicated analogs in the equivalent panmictic populationheand forms ofsˆ(x) when the population is subdivided, again se, and recalling our expression forNe, we obtain assuming that |Nsˆ(x)| is always small compared to 1?The results obtained above are consequences of the forms of the first three moments of the beta distribution. Ne⫽
冢
1⫹ 12Nm
冣
DN The useful properties of these moments extend to thehigher-order moments. These properties permit the se⫽
冢
2Nm2Nm ⫹1
冣
s analysis of cases where the frequency dependence isdescribed by any polynomial,i.e., wheresˆ(x)⫽P(x)⫽ k0⫹k1x⫹k2x2 ⫹. . .⫹k
nxn. We see that the diffusion he⫽ h⫺h ⫺1/2
Nm⫹1 ⫽ 1 2⫹
冢
Nm
Nm⫹1
冣 冢
h⫺ 12
冣
. (7) for a subdivided population with this form of selection is equivalent to that for a panmictic population with a As in the case of genic selection, subdivision increases different size and withsˆe(x)⫽Pe(x)⫽k0e⫹k1ex⫹k2ex2 Ne by a certain factor and decreases se by this same ⫹ . . . ⫹ knexn. Simple dominance is a special case of factor, so that Nese is unaffected by subdivision. The this, with the degree of the polynomialsPandPeequal effect of subdivision onhe is to move it toward 1⁄
2 and to 1.
therefore to decrease the effective strength of domi- Recall that we are interested in the expected value nance or frequency dependence, as expected from pre- of
sˆ(x)x(1 ⫺ x) when x has a beta distribution with vious work (Slatkin1981; Lande 1985;Spiritoet al. parameters
a⫽2Nmxandb ⫽2Nm(1⫺ x). For polyno-1993). This is made clear by the relationship mialsˆ(x),sˆ(x)x(1⫺x) is the sum of terms of the form
kixi⫹1(1⫺ x). For any beta distribution he⫺1
2⫽
冢
NmNm⫹ 1
冣 冢
h ⫺ 1 2冣
.E{xi⫹1(1⫺x)}⫽ (a⫹i)(a⫹i⫺1) . . . (a⫹1)ab
(a⫹b⫹i⫹1)(a⫹b⫹i) . . . (a⫹b⫹1)(a⫹b).
Alternative parameterizations:There are several
Figure 1.—Predicted and observed fixation probabilities as functions ofhandm. Predicted values of fixation probabilities (curves), relative to that for a neutral allele, are compared to values estimated by simulations (points) for a range of values of the dominance parameterh. In all cases the number of demes (D) is 100, the deme size (N) is 100, ands⫽10⫺4. The allele was initially present in a single copy. Results are presented for three migration rates:m⫽0.001 (solid triangles and curve),m⫽0.003 (open circles and curve), andm⫽0.01 (solid diamonds and curve).
function mentioned earlier. In the present case, a ⫹ be applied to a polynomialsˆ(x) of any degree or to a Taylor series of an analytic function.
b⫽2Nm, so the denominator is independent ofx. The numerator expands to an expression of the form Q(x) x(1⫺ x), whereQ(x) is a polynomial of degreeiin x.
COMPUTER SIMULATIONS It follows thatE{P(x)x(1⫺x)} has the formPe(x)x(1⫺
x) for some polynomialPeof the same degree asP. The To test the approximations used above, I have run coefficients of this polynomial (k0e,k1e,k2e, . . .kne), which computer simulations and compared the results to theo-depend on the coefficients ofPand onNandm, may be retical predictions. In these simulations frequency-obtained by some tedious but straightforward algebra. dependent selection acts on a haploid population. Most Consider, for example, the case of quadratic frequency of the simulations are for cases of linear frequency de-dependence, wheresˆ(x)⫽P(x)⫽k0⫹k1x⫹k2x2. We pendence and can also be interpreted in terms of
dip-have loidy with dominance. I utilize the parameterization
involvingsandhfor these cases. E{x3(1⫺x)}⫽ (a⫹2)(a⫹1)ab
(a⫹b⫹3)(a⫹b⫹2)(a⫹b⫹1)(a⫹b) In these simulations the state of the population is
represented by an array ofDintegers, each
correspond-⫽(2Nmx⫹2)(2Nmx⫹1)2Nmx2Nm(1⫺x)
(2Nm⫹3)(2Nm⫹2)(2Nm⫹1)2Nm ing to a deme. Each integer indicates the number of copies of alleleAin the deme and hence ranges from 0 to N. Each generation the new value for each deme
⫽
冢
2Nm 2Nm⫹1冣(2Nm)2x2⫹6Nmx⫹2
(2Nm⫹3)(2Nm⫹2)(2Nm⫹1)x(1⫺x) . is drawn from a binomial distribution. The index
param-eternof this binomial (number of “trials”) is equal to Thus the quadratic term of P contributes quadratic,
N. The probability parameterp(probability of “success”) linear, and constant terms toPe, so the value ofk2affects
is determined by the current allele frequency in the not only the value ofk2e, but also the values ofk1eandk0e.
deme xi, the population-wide mean allele frequencyx, Combining this result with those given for first-degree
the migration rate m, and the selection parameters s frequency dependence we obtain
and h. Let p˜ ⫽ (1 ⫺ m)xi ⫹ mx. This would be the expected allele frequency in theith deme in the next k0e⫽
冢
2Nm2Nm⫹1冣 冢k0⫹ k1/2 Nm⫹1 ⫹
k2
(2Nm⫹3)(Nm⫹1)冣 generation if there were no selection. The (marginal) selection coefficient is given bysˆ(p˜). Thereforep⫽(1⫹ sˆ)p˜/(1⫹ sˆp˜).
k1e⫽
冢
2Nm 2Nm⫹1冣 冢Nm
Nm⫹1冣 冢k1⫹ 3Nm
2Nm⫹3k2
冣
Predictions of fixation probabilities follow from com-bination of the theory presented here with classical k2e⫽冢
2Nm2Nm⫹3冣 冢 Nm Nm⫹1冣 冢
2Nm
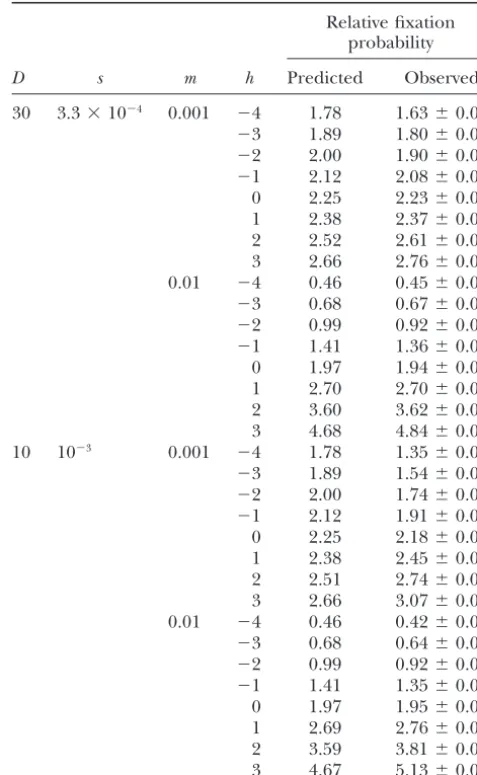
TABLE 2 TABLE 1
Predicted and observed fixation probabilities for Fixation probabilities for various numbers of demes
N⫽D⫽100 ands⫽3⫻10⫺4ors⫽10⫺3
Relative fixation probability Relative fixation probability
D s m h Predicted Observed
s m h Predicted Observed
30 3.3⫻10⫺4 0.001 ⫺4 1.78 1.63⫾0.02
3⫻10⫺4 0.001 ⫺4 3.24 3.03⫾0.03
⫺3 1.89 1.80⫾0.02
⫺3 3.76 3.50⫾0.03
⫺2 2.00 1.90⫾0.02
⫺2 4.34 4.13⫾0.03
⫺1 2.12 2.08⫾0.02
⫺1 4.97 4.76⫾0.05
0 2.25 2.23⫾0.03
0 5.65 5.59⫾0.07
1 2.38 2.37⫾0.03
1 6.39 6.26⫾0.08
2 2.52 2.61⫾0.03
2 7.17 7.34⫾0.09
3 2.66 2.76⫾0.03
3 7.99 8.30⫾0.09
0.01 ⫺4 0.46 0.45⫾0.01
0.01 ⫺4 0.05 0.05⫾0.001
⫺3 0.68 0.67⫾0.01
⫺3 0.18 0.18⫾0.003
⫺2 0.99 0.92⫾0.02
⫺2 0.60 0.59⫾0.01
⫺1 1.41 1.36⫾0.02
⫺1 1.73 1.69⫾0.02
0 1.97 1.94⫾0.02
0 4.19 4.10⫾0.03
1 2.70 2.70⫾0.03
1 8.20 8.16⫾0.09
2 3.60 3.62⫾0.03
2 13.37 13.51⫾0.12
3 4.68 4.84⫾0.04
3 19.09 19.59⫾0.14
10 10⫺3 0.001 ⫺4 1.78 1.35⫾0.01
10⫺3 0.001 ⫺4 7.10 6.26⫾0.08
⫺3 1.89 1.54⫾0.01
⫺3 9.53 8.24⫾0.09
⫺2 2.00 1.74⫾0.01
⫺2 12.26 10.79⫾0.10
⫺1 2.12 1.91⫾0.01
⫺1 15.22 14.14⫾0.12
0 2.25 2.18⫾0.01
0 18.36 17.64⫾0.13
1 2.38 2.45⫾0.02
1 21.63 21.92⫾0.15
2 2.51 2.74⫾0.02
3 28.39 33.20⫾0.18
3 2.66 3.07⫾0.02
0.01 ⫺2 0.04 0.05⫾0.002
0.01 ⫺4 0.46 0.42⫾0.01
⫺1 1.49 1.51⫾0.04
⫺3 0.68 0.64⫾0.01
0 11.55 11.14⫾0.33
⫺2 0.99 0.92⫾0.01
1 29.26 29.45⫾0.54
⫺1 1.41 1.35⫾0.01
2 48.61 51.50⫾0.23
0 1.97 1.95⫾0.01
3 68.27 75.40⫾1.22
1 2.69 2.76⫾0.02
Theoretical predictions are compared to the results of com- 2 3.59 3.81⫾0.02
puter simulations. Fixation probabilities are expressed relative 3 4.67 5.13⫾0.02
to that for a neutral allele (1/ND).
Values of swere chosen such that Nese ⬅ NDs ⫽ 1. The deme size (N) is 100 in all cases.
quency dependence. Replacement of the parameters in
this expression with the effective values derived here trajectory of allele frequency as well as the probability (Equations 7 and 8), and numerical evaluation of the of ultimate fixation.
resulting expression, yields the desired numerical pre- Table 1 presents results for larger values ofs. Fors⫽ dictions. Analogous use of results ofKimuraandOhta 3⫻10⫺4, the predictions are still close to the observed (1969, Equation 12) yields predictions of mean times values, differing by at most 7.4%. Fors⫽10⫺3, some of
to fixation. the predictions differ significantly from the simulation
Figure 1 compares theoretical predictions of fixation results for the smaller migration rate, especially at the probabilities to the results of simulations forN⫽ 100, extremes of over- and underdominance. This is to be D⫽ 100,s⫽ 10⫺4, and various values ofmandh. The
expected because the weak selection assumption (Equa-predictions are all very close to the observed values: all tions 2 and 3) is not met: forh ⫽ ⫺4, 2N(1 ⫺ h)s⫽ predictions are within 3.6% of the simulation results, ⫺1, and for h ⫽ 3, 2Nhs ⫽ 0.6, neither of which is and a majority are within 1%. The plot illustrates that very small in magnitude compared to 1. Even at these the theory captures the effects of both the degree of extremes, however, the predictions come within 16% dominance and the migration rate on the probability of the observed values. For the less extreme values ofh of fixation. Furthermore, all the observed mean fixation the theoretical predictions are quite good.
Figure 2.—Fixation probabilities as func-tions of initial allele frequency. Theoretical curves for various values ofhandmare com-pared to simulation results (points), withN⫽
100, D⫽ 100, and s⫽ 10⫺4. (a) h ⫽3 and m⫽0.01 (open squares and curve), orh⫽3 andm⫽0.003 (solid triangles and curve), or
h ⫽ ⫺4 and m ⫽ 0.003 (open circles and curve), orh⫽ ⫺4 and m⫽ 0.01 (solid dia-monds and curve). (b)h⫽ ⫺15 andm⫽0.001 (solid triangles and curve),m⫽0.003 (open circles and curve), orm⫽0.01 (solid diamonds and curve).
results. With as few as 10 demes the assumption of a ties of loss also agree within 3%. Figure 2b shows results for a case of strong underdominance (h⫽ ⫺15). Results large number of demes is seriously violated. Although
many of the predictions are close to the observations, for such extreme underdominance were not given for an allele starting at a single copy because some fixation some differ from them by as much as 32%.
In the simulation results presented so far the allele probabilities would be so low that they would be difficult to estimate by simulation. For higher initial allele fre-was initially present in a single copy. Figure 2 shows
results for a range of initial allele frequencies. Figure quencies the fixation probability is much larger and can be measured more easily. Figure 2b illustrates that the 2a shows results for overdominance (h⫽3) and
under-dominance (h⫽ ⫺4) with different migration rates. All theory correctly predicts the reduced probability of fix-ation of a rare allele at high migrfix-ation rates and the of the points (simulation results) fall along the
probabili-Figure3.—Fixation probabilities for quadratic frequency dependence. Theoretical predictions (curves) are compared to simulation results (points) over a range of values of selection param-eters. In all casesk0⫽ 0, k2⫽ 0.002⫺ k1, N ⫽ 100,D⫽100, and the allele was initially present in a single copy. Results are presented for three migration rates:m ⫽0.001 (solid triangles and curve),m⫽0.003 (open circles and curve), and
m⫽0.01 (solid diamonds and curve).
estimates from simulation. Furthermore, all of the pre- drift in the population as a whole, so that selection may dicted probabilities of loss are within 5% of the simula- have a large effect on the fate of an allele without the
tion results. assumptions being violated.
The theory presented here covers any frequency de- Computer simulations confirm that the theory closely pendence described by a polynomial. In the simulations predicts fixation probabilities so long as the parameters discussed above this was a first-degree polynomial. Fig- meet the stated conditions, namely thatDis large and ure 3 compares predictions and results for cases of qua- |Nsˆ(x)|Ⰶ1 for allxbetween zero and one. As expected, dratic frequency dependence. The agreement of the when the parameter values violate these conditions the predictions with the results is excellent: all of the predic- predictions are less reliable. Nonetheless, when the con-tions are within a few percent of the simulation results ditions are moderately violated, for example, when selec-(the largest difference is 3.5%). tion and within-deme drift are of comparable strength,
the predictions are still quite good.
A special case covered by the theoretical results is that
DISCUSSION of dominance for fitness in the absence of other sources
of frequency dependence. It was shown that subdivision The theory presented here relates a subdivided
popu-in effect decreases the degree of dompopu-inance, as mea-lation with frequency-dependent selection (including
sured by the deviation of the dominance parameterh the case of dominance) to an equivalent panmictic
pop-from1⁄2, by a factor that depends only on the deme size ulation characterized by different parameters.
Subdivi-N and the migration rate m. Specifically, subdivision sion alters both the size of the equivalent panmictic
changes the effective deviation ofh from1⁄
2,he⫺1⁄2, by population (the effective population sizeNe) and the
a factor ofNm/(Nm ⫹ 1). The direction of this effect effective values of all of the parameters describing
selec-is in accord with the well-establselec-ished fact that subdivselec-ision tion. In the case of dominance, the dominance
parame-decreases the effect of dominance on fixation probabili-ter h is in effect moved toward 1⁄2 by subdivision; i.e.,
ties (Wright1940, 1941;Slatkin1981). It should be fitness is made effectively closer to additive. For
fre-noted that this effect is not simply a matter of a reduc-quency dependence described by any polynomial in
tion in the fraction of heterozygotes. If this were the allele frequency, the effective values of all of the
polyno-sole source of the effect, one would expect a factor of mial coefficients are altered by subdivision.
1⫺ Fst⫽ 2Nm/(2Nm ⫹ 1) reduction in the effect of The theoretical treatment assumed that selection was
dominance. If the same degree of inbreeding were weak in one sense, but allowed that it was strong in
achieved by, for example, brother-sister mating, while another sense. The requirement is that selection is weak
selection operated globally, then 1⫺ F would indeed compared to drift in a subpopulation,i.e., that the
prod-be the factor by which the effect of dominance was uct of deme size (N) and (marginal) selection
coeffi-modified. The model analyzed here differs from that cient is always small in magnitude compared to unity.
graphically structured finite population. I. Distribution of neutral
The diffusion approximation derived here for a finite
genes and of genes with small effect. Ann. Hum. Genet. 35:
island model completely describes the trajectory of al- 411–423.
Maruyama, T., 1972b Distribution of gene frequencies in a
geo-lele frequency over time in the presence of dominance
graphically structured population. III. Distribution of deleterious
or frequency-dependent selection. The results followed
genes and genetic correlation between different localities. Ann.
from the moments of the distribution of within-deme Hum. Genet.36:99–108.
Maruyama, T., 1972c Distribution of gene frequencies in a
geo-allele frequencies. This is a beta distribution for the
graphically structured population. II. Distribution of deleterious
island model. Under other models of subdivision this
genes and of lethal genes. Ann. Hum. Genet.35:425–432.
distribution may have a different form, but the moments Maruyama, T., 1974 A simple proof that certain quantities are
inde-pendent of the geographical structure of population. Theor.
of the distribution nonetheless characterize the
popula-Popul. Biol.5:148–154.
tion. These moments could be derived theoretically or
Maruyama, T., andM. Kimura, 1980 Genetic variability and
effec-measured empirically. So long asFstis independent of tive population size when local extinction and recolonization of subpopulations are frequent. Proc. Natl. Acad. Sci. USA77:
allele frequency and ordinary genetic drift is the only
6710–6714.
stochastic force operating, these moments can be used
Nagylaki, T., 1998 The expected number of heterozygous sites in
to relate the subdivided population to an equivalent a subdivided population. Genetics149:1599–1604.
Nei, M., andN. Takahata, 1993 Effective population size, genetic
panmictic population even in the presence of
fre-diversity, and coalescence time in subdivided populations. J. Mol.
quency-dependent selection. Evol.37:240–244.
Santiago, E., andA. Caballero, 1995 Effective size of populations I thank Christina Muirhead and Jon Wilkins for comments on the
under selection. Genetics139:1013–1030. manuscript. John Wakeley encouraged me to work on this topic.
Slatkin, M., 1977 Gene flow and genetic drift in a species subject This work was supported by National Science Foundation grant
DEB-to frequent local extinctions. Theor. Popul. Biol.12:253–262.
9815367 to John Wakeley. Slatkin, M., 1981 Fixation probabilities and fixation times in a
subdivided population. Evolution35:477–488.
Slatkin, M., 1991 Inbreeding coefficients and coalescence times. Genet. Res.58:167–175.
LITERATURE CITED Spirito, F., M. RizzoniandC. Rossi, 1993 The establishment of underdominant chromosomal rearrangements in multi-deme
sys-Cherry, J. L., andJ. Wakeley, 2003 A diffusion approximation for tems with local extinction and colonization. Theor. Popul. Biol. selection and drift in a subdivided population. Genetics163: 44:80–94.
421–428. Takahata, N., 1991 Genealogy of neutral genes and spreading of
Dobzhansky, T., andS. Wright, 1941 Genetics of natural popula- selected mutations in a geographically structured population. tions. V. Relations between mutation rate and accumulation of Genetics129:585–595.
lethals in populations of Drosophila pseudoobscura.Genetics26: Wang, J., andA. Caballero, 1999 Developments in predicting the
23–51. effective size of subdivided populations. Heredity82:212–226.
Kimura, M., 1957 Some problems of stochastic processes in genetics. Whitlock, M. C., andN. H. Barton, 1997 The effective size of a
Ann. Math. Stat.28:882–901. subdivided population. Genetics146:427–441.
Kimura, M., andT. Ohta, 1969 The average number of generations Wright, S., 1931 Evolution in Mendelian populations. Genetics16: until fixation of a mutant gene in a finite population. Genetics 97–159.
61:763–771. Wright, S., 1939 Actualites Scientifiques et Industrielles 802: Exposes de
Lande, R., 1985 The fixation of chromosomal rearrangements in a Biometrie et de la Statistique Biologique XIII. Hermann et Cie, Paris. subdivided population with local extinction and colonization. Wright, S., 1940 Breeding structure of populations in relation to
Heredity54(3): 323–332. speciation. Am. Nat.74:232–248.
Maruyama, T., 1970a Effective number of alleles in a subdivided Wright, S., 1941 On the probability of fixation of reciprocal translo-population. Theor. Popul. Biol.1:273–306. cations. Am. Nat.75:513–522.
Maruyama, T., 1970b On the fixation probability of mutant genes Wright, S., 1943 Isolation by distance. Genetics28:114–138. in a subdivided population. Genet. Res.15:221–225.