DOI: 10.1534/genetics.105.054502
Estimating the Contribution of Mutation, Recombination and Gene
Conversion in the Generation of Haplotypic Diversity
Peter L. Morrell, Donna M. Toleno, Karen E. Lundy and Michael T. Clegg
1Department of Ecology and Evolutionary Biology, University of California, Irvine, California 92697 Manuscript received December 16, 2005
Accepted for publication April 11, 2006
ABSTRACT
Recombination occurs through both homologous crossing over and homologous gene conversion during meiosis. The contribution of recombination relative to mutation is expected to be dramatically reduced in inbreeding organisms. We report coalescent-based estimates of the recombination parameter (r) relative to estimates of the mutation parameter (u) for 18 genes from the highly self-fertilizing grass, wild barley, Hordeum vulgaressp. spontaneum. Estimates ofr/uare much greater than expected, with a mean ˆr/ˆu1.5, similar to estimates from outcrossing species. We also estimate ˆrwith and without the contribution of gene conversion. Genotyping errors can mimic the effect of gene conversion, upwardly biasing estimates of the role of conversion. Thus we report a novel method for identifying genotyping errors in nucleotide sequence data sets. We show that there is evidence for gene conversion in many large nucleotide sequence data sets including our data that have been purged of all detectable sequencing errors and in data sets fromDrosophila melanogaster,D. simulans, andZea mays. In total, 13 of 27 loci show evidence of gene conversion. For these loci, gene conversion is estimated to contribute an average of twice as much as crossing over to total recombination.
T
HERE are two sources of genetic diversity, mutation and recombination. Mutation, broadly defined here as novel heritable change in nucleotide state, in-troduces new variants while recombination reassorts the variants along a chromosome into novel combina-tions or haplotypes. Recombination can occur through both homologous crossover and homologous (intra-locus) gene conversion, processes that occur as part of meiosis in diploid (or higher ploidy) organisms (Wiuf and Hein 2000). Under the Holliday junction model (Holliday 1964), homologous gene conversion is thought to occur when only a short tract of the al-ternate chromosome (usually a few hundred base pairs) is incorporated during meiotic exchange (e.g., Stahl 1994).Inbreeding dramatically reduces the role of recom-bination. Recurrent inbreeding can rapidly increase homozygosity; the recombination process continues to exchange chromosomal segments during gamete forma-tion but with little effective recombinaforma-tion of mutaforma-tions. Thus the primary impact of inbreeding is expected to be a reduction of the contribution of recombination, relative to mutation, to total genetic diversity.
Under coalescent theory and assuming a standard neutral model, the impact of inbreeding can be mea-sured as a reduction in the ratio of the recombination
parameterrto the mutation parameteru,i.e.,r/u(where r ¼ 4Ner and u ¼4Nemand where Ne is the effective
population size,ris the rate of recombination, andmis the rate of mutation) (symbols used are listed in Table 1). It is predicted that bothranduare reduced by in-breeding, but the impact on recombination is expected to be much greater (Nordborg 2000). Nordborg (2000) showed thatris predicted to be reduced under partial self-fertilization based on the relationship rs¼
r(1s), wheresis the selfing rate;uwill be affected as us ¼ u/(1 1 (s/(2 s))). As inbreeding approaches
maximal values,i.e., 98–99%, the value ofris reduced by 40- to 50-fold, whileuis reduced by only 2-fold relative to that expected under outcrossing.
The relative roles of gene conversion and crossing over are important because they influence the degree of the association among segregating sites, particularly at the intragenic level. The gene conversion process results in the exchange of small tracts of a chromosome, creat-ing a mosaic sequence. At the population level, gene conversion interrupts linkage disequilibrium (LD, the association among segregating sites) in a very localized manner while long-distance LD remains largely un-affected (Andolfattoand Nordborg1998). This can result in a reduction in LD among closely linked markers, while flanking markers remain in complete association. Thus the relative role of gene conversion is a topic of considerable practical importance. For example, the den-sity of the mapped polymorphic sites needed for disease association studies in humans and for marker-assisted 1Corresponding author:Department of Ecology and Evolutionary Biology,
321 Steinhaus Hall, University of California, Irvine, CA 92697. E-mail: [email protected]
selection in crops and domesticated animals is depen-dent on the degree to which extrapolations from larger-scale estimates of LD predict the degree of association between genetic markers and causative mutations (Ptak
et al. 2004).
We focus on the impact of recombination in wild barley (Hordeum vulgaressp. spontaneum), a species with an estimated selfing rate of 98.4% (Brownet al. 1978). We estimate the relative contribution of recombination and mutation (r/u) on the basis of nucleotide sequence-level diversity. We also examine the relative contribu-tions of gene conversion and crossing over to estimated levels of recombination.
There are a number of methods for estimation of the recombination parameter (r) from nucleotide sequence polymorphism data. Most methods rely on a standard model of recombination that includes the assumptions that recombination results from homologous crossover
events during normal meiosis and that the recombina-tion rate per base pair is constant with the probability of recombination proportional to the distance between sites. For the majority of estimators the population his-tory is assumed to conform to a coalescent model with recombination (Hudson1990; Griffithsand Marjoram 1996). Many methods assume that samples are drawn from a large and panmictic population of constant size, evolving under neutrality (reviewed in Fearnheadand Donnelly 2002; Stumpf and McVean 2003). The infinite-sites model of mutation is also often assumed (each mutation affects a unique site).
Estimation of the population recombination param-eterr¼4Neris challenging. When based on nucleotide
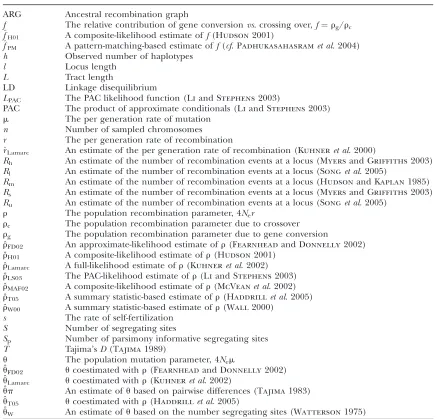
sequence polymorphism, the estimated value is always a product of the effective population size and rate of recombination. Methods for estimating r from nu-cleotide sequence include product moment estimators TABLE 1
Symbols and abbreviations used
ARG Ancestral recombination graph
f The relative contribution of gene conversionvs. crossing over,f¼rg/rc
^
fH01 A composite-likelihood estimate off(Hudson2001) ^
fPM A pattern-matching-based estimate off(cf. Padhukasahasramet al. 2004) h Observed number of haplotypes
l Locus length L Tract length
LD Linkage disequilibrium
LPAC The PAC likelihood function (Liand Stephens2003)
PAC The product of approximate conditionals (Liand Stephens2003)
m The per generation rate of mutation n Number of sampled chromosomes r The per generation rate of recombination
^
rLamarc An estimate of the per generation rate of recombination (Kuhneret al. 2000)
Rh An estimate of the number of recombination events at a locus (Myersand Griffiths2003)
Rl An estimate of the number of recombination events at a locus (Songet al. 2005)
Rm An estimate of the number of recombination events at a locus (Hudsonand Kaplan1985)
Rs An estimate of the number of recombination events at a locus (Myersand Griffiths2003)
Ru An estimate of the number of recombination events at a locus (Songet al. 2005)
r The population recombination parameter, 4Ner
rc The population recombination parameter due to crossover rg The population recombination parameter due to gene conversion ˆ
rFD02 An approximate-likelihood estimate ofr(Fearnheadand Donnelly2002)
ˆ
rH01 A composite-likelihood estimate ofr(Hudson2001)
ˆ
rLamarc A full-likelihood estimate ofr(Kuhneret al. 2002)
ˆ
rLS03 The PAC-likelihood estimate ofr(Liand Stephens2003)
ˆ
rMAF02 A composite-likelihood estimate ofr(McVeanet al. 2002)
ˆ
rT05 A summary statistic-based estimate ofr(Haddrillet al. 2005)
ˆ
rW00 A summary statistic-based estimate ofr(Wall2000)
s The rate of self-fertilization S Number of segregating sites
Sp Number of parsimony informative segregating sites T Tajima’sD(Tajima1989)
u The population mutation parameter, 4Nem
ˆ
uFD02 ucoestimated withr(Fearnheadand Donnelly2002)
ˆ
uLamarc ucoestimated withr(Kuhneret al. 2002)
ˆ
up An estimate ofubased on pairwise differences (Tajima1983)
ˆ
uT05 ucoestimated withr(Haddrillet al. 2005)
ˆ
(Hudson1987; Heyand Wakeley1997), ‘‘composite-likelihood’’ methods that result from a product of coa-lescent likelihoods for a series of two-site or three-site configurations (Hudson2001; Wall2004), ‘‘approximate-likelihood’’ methods that combine summary statistics from the data with estimated histories with recombi-nation (Wall 2000), and ‘‘full-likelihood’’ methods (Griffithsand Marjoram1996; Kuhner et al. 2000) that attempt to fit parameter estimates to the estimated underlying coalescent history with recombination (re-viewed in Stumpfand McVean2003).
We also estimate the relative contribution of gene con-version (rg) and crossing over (rc) to total
recombina-tion (f¼rg/rc) (Frisseet al. 2001), using a composite-likelihood estimator (Hudson2001) and a method that matches patterns of nucleotide sites with coalescent simulations of gene conversion (Padhukasahasram
et al. 2004). We compare these methods using an em-pirical data set from 18 loci sequenced from a common sample of 25 wild barley accessions (Morrell et al. 2005) and population genetic data sets fromZea mays
(maize), Drosophila melanogaster, D. pseudoobscura, and
D. simulans.
METHODS
Sequence data:Sequence diversity from 18 loci for 25 wild barley individuals from across the species’ range has been reported previously (Cummings and Clegg 1998; Linet al. 2001, 2002; Morrellet al. 2003, 2005). The sequences are fully resolved haplotypes with a minimum quality criterion of a phred score $20 for both the forward and the reverse strands. Singleton mutations were confirmed through a second PCR am-plification and resequencing of both the forward and the reverse strands. The total data set includes 678 seg-regating sites, 420 of which are parsimony informative. Five sites (0.74%) have more than two nucleotide states; there are 4 sites with three nucleotide states and a single site with four states. Detailed methods for sequencing and sequence assembly are included in Morrellet al. (2003). Diversity statistics and the levels of LD within and between loci are reported in Morrellet al. (2005). Two abutting portions of thePepclocus were sequenced separately (Morrell et al. 2003, 2005), but in a com-bined length of 3173 bp contain only four parsimony-informative segregating sites and are treated here as a single locus, referred to asPepcC.
In addition to data from the wild barley loci, we have analyzed additional nucleotide sequence data sets to as-sess the relative role and extent of evidence for gene conversion.
Estimates of the role of recombination, particularly the relative role of gene conversion, depend on sam-pling a relatively large number of segregating sites. To infer the role of gene conversion using the pattern-matching methods of Padhukasahasramet al. (2004)
we focus on published nucleotide sequence data sets $1000 bp aligned length, with$20 sampled chromo-somes and$20 parsimony-informative segregating sites, at least two detected recombination events (see below), and minimal missing data. Data from seven of the wild barley loci we have sequenced meet these criteria. We also considered sequence data from all of the 98D. mela-nogaster loci compiled into a single list by Presgraves (2005). This resulted in inclusion of data from 10 loci from multiple populations of D. melanogaster (Begun and Aquadro1995; Harret al. 2002; Zurovcovaand Ayala 2002; Riley et al. 2003; Balakirev and Ayala 2004a,b; DuMontet al. 2004), 1 locus from multiple pop-ulations ofD. pseudoobscura(Schaefferand Miller1992), 2 loci from multiple populations ofD. simulans(DuMont
et al. 2004), 4 loci from cultivated maize (Tenaillonet al. 2001), 1 locus from both maize and its wild progenitor teosinte (Z. maysssp.maysand ssp.parviglumis) (Bomblies and Doebley2005), and 3 loci from a separate sample of wild barley (Caldwellet al. 2005). Descriptive statistics for all sampled loci are in Table 2.
Estimating the number of recombination events:To estimate the number of recombination events in a data set, we employed five estimators that vary in the algo-rithm they use to detect recombination. The estimators
Rm, Rh, Rs, Rl, and Ru were calculated using the
pro-grams RecMin (Myers and Griffiths 2003) (to esti-mateRm,Rh, andRs), HapBound (to estimateRl), and
shrub (to estimateRu) (Songet al. 2005) (see supplemen-tal material at http://www.genetics.org/supplemensupplemen-tal/ for links to all software used). The estimators use dis-tinct methods for calculating a minimum number of recombination events for a data set and are related such thatRm#Rh#Rs#Rl#Ru(Songet al. 2005). TheRm
estimate is based on the four-gamete test. For any pair of nucleotide sites, only three configurations (represented in binary form as 00, 01, 10) are possible on the basis of unique mutations (Hudson and Kaplan 1985). Pro-ducing all four possible gametic combinations requires either recombination or a second mutation of one of the nucleotide sites. When the probability of recurrent mutation is low (i.e., the data are consistent with the infinite-sites model) algorithms can be used to process the results of the four-gamete tests and provide the minimum number of nonoverlapping intervals involved in recombination. Rhis calculated on the basis of the
difference (hS1) between the number of observed haplotypes (h) in the sample and the number of segre-gating sites (S). Rs uses a simplified approximation of
the sample history such that any true history of the data would include a larger number of recombination events.
RlandRuare lower and upper bounds on the minimum
number of recombination events required to reconstruct an evolutionary history compatible with the sequence.
Ruis computed relative to an ancestral recombination
segregating sites from the nucleotide sequence data set encoded as binary characters. In this study, the minor allele state was represented as 1 and the majority allele as 0. RecMin input can include sites with missing data; thus we have treated as missing the third state at sites with
more than two nucleotide states and segregating sites within indels. These sites must be excluded in Hap-Bound and shrub input. Haplotype configurations for 18 wild barley loci for all parsimony-informative sites are presented in Morrellet al. (2005).
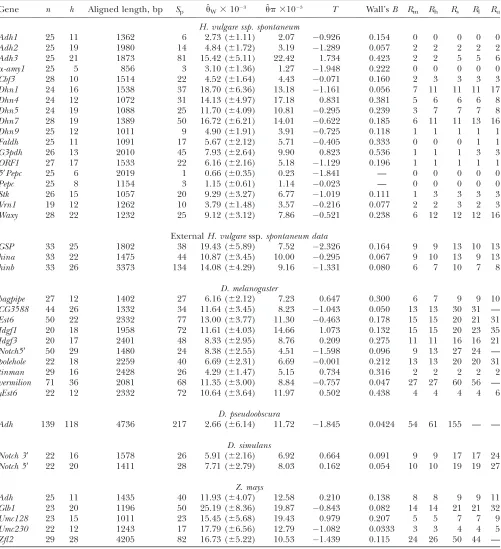
TABLE 2
Descriptive statistics and estimates of nucleotide sequence diversity for a common set of 25 samples at 18 loci in wild barley
Gene n h Aligned length, bp Sp uˆW3103 upˆ 3103 T Wall’sB Rm Rh Rs Rl Ru
H. vulgare ssp. spontaneum
Adh1 25 11 1362 6 2.73 (61.11) 2.07 0.926 0.154 0 0 0 0 0 Adh2 25 19 1980 14 4.84 (61.72) 3.19 1.289 0.057 2 2 2 2 2 Adh3 25 21 1873 81 15.42 (65.11) 22.42 1.734 0.423 2 2 5 5 6
a-amy1 25 5 856 3 3.10 (61.36) 1.27 1.948 0.222 0 0 0 0 0
Cbf3 28 10 1514 22 4.52 (61.64) 4.43 0.071 0.160 2 3 3 3 3 Dhn1 24 16 1538 37 18.70 (66.36) 13.18 1.161 0.056 7 11 11 11 17 Dhn4 24 12 1072 31 14.13 (64.97) 17.18 0.831 0.381 5 6 6 6 8 Dhn5 24 19 1088 25 11.70 (64.09) 10.81 0.295 0.239 3 7 7 7 8 Dhn7 28 19 1389 50 16.72 (66.21) 14.01 0.622 0.185 6 11 11 13 16 Dhn9 25 12 1011 9 4.90 (61.91) 3.91 0.725 0.118 1 1 1 1 1
Faldh 25 11 1091 17 5.67 (62.12) 5.71 0.405 0.333 0 0 0 1 1
G3pdh 26 13 2010 45 7.93 (62.64) 9.90 0.823 0.536 1 1 1 3 3
ORF1 27 17 1533 22 6.16 (62.16) 5.18 1.129 0.196 1 1 1 1 1
59Pepc 25 6 2019 1 0.66 (60.35) 0.23 1.841 — 0 0 0 0 0
Pepc 25 8 1154 3 1.15 (60.61) 1.14 0.023 — 0 0 0 0 0
Stk 26 15 1057 20 9.29 (63.27) 6.77 1.019 0.111 1 3 3 3 3 Vrn1 19 12 1262 10 3.79 (61.48) 3.57 0.216 0.077 2 2 3 2 3 Waxy 28 22 1232 25 9.12 (63.12) 7.86 0.521 0.238 6 12 12 12 16
ExternalH. vulgaressp.spontaneum data
GSP 33 25 1802 38 19.43 (65.89) 7.52 2.326 0.164 9 9 13 10 13 hina 33 22 1475 44 10.87 (63.45) 10.00 0.295 0.067 9 10 13 9 13 hinb 33 26 3373 134 14.08 (64.29) 9.16 1.331 0.080 6 7 10 7 8
D. melanogaster
bagpipe 27 12 1402 27 6.16 (62.12) 7.23 0.647 0.300 6 7 9 9 10
CG3588 44 26 1332 34 11.64 (63.45) 8.23 1.043 0.050 13 13 30 31 —
Est6 50 22 2332 77 13.00 (63.77) 11.30 0.463 0.178 15 15 20 21 31
Idgf1 20 18 1958 72 11.61 (64.03) 14.66 1.073 0.132 15 15 20 23 35
Idgf3 20 17 2401 48 8.33 (62.95) 8.76 0.209 0.275 11 11 16 16 21
Notch59 50 29 1480 24 8.38 (62.55) 4.51 1.598 0.096 9 13 27 24 —
polehole 22 18 2259 40 6.69 (62.31) 6.69 0.001 0.212 13 13 20 20 31
tinman 29 16 2428 26 4.29 (61.47) 5.15 0.734 0.316 2 2 2 2 2
vermilion 71 36 2081 68 11.35 (63.00) 8.84 0.757 0.047 27 27 60 56 —
yEst6 22 12 2332 72 10.64 (63.64) 11.97 0.502 0.438 4 4 4 4 6
D. pseudoobscura
Adh 139 118 4736 217 2.66 (66.14) 11.72 1.845 0.0424 54 61 155 — —
D. simulans
Notch 39 22 16 1578 26 5.91 (62.16) 6.92 0.664 0.091 9 9 17 17 24
Notch 59 22 20 1411 28 7.71 (62.79) 8.03 0.162 0.054 10 10 19 19 27
Z. mays
Adh 25 11 1435 40 11.93 (64.07) 12.58 0.210 0.138 8 8 9 9 11 Glb1 23 20 1196 50 25.19 (68.36) 19.87 0.843 0.082 14 14 21 21 32
Umc128 23 15 1011 23 15.45 (65.68) 19.43 0.979 0.207 5 5 7 7 9
Umc230 22 12 1243 17 17.79 (66.56) 12.79 1.082 0.0333 3 3 4 4 5
Zfl2 29 28 4205 82 16.73 (65.22) 10.53 1.439 0.115 24 26 50 44 —
Estimating the population recombination rate: The methods discussed above focus on the number of recom-bination events observable within a sequenced region. Parameterizing recombination in terms of r ¼ 4Ner
permits an evaluation of the per base pair input of re-combination, in terms of the rearranging of mutations, throughout the coalescent history of the sampled popu-lation. Parametric estimates of r also provide a useful comparison to estimates of u ¼4Nemin that they
de-scribe the relative importance of recombination and mutation in the history of the organism.
Estimates ofrfor each locus in our wild barley data set were calculated using seven different estimators. This permits a comparison of estimators using a common set of samples across a set of loci with very different numbers of informative mutations and recombination events (Table 2). Thus we briefly examine the utility of estimators across loci and the variance among estima-tors for each sampled locus.
We used the programs maxhap and LDHat for the composite-likelihood-based estimates ˆrH01 (Hudson
2001) and ˆrMAF02 (McVeanet al. 2002), mss_conv for
the summary-statistic-likelihood estimate ˆrW00 (Wall
2000), rhothetapost for a summary-statistic-based Bayes-ian estimator with rejection-sampling algorithm for ˆrT05
(Haddrillet al. 2005), rholike and sequenceLD for the approximate- or ‘‘marginal’’-likelihood estimates ˆrLS03
(Li and Stephens2003), and ˆrFD02 (Fearnhead and Donnelly 2002) and Lamarc for the full-likelihood estimate ˆrLamarc (Kuhner et al. 2000, 2002). Because low-frequency mutations necessarily occur in only a minimal number of haplotype configurations, they are less informative as to the extent of recombination. In this study, for methods that apply a frequency filter, only mutations that occurred at least twice in the sample (i.e., those that are ‘‘parsimony informative’’) are considered. A number of methods permit the use of either an infinite-sites model or a specific nucleotide substitution model. All analyses reported here have assumed an infinite-sites model unless otherwise specified.
The composite-likelihood estimator ˆrH01of Hudson (2001) considers the frequency of each of the two-site haplotypes (00, 01, 10, 11) for each pair of sites. The method uses a simulation of the neutral coalescent to identify values ofr compatible with the observed fre-quencies for pairs of sites. The composite likelihood is the product of the likelihoods for each r-value across pairs of sites. We have used lookup tables where likeli-hood values have been precalculated (Hudson2001) (see supplemental material at http://www.genetics. org/supplemental/). The maxhap software, used for composite-likelihood estimation, can estimate ˆr with or without a simultaneous estimate of ^f, the relative contribution of gene conversion.
The composite-likelihood method ˆrMAF02of McVean
et al. (2002) differs from the Hudson(2001) method in that likelihood tables are generated using the sample
size and values ofu that match estimates for the locus being evaluated, rather than a grid ofr-values for a given sample size. We have generated likelihood tables on the basis of Watterson’s (1975)u-estimate (ˆuW) for each locus as this approach may improve the accuracy of the composite-likelihood method (McVeanet al. 2002).
The summary statistic method ˆrW00of Wall(2000)
uses a simulation of the neutral coalescent process to find a value of r that maximizes the proportion of simulations that match the observed number of hap-lotypes (h) and the number of recombination events (Rm) in a chromosomal segment from a sample of
individuals. Inputs into the simulation include the num-ber of segregating sites (S), the length of the region (l), and the number of chromosomes sampled (n). For a diploid, outcrossing organism, n is two times the number of individuals sampled. For wild barley, which is .98% self-fertilizing, the sample more closely ap-proximates a haploid sample, and thus we treatnas the actual number of unique sequences observed at each locus. This number can slightly exceed the 25 individ-uals sampled due to occasional heterozygous individu-als in the sample (Morrellet al. 2005).
The summary statistic method ˆrT05 of Thornton
(Haddrill et al. 2005; Thornton and Andolfatto 2006) combines the summary of the data used by Wall (2000) and theRhrelationship described above (Myers and Griffiths 2003) with a rejection-sampling algo-rithm to produce a series of independent, joint esti-mates of ˆrand ˆu. The method provides a simple means to estimate confidence intervals for ˆr, ˆu, and ˆr/ˆu (Haddrillet al. 2005). We plotted the estimated pos-terior distribution of ˆrand ˆufrom an initial round of analysis for each locus to assure that posterior estimates were not bounded by the priors. When the distribution of posterior values appeared to be constrained by the priors, priors were adjusted to avoid problems with the boundary and the analysis was rerun. Priors for the sec-ond round were the 0.01 and 0.99 percentile values of the estimated posterior distribution from the initial round. Point estimates used to summarize the poste-rior distributions of ˆrT05and ˆuT05are the maximum a
posterioriestimates and confidence intervals are defined by the 0.025 and 0.975 percentiles.
The approximate-likelihood method ˆrFD02of F earn-head and Donnelly (2002) uses a list of observed haplotype configurations [defined by parsimony-infor-mative (nonsingleton) sites (Sp)] withlandnfor each
locus to produce a joint estimate of ˆrFD02and ˆuFD02. As
was calculated on the basis of 251 values of r and 3 values ofu.
The conditional probabilities method ˆrLS03of Liand
Stephens (2003) is based on a model of linkage dis-equilibrium where the probability of observing a partic-ular set of haplotypes is evaluated across values ofr. The conditional probabilities represent the probability of observing each haplotype, given all previously observed haplotypes and given a r-value. The method of esti-mation is referred to as ‘‘product of approximate con-ditionals’’ (PAC) likelihood. Because the order of the observed haplotypes is important,LPACis averaged over
several random orders of the haplotypes (we used the default of 10 random orders). The method does not assume an infinite-sites mutation model. The approxi-mate conditional probabilities consider haplotypes as a unit, differing from the composite-likelihood method in which sites are considered on a pairwise basis.
Kuhner’s full-likelihood method ˆrLamarcimplemented
in Lamarc (Kuhner et al. 2000, 2002) estimates coa-lescent histories with recombination compatible with input data and then estimates parameter values com-patible with the genealogy. We used as input full-length sequence alignments, treating all samples for each locus as a single population, and estimated ˆuLamarcand
^rLamarc, the per generation rate of recombination, for
each locus. Program setup and search strategy are sim-ilar to that reported in Morrellet al. (2003), including the use of the Felsenstein 1984 nucleotide substitution model (Kishinoand Hasegawa1989; Swoffordet al. 1996) (rather than an infinite-sites model) and empir-ical base frequencies and transition/transversion ratios. Results of an initial analysis using ˆuWand^rLamarc¼0.5 were
used as starting values of a second round of analysis with 20 initial chains of 1000 and four final chains of 20,000 genealogies with 2000 genealogies discarded per chain. Adaptive heating was used to improve the search of parameter space. Finally, start parameters from the second-round analysis were plugged into a third round of analysis. Results of the third-round analysis are reported.
Estimating the role of gene conversion: Estimating gene conversion from nucleotide sequence data is dif-ficult in part because estimation involves four unknowns, u,r,f(the proportion of gene conversion events relative to crossover events), andL(the conversion tract length) (Ptaket al. 2004). Two primary methods of estimating the parameterf have been reported: one method jointly estimatesrandfusing an extension of the composite-likelihood approach (Frisseet al. 2001; Hudson2001; Wall 2004); a second method matches patterns of nucleotide sites that show evidence of recombination with values of r and f using coalescent simulations (Padhukasahasram et al. 2004), referred to here as
^
fPM. Previous studies have emphasized that because the
distance among sampled loci almost always exceeds likely conversion tract length, the relative roles of gene
conversion and crossover can be inferred subtractively from multilocus data (Andolfatto and Nordborg 1998; Ptaket al. 2004; Wall2004; Plagnolet al. 2006). However, genotyping errors tend to upwardly bias ^f, causing an overestimate of the role of gene conversion (Ptaket al. 2004; Wall2004), and the issue of typing errors is not remedied by multilocus estimation of f. Thus our focus is on inferring the role of gene conver-sion within individual loci and, when possible, utilizing data that has been rigorously purged of all detectable genotyping errors.
The composite-likelihood estimator program max-hap uses a lookup table that permits rapid estimation of r andf. However, composite-likelihood estimators can have a high root mean square error (Wall2004; Smith and Fearnhead2005). We estimate ˆrH01and^fH01for all sampled loci using maxhap. We also explore the utility of maxhap estimates using coalescent simulations with parameter estimates based on the wild barley empirical data. Specifically, we asked, what is the minimum con-tribution of gene conversion (or the minimum value of
f.0) that can be detected with the two-site composite-likelihood method with 95% confidence? We then asked, when simulations are generated without any gene conversion, what is the probability of estimating
^
fH01 . 0? The simulations were performed across
a dense grid of values, with 10,000 replications per grid point with simulation output sent directly to the composite-likelihood estimator software maxhap through the mstoexhap (Thornton2003) and exhap utilities. Sample size, the length of regions simulated, and pa-rameter values used in the simulation were chosen to reflect mean values from the wild barley empirical data; thus, simulations were based onl ¼1500 bp of sequence fromn¼25 individuals, withu¼83103/bp,
and r ¼ 8 3 103/bp for simulations with no gene
conversion and then withrdecreased in proportion to increasing values of f, withf from 0.01 to 7 with nine values between 0 and 2 and thereafter increasing by increments of 0.5. For the simulations without gene conversion we used a grid ofr-values that spanned the range of empirical values estimated from the wild bar-ley loci,i.e.,rfrom 0 to 0.032 (including 0.0001, 0.0002, and then increasing from 0.001 by a factor of 2), using tract lengthsL¼250 and 500 bp.
sites A, B, C, and D (Figure 1). For four-site config-urations, ‘‘patternb’’ and ‘‘patternd’’ were defined. In patternb, both the outer pair of sites (A and D) and the inner pair of sites (B and C) are incompatible (all four pairwise states are present). In patterndthe outer pair of sites (A and D) and the inner pair of sites (B and C) are compatible pairs, but there is incompatibility between the two outer sites and their corresponding adjacent inner site (A and B, C and D). Both patternsa
and d imply that either a gene conversion event or a double recombination has effectively replaced a tract of the chromosome that included the internal site(s).
The proportions of patterns a,b, andd for the em-pirical data were considered by comparing them to those observed in coalescent simulations. Simulated data re-flecting n, S, and l from the empirical data for each locus were generated using the program ms (Hudson 2002). WithSused as a proxy foruand tract lengths (L) held constant, simulations can explore a grid ofr- and
f-values. Initial values ofr andfwithin the simulations were based on estimates from the Hudson(2001) two-site likelihood method described above; values ofL¼250 and 500 were used. These values bracket the estimate of
L¼352 fromD. melanogaster(Hillikeret al. 1994). Coalescent simulations with proportions of patterns
a,b, anddwithin 20% of that observed in the empirical data were accepted; the proportion of accepted simu-lations for each set of simulation parameters was then determined for patterna and for simultaneous accep-tance based on both patternsbandd. The product of these two proportions is referred to as the likelihood of the given simulation parameters.
All analyses were performed using single nodes of the Linux cluster at the Bioinformatics Core facility at the University of California, Riverside.
Genotyping errors and gene conversion: Because triplets and quadruplets in patternsaanddare based on the incompatibility of the internal site or sites with flanking sequence, genotyping errors can generate the same pattern as a conversion event. Base call errors, particularly those arising from the failure to detect heterozygous sites within an individual, can potentially be identified by examining the frequency of each of the
haplotypic classes (00, 01, 10, 11) for the site AB and BC comparisons in triplets of sites (seeresults).
RESULTS
Genotyping errors: Examination of the triplets of nucleotide sites inferred from our wild barley nucleo-tide sequence data demonstrated that for some loci, a relatively small number of segregating sites and a rela-tively small number of individuals from each sequenc-ing panel contributed the majority of patternatriplets. For each of the outer to inner site comparisons (i.e., sites AB and BC) in a triplet, the rarest of haplotypic classes is the most direct single source of typing error. Samples that are heterozygous at a locus but are incorrectly represented as a single haplotype can result in triplets and quadruplets of sites that mimic the effects of gene conversion or double crossover and thus represent a problematic source of typing error. In a manner anal-ogous to error detection in genetic mapping algorithms (Lincoln and Lander 1992) examination of site fre-quencies between pairs of sites can identify individual samples and nucleotide sites that lead to the inference of double crossover events. Correcting typing errors can dramatically improve recombination rate estimates (Lincolnand Lander1992).
For the 18 wild barley loci in Morrellet al. (2005), original sequence traces were available for reexamina-tion. Base calls at each site in each sequence that contributed the rarest gametic class (e.g., 01) for the outer sites in each triplet were reexamined. All sites in the panel had been sequenced with a minimum phred quality of$20 for forward and reverse sequence reads. For the vast majority of sites, the base calls from the original data set submitted to GenBank were confirmed and thus the triplet was accepted as valid. For example, all triplets at theDhn4locus involve a segregating site at bp 114. The critical two-site haplotype occurs in sample 06 (GenBank no. AY895883). All quadruplets forDhn4
include bp 992 as the last segregating site in the quadruplet, on the basis of a gametic type again found only in sample 06. Thus in a manner similar to the handling of singleton confirmation in population ge-netic studies, this sample was reamplified and rese-quenced using all available primers on both the forward and reverse strands; the original nucleotide states at both of the sites were confirmed, and base calls for sites segregating within the population did not indicate the presence of more than one allele (i.e., there is no evi-dence that the individual was a heterozygote at this locus). The targeted examination of base calls (in the original trace files) that contributed the least frequent gametic class for patterna triplets at other wild barley loci revealed heterozygous individuals that were not previously detected by screening with PolyPhred or by visual inspection. Heterozygous individuals were identified at five loci including samples 04 and 28 at Figure1.—Patternsa,b, andddepend on the absence of
Cbf3, 28 atDhn1, 12 atDhn5, 36 atDhn7, and 12 atWaxy
(see Table 3). The phase of mutations was resolved experimentally, using a combination of cloning and allele-specific PCR. Examination of the sequence traces from individuals that were newly detected as hetero-zygotes at a locus revealed that many of the base calls at segregating sites that differentiate the two parental chromosomes did not show equal amplification of the PCR products from each chromosome. Several sequenc-ing primers produced sequence reads from the PCR product of only one of the two parental chromosomes. Unequal amplification of initial PCR products was also evident; clones ofWaxysample 12 were biased 15:1 for one of the parental haplotypes. The two haplotypes at
Waxysample 12 were ultimately confirmed on the ba-sis of the direct sequencing of the products of allele-specific PCR.
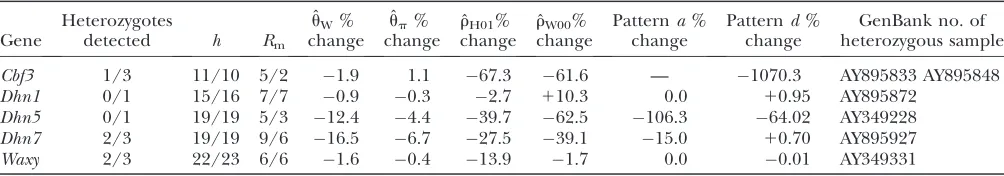
In general, the resolution of heterozygotes reduced the evidence for recombination in the data sets (Table 3). For example, forDhn7this resulted in a change from
Rm¼9 in the original data set to anRm¼6 after error
checking and experimental resolution of haplotypes. Estimates ofufor the locus were reduced slightly, with a reduction of 16.5% for ˆuWand 6.7% for ˆup. Estimates of
ˆ
rshowed a more dramatic decrease with ˆrH01reduced by 27.5% and ˆrW00reduced by 39.19%. Experimental resolution of typing errors also tends to reduce the pro-portions of patternsa,b, anddin the data set (see Table 3). In the extreme case, the originalCbf3data set had 1.4% of possible triplets in patterna, but with errors in phasing corrected for three heterozygotes, no pattern
atriplets were present.
Recombination events: All but four wild barley loci (Adh1,a-Amy1,Faldh, andPepcC) show evidence of re-combination on the basis of the four-gamete test (Hudson and Kaplan1985);i.e., Rm. 0. In loci where recom-bination was detected,Rmvaries from 1 to 7, with the
largest number of recombination events evident in
Dhn1,Dhn7, andWaxy(Table 2). For the four loci where
Rm¼0, theRhandRsestimates also did not show any
evidence of recombination. Rl and Ru also report no
evidence of recombination in loci withRm¼0 with one
exception, theFaldhlocus, whereRlandRu¼1. For loci
withRm.0, bothRhandRsranged from 1 to 12 (Table
2). Values ofRlfor wild barley ranged from 0 to 13;Ru
had a maximum of 17. In Figure 2, an ARG generated by theRuestimator depicts the three recombination events
inferred at a typical locus (Stk) from the wild barley data set. The Drosophila and Z. mays loci were chosen for inclusion in the study because they were likely to have a sufficient number of recombination events to infer the role of gene conversion. For these loci,Ru-values are as
large as 35 inIdgf1fromD. melanogaster and 49 inZfl2
fromZ. mays. For some loci,e.g.,vermilionfrom the D. melanogasterlocus, theRhestimate is larger than theRs
estimate because the RecMin software can make use of more of the polymorphism data by considering sites that are segregating in alignment gaps.
Estimates ofr:Estimated rates of recombination per base pair for each of the wild barley loci are shown in Table 4 and Figure 3. A nonparametric Friedman rank sum test considering the estimation method as the treatment is significant (P¼83104), rejecting the null
hypothesis that there is no systematic difference in the estimators. The mean value of ˆrvaries almost threefold among the estimators, ranging from 4.33 to 12.483
103. While the mean estimates from ˆr
H01, ˆrMAF02, ˆrW00,
ˆ
rLS03, ˆrLamarc, and ˆrT05are relatively similar, the much
larger average r estimate from ˆrFD04 results primarily
from ˆr $243103for three loci,Dhn1,Dhn7, andWaxy.
Values of ˆrLamarc, ˆrFD04, and ˆrT05are coestimated along
withu(Figure 3). The values of ˆrT05are similar to
es-timates that were not coestimated,i.e., ˆrH01, ˆrLS03,and
ˆ
rW00. However, ˆrLamarcand ˆrFD04produce very different
estimates ofr, with much of the difference attributable to ˆrand ˆuforDhn1,Dhn7, andWaxymentioned above (Table 4). While the three loci have ˆrFD04.243103,
ˆ
rLamarc estimates are all #16 3 103, with the largest
difference among estimates at Dhn1, where ˆrLamarc ¼
5.14 3 103, but ˆr
FD04 ¼ 46.55 3 103. The estimate
of ˆuLamarc for the locus is 38.68 3 103 while ˆuFD04 ¼
17.883103. This difference is consistent with average
TABLE 3
The number of heterozygotes detected at wild barley loci and the impact of newly detected heterozygotes on descriptive statistics and parameter estimates
Gene
Heterozygotes
detected h Rm ˆ
uW% change
ˆ
up% change
ˆ
rH01% change
ˆ
rW00% change
Patterna% change
Patternd% change
GenBank no. of heterozygous sample
Cbf3 1/3 11/10 5/2 1.9 1.1 67.3 61.6 — 1070.3 AY895833 AY895848 Dhn1 0/1 15/16 7/7 0.9 0.3 2.7 110.3 0.0 10.95 AY895872
Dhn5 0/1 19/19 5/3 12.4 4.4 39.7 62.5 106.3 64.02 AY349228 Dhn7 2/3 19/19 9/6 16.5 6.7 27.5 39.1 15.0 10.70 AY895927 Waxy 2/3 22/23 6/6 1.6 0.4 13.9 1.7 0.0 0.01 AY349331
Results from the data in Morrellet al. (2005) are presented first followed by revised estimates. Parameter estimates and
values of ˆrand ˆufor the two methods (Figure 3). The Lamarc estimator appears to attribute much more of the total diversity to mutation; the average value from ˆ
rLamarc is only 35% of ˆrFD04and ˆuLamarc is 26% larger
than ˆuFD04.
Despite the differences among estimators, ranks ofr estimates, analyzed for all seven estimators while con-sidering the locus as the treatment in the Friedman rank sum test, distinguish between the levels of recombina-tion for the 17 loci (P ¼ 2.4 3 1011). The null
hy-pothesis that all loci have the same ˆr-value is rejected. Within any given estimation method, the estimates of recombination per base pair vary dramatically among loci; for example, the values for ˆrH01varied from 0 to
36.083103/bp (Table 4).
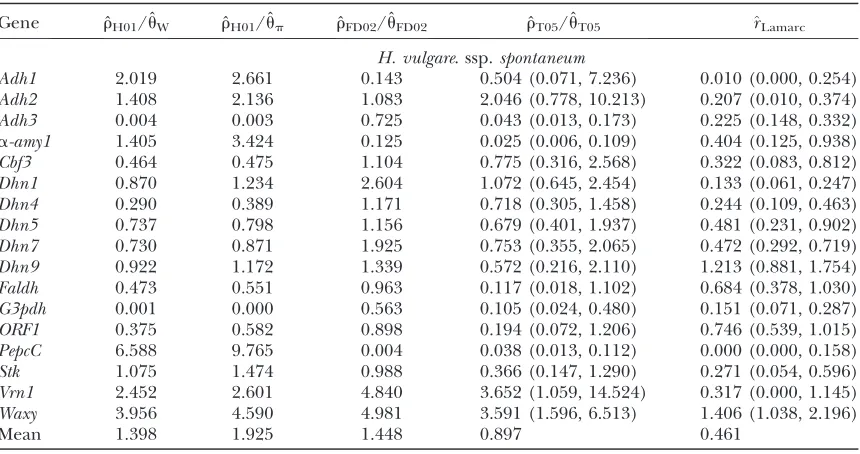
Estimates of r/u: Four estimates of r/u and the corresponding estimate from Lamarc,^rLamarc, for each
of the wild barley loci are shown in Table 5. The mean estimate of ˆr/ˆufor wild barley varies among estimators from 0.90 to 1.93. Values for^rLamarcfor each locus were
generally smaller than ˆr/ˆu and are dramatically lower for loci with ˆr/ˆu .1. For example the Waxy locus es-timates are ˆrH01/ˆup¼4.59, but^rLamarc¼1.4 even when
Lamarc estimates for the locus are reinitiated with
higher values of^rLamarcand lower values foru. Estimates
of the ratio r/u for wild barley loci follow a relatively narrow range of 0–4 regardless of the estimators ofrand uconsidered (Table 5). The only exceptions are at the
PepcClocus, where there are only four informative sites: atPepcC, ˆrH01/ˆuW¼6.6 and ˆrH01/ˆup¼9.8. The ˆrT05/
ˆ
uT05 estimator provides a direct means of estimating
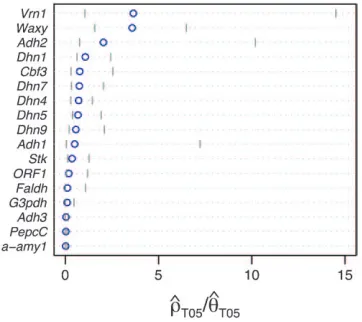
confidence intervals. Estimates of ˆrT05/ˆuT05 and 95%
confidence intervals for the wild barley loci are shown in Figure 4. Estimates of ˆrH01/ˆuWand ˆrH01/ˆupfor sampled Zea and Drosophila loci are in Table S1 (http://www. genetics.org/supplemental/). Estimates of r/u from Zea data are slightly higher than those for wild barley with a mean ˆrH01/ ˆuW¼3.5. TheD. melanogasterdata sets
sampled here are generally from multiple populations worldwide, including populations from parts of the species range that were recently colonized. Mean ˆrH01/
ˆ
uW¼2.5, which is much lower than ˆr/ˆu from the
ap-parent core of the range ofD. melanogasterin East Africa, where ˆrT05/ˆuT05was estimated as 7.6 (Haddrillet al.
2005).
Estimates of f: On the basis of maxhap estimates, 8 of our 17 wild barley loci show no evidence of gene conversion and return^fH01 ¼0 (Table 6). Among the
10 of our wild barley loci that met our criteria for external data sets (those that include.20 informative sites), 6 have maxhap estimates of ^fH01 . 0, with
esti-mates ranging from 0 to 59.5 (mean ¼ 18.04 and median ¼0.95). The largest two estimates of^fH01 are
59.5 forDhn5and 34 forAdh3. Inference of high levels of gene conversion at these loci is perhaps not surpris-ing, as the Dhn5 locus includes a series of repeated sequence motifs (Choiet al. 1999) that may be especially prone to illegitimate recombination, while Adh3 con-tains a 12-bp segment, delineated by three segregating sites, that shows evidence of either gene conversion or double recombination between deeply divergent hap-lotypes (see Figure 4 in Linet al. 2001).
Maxhap estimatesf^H01fromZ. maysloci range from 0
to 23.2, with^fH01¼0 at two of the five loci. The mean of
^
fH01 forZ. maysis 6.3 and the median estimate is 1.3.
Nine of the 10D. melanogasterloci show evidence of gene conversion on the basis of maxhap estimates, with^fH01¼
0.0–50.6 (mean¼8.4 and median¼1.3). For both por-tions of theNotchlocus fromD. simulans,^fH01 ¼29.4.
The largest available lookup table for maxhap has n¼
100 chromosomes. For the D. pseudoobscura Adhlocus 10 samples of 100 of the 139 chromosomes were drawn at random and analyzed with maxhap. In 8 of the 10 samples ^fH01 ¼0. The remaining two samples return
^
fH01¼6.8 and 25.
Maxhap provides an option to return the composite likelihood for each value of ^fH01 considered. Plotting
the output from individual loci demonstrates that for loci with very large values of^fH01(e.g.,Dhn5with^fH01¼
59.5) the likelihood value at the maximum-likelihood estimate of^fH01is only very slightly higher than that for
Figure2.—An ancestral recombination graph (ARG) for
much smaller values of^fH01;i.e., the likelihood surface
is almost completely flat and it is difficult to distinguish between the likelihood of small values of^fH01 and the
very large values returned by maxhap.
For our estimates of ^fPM (pattern matching), the
proportion of triplets in patternawas calculated for our 10 wild barley loci that have.20 parsimony-informative sites andRm$2; patternais not possible in the absence
of at least two observed recombination events. Among the 7 loci, 2 have no triplets in patterna(Table 6). When patterna triplets are observed, they are always a very small percentage of all possible triplets;e.g., there are 65 patterna triplets at Dhn4 or 1.4% of all 4495 triplets. Three loci,Dhn1,Dhn4, andDhn7have^fPM.0 on the
basis of pattern matching, with ^fPM ¼ 2, 1, and 2,
respectively. The maxhap estimates forDhn1andDhn7
were^fH01 ¼1.2 and 1.3, but 0 forDhn4. Thus pattern
matching for wild barley results in a mean ^fPM ¼ 1
(median^fPM¼1).
Figure 5 illustrates the results of pattern-matching simulations on a single locus. Simulation input values ofrcand fare plotted relative to a likelihood surface
that shows the proportion of coalescent simulations that matched within 20% of the proportion of patterns
aand thenbanddin the wild barley Dhn7locus. The locus has 50 parsimony-informative sites and Rm ¼6
(Table 2) after the elimination of every detectable genotyping error (Table 3). The best fit to the empirical data is at^fPM ¼2.1 and ˆrc ¼33 103/bp (forf .0,
r-values are for crossover only). For simulations with
f¼0, the best fit occurs forrc¼123 103/bp (very
similar to therH01andrLS03estimates of 12 and 143
103). However,f¼0 simulations provide a much poorer
fit to the data than simulations withf$0.4 (Figure 5). The plot is based on 1000 simulations for each pair of values forrandf, where parameter pairs make up a grid of all integer values ofr(per locus) between 1 and 20 inclusive (plotted values are per base pair 3 103)
and f-values incremented by 0.1 between 0 and 4 inclusive.
Among the 10D. melanogasterloci,^fPMranged from 0
to 6, with a median value of 1. InD. simulans, the two portions of theNotchlocus return estimates of^fPM¼1
and 2 (Table 6). Pattern matching for maize loci returns
^
fPM ¼0 for three loci and^fPM ¼3 for theAdh locus.
Pattern-matching simulations provided poor fit to the data from theD. melanogaster tinmanand theZ. mays Zfl2
loci and D. pseudoobscura Adh, and thus no pattern-matching estimates are reported (Table 6).
The accuracy of maxhap estimates of ^fH01:
Simu-lated data generated withf¼0 andrranging from 0 to 0.032/bp show that almost half of all maxhap estimates ˆ
rH01and^fH01 return a point estimate off^H01 .0. The
variance of^fH01is consistently higher than that of ˆrH01.
Forr¼83103(near the mean estimate for wild barley)
there is an 50% probability of estimating ^fH01 . 0 in
simulations with f¼0. In 10,000 simulations each for
L¼250 and 500 and withf¼0, medianf^H01¼5.7 and
7.4. This indicates that in coalescent simulations, single-locus-based estimates of ^fH01 have a large bias and
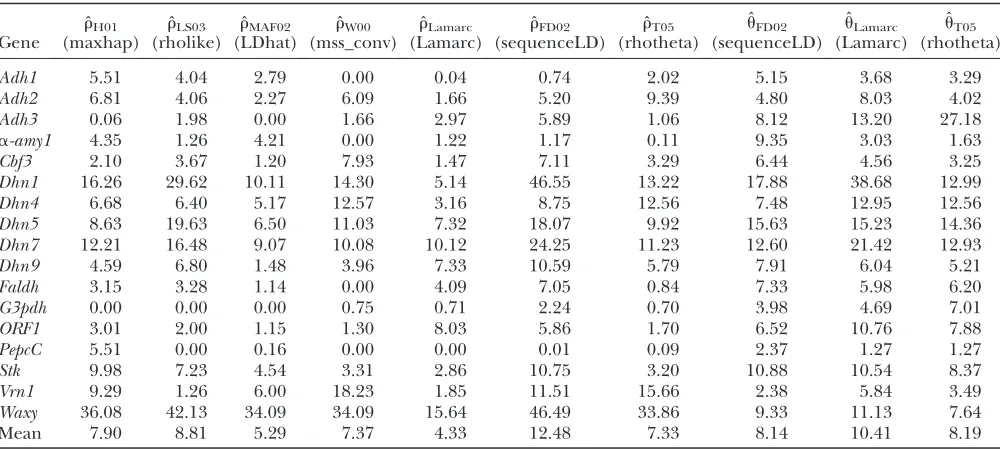
high variance (Wall 2004). Confidence intervals for composite-likelihood estimates of ˆr can be estimated TABLE 4
Estimates of ˆrand three coestimated values of ˆu(3103) for a common set of 25 samples at 18 loci in wild barley
Gene ˆ
rH01
(maxhap) ˆ
rLS03
(rholike) ˆ
rMAF02
(LDhat) ˆ
rW00
(mss_conv) ˆ
rLamarc
(Lamarc) ˆ
rFD02
(sequenceLD) ˆ
rT05
(rhotheta) ˆ
uFD02
(sequenceLD) ˆ
uLamarc
(Lamarc) ˆ
uT05
(rhotheta)
Adh1 5.51 4.04 2.79 0.00 0.04 0.74 2.02 5.15 3.68 3.29
Adh2 6.81 4.06 2.27 6.09 1.66 5.20 9.39 4.80 8.03 4.02
Adh3 0.06 1.98 0.00 1.66 2.97 5.89 1.06 8.12 13.20 27.18
a-amy1 4.35 1.26 4.21 0.00 1.22 1.17 0.11 9.35 3.03 1.63
Cbf3 2.10 3.67 1.20 7.93 1.47 7.11 3.29 6.44 4.56 3.25
Dhn1 16.26 29.62 10.11 14.30 5.14 46.55 13.22 17.88 38.68 12.99
Dhn4 6.68 6.40 5.17 12.57 3.16 8.75 12.56 7.48 12.95 12.56
Dhn5 8.63 19.63 6.50 11.03 7.32 18.07 9.92 15.63 15.23 14.36 Dhn7 12.21 16.48 9.07 10.08 10.12 24.25 11.23 12.60 21.42 12.93
Dhn9 4.59 6.80 1.48 3.96 7.33 10.59 5.79 7.91 6.04 5.21
Faldh 3.15 3.28 1.14 0.00 4.09 7.05 0.84 7.33 5.98 6.20
G3pdh 0.00 0.00 0.00 0.75 0.71 2.24 0.70 3.98 4.69 7.01
ORF1 3.01 2.00 1.15 1.30 8.03 5.86 1.70 6.52 10.76 7.88
PepcC 5.51 0.00 0.16 0.00 0.00 0.01 0.09 2.37 1.27 1.27
Stk 9.98 7.23 4.54 3.31 2.86 10.75 3.20 10.88 10.54 8.37
Vrn1 9.29 1.26 6.00 18.23 1.85 11.51 15.66 2.38 5.84 3.49
Waxy 36.08 42.13 34.09 34.09 15.64 46.49 33.86 9.33 11.13 7.64
Mean 7.90 8.81 5.29 7.37 4.33 12.48 7.33 8.14 10.41 8.19
using a parametric bootstrap simulation procedure (Hudson2001; McVeanet al. 2002). However, estimat-ing confidence intervals for^fH01when ˆrH01and^fH01are
coestimated is problematic. For simulations based on the loci sampled here, the lower bound of the 95% confidence interval appears to always include 0, and
upper bounds can be greater than an order of magni-tude larger than the point estimate. Thus, an estimate of
^
fH01 . 0 does not necessarily reflect the presence of
gene conversion.
Simulations with f . 0 yielded ^fH01-values that
in-crease dramatically with increasingfin the simulation. Figure 3.—Comparison
Forr¼83103,L¼250, and locus lengthl¼1500 bp, a
simulation input value off ¼5 results in a 97% prob-ability of ^fH01 . 0. An increase in the length of the
region simulated appears to dramatically improve the potential for rejecting high values off. Forl¼3000 and 4500 bp, the presence off.1 can be rejected with.95% probability (Figure 6). For parameter values that reflect
the wild barley data (i.e., as above,r¼83103andl¼
1500 bp) but with a tract lengthL¼500 a simulation input off¼5 results in a 92% probability of estimating
^
fH01.0. For 10 of 17 wild barley loci where the maxhap
^
fH01¼0, the haplotype variation observed is not likely to
have been generated by high levels of gene conversion (e.g.,f .5).
DISCUSSION
We demonstrate that despite a high level of self-fertilization, recombination makes as large a contri-bution to sequence diversity in wild barley as does mutation (r/u ¼ r/m $ 1). The primary impact of inbreeding is expected to be a dramatic reduction in the effectiveness of recombination. In a coalescent frame-work, this is realized as a reduction in the effect rate of recombination relative to mutation. For wild barley, ˆ
r/ˆu 1.5, similar to values estimated for outcrossing species (e.g., Balakirevet al. 2003; Balakirevand Ayala 2004b) and is30-fold greater thanr/u¼0.05 recently estimated for the self-fertilizing speciesArabidopsis thaliana
(Nordborget al. 2005). Published estimates for species-wide samples from the outcrossing species D. melano-gasterand maize have means of 1.0 and 1.5 (Balakirev and Ayala2004b; Wrightet al. 2005). However, various published data sets fromD. melanogaster, including those considered here, have very different sampling schemes and thus include populations with disparate demo-graphic histories. Recent demodemo-graphic history in par-ticular can influence estimated rates of recombination (Thornton and Andolfatto 2006). In East African populations of D. melanogaster (putatively the core of the species range) (Lachaiseet al. 1988) and in wild Mexican samples of the maize progenitor, teosinte, mean ˆr/ˆuhas been estimated as 7.6 and 4.5 (Haddrill
et al. 2005; Wrightet al. 2005). InA. thaliana, the impact of inbreeding is also confounded by a recent demo-graphic expansion (Nordborget al. 2005)
Why has the high rate of self-fertilization in wild barley not had a more dramatic impact on the relative role of recombination? First, it is important to note that
the relative role of recombination and mutation in the wild barley lineage prior to the evolution of self-fertilization is unknown. The species most closely re-lated toH. vulgaressp.spontaneumisH. bulbosum, which is self incompatible and obligately outcrossing. By comparison to teosinte, and accounting for potential impact of the ancestral mating system,r/uof 5–10 prior to the transition to self-fertilization is plausible. With an average of 98.4% self-fertilization, expectedrs/us
0.14–0.28, so observed ˆr/ˆu5–10 times that expected. A larger ancestral value of r/u leads to a smaller dif-ference in observed and expected values.
How can we account for the relatively large role of recombination in generating haplotypic diversity in wild barley? One possibility is that the rate of self-fertilization in wild barley has been overestimated. However, this does not seem likely. Brownet al. (1978) reported an average selfing rate of 98.4% (with a 95% confidence interval of 97.3–99.2%). The estimate was based on multiple progeny from each maternal plant and an assay of 22 polymorphic allozyme loci in 26 populations in Israel. The lowest self-fertilization rate estimated in a single population was 90.4%. More xeric sites had a higher self-fertilization rate than mesic sites, with aver-age rates of 99.6 and 97.9%, respectively. A recent study of 12 populations in Jordan that employed microsatellite-based estimates of outcrossing rate reported an average selfing rate of 99.7% (Abdel-Ghaniet al. 2004). Reports of observed heterozygosity based on numerous studies of allelic diversity in wild barley are consistent in sug-gesting very high rates of self-fertilization (cf. Nevoet al. 1979; Voliset al. 2001). Rates of self-fertilization could be as high or higher in other parts of the species range (e.g., Central Asia); populations in Israel and Jordan TABLE 5
Estimates ofr/ufor wild barley loci including the 95% confidence intervals for ˆrT05/ˆuT05and^rLamarc
Gene rˆH01/ˆuW rˆH01/ˆup ˆrFD02/ˆuFD02 rˆT05/ˆuT05 ^rLamarc
H. vulgare. ssp.spontaneum
Adh1 2.019 2.661 0.143 0.504 (0.071, 7.236) 0.010 (0.000, 0.254) Adh2 1.408 2.136 1.083 2.046 (0.778, 10.213) 0.207 (0.010, 0.374) Adh3 0.004 0.003 0.725 0.043 (0.013, 0.173) 0.225 (0.148, 0.332)
a-amy1 1.405 3.424 0.125 0.025 (0.006, 0.109) 0.404 (0.125, 0.938) Cbf3 0.464 0.475 1.104 0.775 (0.316, 2.568) 0.322 (0.083, 0.812) Dhn1 0.870 1.234 2.604 1.072 (0.645, 2.454) 0.133 (0.061, 0.247) Dhn4 0.290 0.389 1.171 0.718 (0.305, 1.458) 0.244 (0.109, 0.463) Dhn5 0.737 0.798 1.156 0.679 (0.401, 1.937) 0.481 (0.231, 0.902) Dhn7 0.730 0.871 1.925 0.753 (0.355, 2.065) 0.472 (0.292, 0.719) Dhn9 0.922 1.172 1.339 0.572 (0.216, 2.110) 1.213 (0.881, 1.754)
Faldh 0.473 0.551 0.963 0.117 (0.018, 1.102) 0.684 (0.378, 1.030)
G3pdh 0.001 0.000 0.563 0.105 (0.024, 0.480) 0.151 (0.071, 0.287)
ORF1 0.375 0.582 0.898 0.194 (0.072, 1.206) 0.746 (0.539, 1.015)
PepcC 6.588 9.765 0.004 0.038 (0.013, 0.112) 0.000 (0.000, 0.158)
Stk 1.075 1.474 0.988 0.366 (0.147, 1.290) 0.271 (0.054, 0.596) Vrn1 2.452 2.601 4.840 3.652 (1.059, 14.524) 0.317 (0.000, 1.145) Waxy 3.956 4.590 4.981 3.591 (1.596, 6.513) 1.406 (1.038, 2.196)
occur in a region with much higher rainfall than occurs across most of the range of wild barley (Voliset al. 2001, 2002).
A second possible explanation for the relatively large apparent role of recombination in this highly selfing species is that the transition to self-fertilization may have occurred relatively recently (Lin et al. 2002). If self-fertilization evolved recently, perhaps within the last 100,000 years (see discussion in Charlesworth and Vekemans2005), then many recombination events that occurred before the transition may still be evident in the data (Morrellet al. 2005).
Another possibility is that increased chiasma fre-quencies may elevate recombination rates within self-fertilizing lineages. Comparisons of inbreeding species and outcrossing relatives have frequently reported higher chiasma frequencies in inbreeders (Grant 1958; re-viewed in Charlesworth et al. 1977). The potential compensatory effects of increase in chiasma frequency are limited, however, because the high rate of homozy-gosity in self-fertilizing species means that most effective recombination follows an outcrossing event (Nordborg 1999). In wild barley the level of heterozygosity is ex-tremely low,,0.5% for highly polymorphic microsatel-lite loci (Baeket al. 2003) and 3.3% in the present data set after employing our heterozygote detection approach. Also, a phenomenon known as chiasma (or crossover) interference (cf. Malkovaet al. 2004) limits the number of additional chiasmata that can occur along an indi-vidual chromosome [although some fraction of re-combination events appear not to be constrained by interference (Copenhaveret al. 2002)]. Increased chi-asma frequency alone is unlikely to compensate for the 5- to 10-fold excess in recombination relative to expectations.
Estimated values of r: Parametric estimates of ˆr per base pair for wild barley have a mean of 7–83103,
TABLE 6
Estimates offbased on composite-likelihood and pattern matching, the percentage of decrease in the coestimated
ˆ
rH01,and ˆrfrom pattern matching (3103)
Gene
^
fH01 (maxhap)
% decrease in ˆrc
^
fPM(pattern matching)
ˆ
rc(pattern matching)
H. vulgaressp. spontaneum (loci withSp.20,Rm$2)
Adh3 34.3 95 — —
Cbf3 29.4 96 — —
Dhn1 1.3 53 2 2.5
Dhn4 0 — 1 9.4
Dhn5 59.5 98 0 18.5
Dhn7 1.2 57 2 4.1
Waxy 0.6 39 0 12.5
(loci withSp#20,Rm#2)
Adh1 0 — — —
Adh2 0.7 35 — —
a-amy1 0 — — —
Dhn9 0 — — —
Faldh 0 — — —
G3pdh 0 — — —
ORF1 0 — — —
PepcC 15.6 89 — —
Stk 0 — — —
Vrn1 11.5 91 — —
(external data sets)
GSP* 59.6 96 2 0.7
Hina* 3.0 73 2 3.4
Hinb* 57.6 95 — —
D. melanogaster
Bagpipe 0 — 2 15.6
CG3588 50.6 98 6 23.3
Est6 1.2 50 2 9.5
Idgf1 1.2 53 1 15.3
Idgf3 0.9 42 0 10.8
Notch 59 24.5 95 5 21.4
Polehole 3.2 77 0 29.2
Tinman 0.5 22 — —
Vermilion 0.9 45 0 30.3
yEst6 1.2 42 0 1.9
D. pseudoobscura
Adh 0 — — —
D. simulans
Notch 39 29.4 97 1 15.1
Notch 59 29.4 98 2 20.0
Z. mays
Adh 1.3 54 3 3.0
Glb1 23.2 96 0 30.8
Umc128 0 — 0 21.6
Umc230 7.1 94 0 17.8
Zfl2 0 — — —
Figure4.—Estimates of ˆrT05/ ˆuT05and 95% confidence
in-tervals for all wild barley loci. For each locus, the point of ˆ
40 times greater than estimates forA. thaliana(ˆr¼23
104) (Nordborg et al. 2005) and 0.4–0.5 times that
of maize (ˆr ¼16–19 3 103) (Tenaillonet al. 2002)
andD. melanogaster(ˆr¼12–143103) (Haddrillet al.
2005).
For several loci, the majority of estimators report ˆr¼
0 and it is evident that estimation of recombination in these loci is limited by the number of parsimony-informative sites. Several loci haveRm ¼0 (i.e.,Adh1,
a-Amy1,Faldh, andPepcC) (Table 4), and for these loci, the 95% confidence intervals of many estimators in-clude ˆr¼0. For the same loci the ˆrW00point estimate is
always ˆrW00¼0. For most of the same loci, ˆrH01is the
largest point estimate of ˆr. The ˆrT05 estimate uses a
similar summary of the data to that considered in ˆrW00
but estimates ˆr . 0 (although sometimes very small values) for every locus in the data set, including those withRm¼0.
A number of studies have reported on the accuracy of ˆrestimators based on coalescent simulations with a known input value of r (Kuhner et al. 2000; Wall 2000; Fearnhead and Donnelly 2002; Smith and Fearnhead 2005). Although we cannot estimate the accuracy of the seven estimators we have used on the wild barley empirical data, we can consider the utility of estimators and consistency of ˆr across estimators. As larger numbers of loci are considered, both the diffi-culty of input file preparation and computational efficiency can be serious limitations.
Point estimates of r from the seven estimators are highly correlated with each other. The most highly cor-related measures are from the two composite-likelihood estimators (ˆrH01 and ˆrMAF02, Pearson’s r2¼0.95) and
the two estimators that are based on summary statistics (ˆrW00and ˆrT05,r2¼
0.96). The estimates that are least
correlated with those of other estimators are those from ˆ
rLamarc (r2 , 0.62 for all pairs involving ˆrLamarc). The
results of the Friedman test indicate that both the locus and the estimation methods influence the rank of the estimates when the other factor is used as a blocking variable. This indicates that although the estimators differ, the locus rankings of ˆrare correlated among the seven methods. Therefore, the estimators concur suffi-ciently to allow the detection of different recombination rates for the 17 wild barley loci.
Among the seven estimators used for our 17 wild barley loci, ˆrT05returns the median estimate of ˆrfor six
loci and ˆrH01 returns the median estimate for three
more. No other estimator returns the median estimate more than twice (Table 4). Because one of our principal goals was to estimate the relative role of recombination and mutation, the rhotheta (ˆrT05) estimator has
con-siderable utility in that it provides a means of estimating ˆ
r, ˆu, and ˆr/ˆu with confidence intervals in a relatively limited amount of computational time with input based on a simple summary of the data. However, for rhotheta computational time increased dramatically for loci with increased numbers of recombination events. The max-imum values of Rm and Rh, the two summaries used
by rhotheta, were 7 and 12 for our wild barley data. Experimentation with Drosophila and Zea data suggests that the utility of the estimator may be limited for loci with much larger numbers of recombination events (e.g., the ZeaZfl2locus withRh¼26).
The ˆrLS03estimator generally returnsrestimates only
slightly greater than the median of all estimators (Table 4). The rholike software rapidly calculates the ˆrLS03
estimate with confidence intervals. Input file prepara-tion is relatively simple, but for larger empirical studies would have to be automated.
The use of lookup tables for the composite-likelihood estimators ˆrH01and ˆrMAF02allows these estimators to be
Figure5.—The likelihood surface for the wild barleyDhn7
locus based on the proportions of patternsa,b, anddin co-alescent simulations across a dense grid of values ofrandf. Spectral colors from red toward violet represent increased likelihood of a match between simulation input parameters and the empirical data. The strongest single peak is for^fPM¼ 2.1, and ˆrc¼33103.
Figure6.—Coalescent simulations based on meanr- and
the most computationally efficient. Also, because data in aligned fasta files can be piped directly into the ˆrH01
(maxhap) estimation software with no additional data file preparation, the estimator currently provides the most efficient means of estimatingrfor data sets with large numbers of loci. However, ˆrH01has relatively high
root mean squared error (Smithand Fearnhead2005) and returns the largest values of ˆr at loci when no recombination events are detected (based on recombi-nation countsRm–Ru¼0, Table 2), presumably because
these loci have a limited number of informative sites. Relative to other estimators, Lamarc consistently re-turns a lower estimate ofr(Figure 3; Table 4). Estimates of ˆrLamarc do not differ dramatically from other
esti-mates for loci with relatively low values of ˆr or ˆr/ˆu (Figure 3);e.g., ˆr/ ˆu,1. However, analysis of simulated data sets shows poor performance for Lamarc when ˆr/ ˆ
u.1 (Fearnheadand Donnelly2002). One possible explanation is that in using a nucleotide substitution model, Lamarc is better able to account for the mu-tation events and attributes a larger proportion of di-versity tou. However, repeat mutations at a single site are quite rare in the wild barley data set with only 0.74% of sites with more than two nucleotide states. Lamarc does return the largest average estimate ofu, but the estimate is not significantly different from the smallest average estimate ˆuFD02(one-tailed pairedt-test,P¼0.067).
Estimating the role of gene conversion: Among the wild barley loci, maxhap estimates^fH01.0 for nine loci,
but only three of these show^fPM . 0 (on the basis of
pattern matching). Several wild barley loci do not in-clude any triplets or quadruplets of sites in patternaor
d. For example,ORF1andStkwith 22 and 20 parsimony-informative sites do not contain any site configurations consistent with conversion or double crossover, and thus pattern matching is not possible. The number of triplets possible at a locus is (Sp3 (Sp1) 3 (Sp 2))/3!,
where Spindicates parsimony-informative segregating
sites. Thus the number of triplets increases exponen-tially with an increase in the number of informative segregating sites.
Pattern-matching simulations result in estimates of
^
fPM ¼ 1–2 for wild barley loci that show evidence of
gene conversion. Because half of coalescent simulations withf¼0 (andrset to the mean value for wild barley) result in estimates of^fH01.0, maxhap estimates cannot
be used to accurately identify the presence of gene conversion. However,^fH01 ¼0 can be used to rule out
high levels of gene conversion at a locus.
Much higher rates of gene conversion than we identify on the basis of pattern matching have been reported on the basis of nucleotide sequence data from
A. thaliana. Using an ad hoc method, Haubold et al. (2002) reported^f ¼9 in sequence data fromA. thaliana; two- and three-site likelihood analyses resulted in ^f
estimates¼14.8 and 16 on the basis of the same data (Wall 2004). Another recent estimate from a large
number of A. thaliana loci reported a mean f^ ¼ 5 (Nordborg et al. 2005), although this estimate has recently been revised to^f¼1 (Plagnolet al. 2006). For wild barley, if chromosomes were actually subject to five times more gene conversion than crossover, using maxhap, we would mistakenly estimate ^fH01 ¼ 0 at
2.4 or 8.3% of loci on the basis of simulations withL¼
250- and 500-bp tract lengths. Therefore we can reject
f¼5 in wild barley with 98 or 92% confidence depend-ing on the assumed tract length. On the basis of the implications of coalescent simulations and our observa-tion that minor errors in genotyping can dramatically affect ^f for data sets that have not been rigorously purged of typing errors, it is likely that the role of gene conversion has been overestimated in the literature.
As is evident from the preceding discussion, it is difficult to estimate the relative role of gene conversion from nucleotide sequence data. There are at least four major challenges. The first is that unlike crossing over, which initiates as a point process that extends to the end of the chromosome, gene conversion events involve small tracts of chromosomes and therefore a limited number of segregating sites. Thus evidence for gene conversion is necessarily limited and fragmentary. The second issue is that it is difficult to collect nucleotide sequence data appropriate for estimating the role of gene conversion. In random-mating organisms, direct sequencing of PCR products yields unphased sequence data with little utility for inferring conversion. Experi-mental phasing of data through cloning of PCR prod-ucts is expensive and labor intensive and can propagate PCR artifacts such as PCR recombinants that make accurate determination of haplotypes much more difficult (Cronn et al. 2002). The use of inbred lines or inbreeding organisms (with allele-specific PCR and direct sequencing for occasional heterozygotes) makes data collection much more tractable, but there must have been a history of occasional heterozygosity for recombination to have ever been effective. Also, the organism under consideration must have sufficient levels of sequence polymorphism so that at least a sin-gle segregating site occurs in conversion tracts likely to be only hundreds of base pairs in length (Hilliker
et al. 1994; Frisseet al. 2001; Jeffreysand May2004). Otherwise gene conversion events will play a limited role in effective recombination. Also the locus sequenced must be of sufficient length to contain perhaps 20 parsimony-informative segregating sites, on the basis of the observation that the observed proportion of pattern