NUCLEAR POWER PLANT SITE SELECTION BASED ON LOCAL
EFFECTS
Stoyan Andreev1and Georgi Varbanov2
1
Geotechnical and Earthquake Engineer, Risk Engineering, Bulgaria 2
Chief Expert, Risk Engineering, Bulgaria
ABSTRACT
At the NPP site selection stage several sites are typically proposed and compared. The site seismic response as part of the overall seismic hazard is among the most important parameters of the site evaluation. When the sites are distant enough and have different local geological conditions the results of the seismic hazard assessment based on Ground Motion Prediction Equations accounting the type of soil deposits are sufficient to make the difference between the local responses of the different sites. For adjacent sites with similar geologic properties this approach can not reflect the differences between the different sites and does not give a reliable base to compare the candidate sites. In this case site specific response analyses are necessary to compare the parameters of the local soil response and choose the most suitable site.
In this case-study, four closely located NPP sites underwent detailed analyses to obtain their local free-field responses. The uncertainty in the site specific geotechnical data was included in the simulations with the Latin Hypercube Experimental Design procedure. The seismic input consists of an extended set of real strong motions recorded at stations founded on rock or soils with well documented properties. The selected input motions reflect the results of the magnitude-distance deaggregation for the area specific PSHA.
To rank the candidate sites their specific response spectra are compared to each other and to the Uniform Hazard Response Spectrum derived in the PSHA. The local modification effects of each site are discussed and the preferred site-candidate is nominated.
INTRODUCTION
The importance of earthquakes for the safety of nuclear power plants was recognized early in their development. Since these early days considerable scientific and engineering efforts have been put in the evaluation of the seismic hazard and the design of structures, systems and components in NPPs. Seismic hazard evaluation requirements are given in the regulatory frameworks of the countries, operating NPPs, with summarization in IAEA documents such as NS-R-3 (2003) and SSG-9 (2010).
This paper entails the extensive analyses and assessment of four adjacent sites with medium soils proposed for NPP construction in order to compare their free-field responses. The method and criteria for seismic site evaluation follow the best practices given in details in IAEA documents NS-R-3 (2003), NS-G-3.6 (2004), SSG-9 (2010), and U.S.N.R.C. Reg. Guide 1.208 (2007). Based on the PSHA and site-specific geodynamic models, a large number of site response analyses with selected ground motion records from relevant seismic sources were performed. The uncertainty in the input data is treated with the Latin Hypercube Experimental Design technique. The results are summarized and compared to the simplified results from PSHA. This approach was also used by the senior author in previous case studies for NPP seismic hazard assessment (Varbanov et al., 2010).
INPUT DATA
Initial Seismic Hazard Analysis
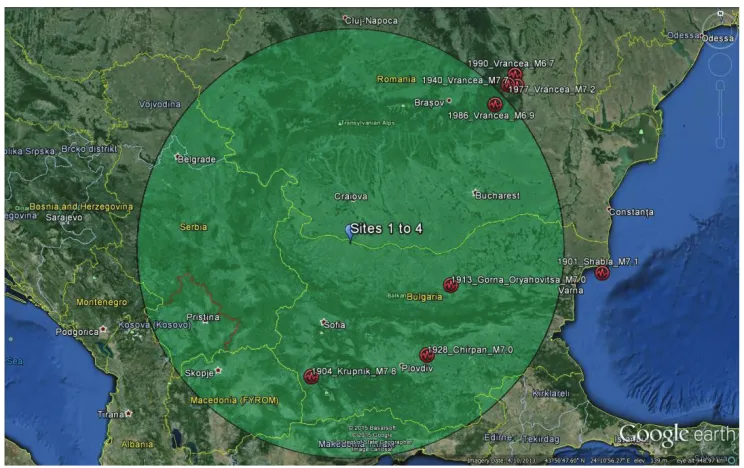
The four proposed sites are situated in the northwest part of Bulgaria, on the right bank of the Danube River, see Figure 1. In the same figure the 320-km region around the sites is shown in green with the epicentres and magnitudes of the major earthquakes that hit the region since 1900 with epicentres and magnitudes taken from USGS and local databases. Although there are active seismic zones closer to the sites, the deep and distant Vrancea earthquakes have predominant influence, which is confirmed by the deaggregation of the seismic hazard.
Figure 1. Sites location within 320-km area and strong earthquakes epicentres (copyright 2015 Basargsoft, 2015 Google, US Dept. of State Geographer, Image Landsat)
In the initial PSHA the hazard curves were representative for “medium” soils and the local affects were considered with appropriate attenuation laws representative for such type of underlying soils.. Figure 2 shows the 50th and 84th percentiles of the calculated uniform-hazard response spectra (UHRS) for the return period of 10,000 years. Explicitly “response spectra” here refers to the acceleration response spectra with 5% of critical damping.
Local geological conditions at the sites
Figure 2. UHRS for 10 000 year return period, PGA=0.209g
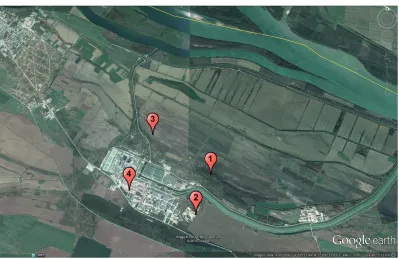
Figure 3. Map of the local area with site centres (copyright 2015 CNES/Astrium, 2015 Google)
The geotechnical conditions in the whole area are well studied. Different loess sediments (silty sands and silty clays), formed by the accumulation of wind-blown silt, are placed on top of the soil deposits. Fine-grained sands, gravels and deep clay layers lie under the loess down to about 200 m where the base rock (marls) starts. The sites closer to the river (1 & 3) have average shear wave velocities in the upper 30 m of approximately 260 m/s. Site #2 is the stiffest with Vs,30=300 m/s and Site #4 lies in between with Vs,30=280 m/s. The stratification of the sites is also similar in the couples 1&3 and 2&4. The highly non-uniform distributions of shear wave velocities are presented in Figure 4.
Non-linear soil behaviour
0 5 10 15 20 25 30 35 40
0 100 200 300 400 500 600 700
Dep
th
fro
m
sur
face
,
z
(m
)
Shear wave velocity, Vs(m/s)
Site 1 Site 2 Site 3 Site 4
Figure 4. Shear wave velocity distributions in depth for the sites
Figure 5. Reduction curves of shear modulus for loess, clays, sands, gravels and marls (IZIIS, 1993)
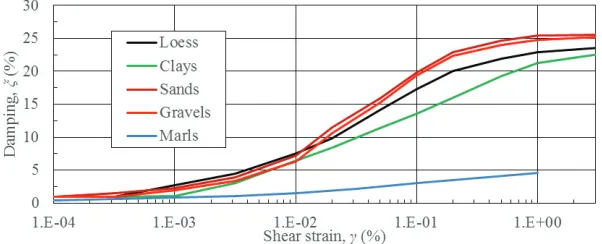
Figure 6. Damping curves for loess, clays, sands, gravels and marls (IZIIS, 1993)
Uncertainty in the geotechnical data
one of its main advantages. Another advantage is that random samples can be taken one at a time, remembering which samples were taken so far. There is no rigorous requirement for LHCED sample size (in contrast with Monte Carlo sampling), so the selection of the number of Latin Hypercube samples is usually based on the analyst experience and performed sensitivity analysis on the variation of mean and standard deviations with respect to the sample size (Matala, 2008). For the current site response analyses 10 generations were chosen as sufficient to represent the probability distributions of the selected random variables. This value is based on the experience of the authors with previous seismic hazard and probabilistic safety assessments of NPP sites and structures as well as large dams (Varbanov et al. 2007, 2010, 2011).
Log-normal probability distributions were assumed for three properties (thickness, shear wave velocity and soil density) of each layer in the deposits. Thus every site model with n layers has 3n independent variables. The standard deviations for soil density and layer thickness were based on measurements and site stratigraphy. For the shear wave velocities a coefficient of variation Cv=20% was chosen in
order to cover the recommended variation of soil stiffness (Cv≥50%) given in NS-G-3.6 (2004).
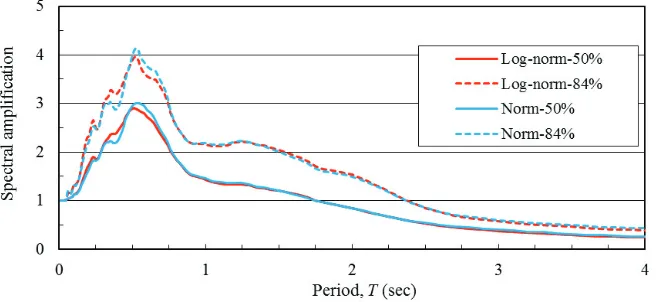
Ten different models were developed for the site response analyses of each site using LHCED generations based on generalized profiles. To check the sensitivity of the output to the type of distribution, the three variables for Site #1 were sampled again with normal distribution with the same standard deviations, leading to 10 additional models for Site #1.
Input ground motions
Based on the magnitude-distance deaggregation of the PSHA 56 horizontal ground motion records are chosen as representative for the proposed sites – 48 GMs from Vrancea sources with focal depths 80-130 km, recorded in the 1977, 1986 and 1990 earthquakes (Mw=6.3-7.2)
as well as 8 GMs from shallow local sources recorded during the 1986 Krupnik and Strazhica earthquakes (Mw=4.3-5.1). All GMs have cumulative absolute velocity CAVSTD≥0.06g.sec.
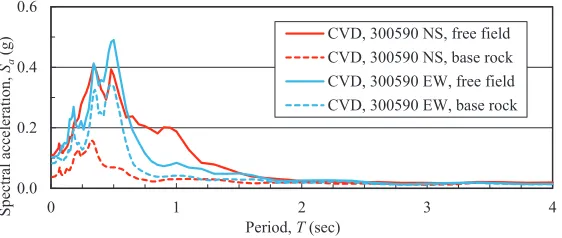
Vrancea GMs consist of 22 records on rock outcrop and 26 records on the free-field of soil profiles with varying stiffness. In order to obtain outcrop GMs for the seismic input, 1D deconvolution analyses are performed with the soft soil records. Example results from deconvolution of a soft-soil record of 30.05.1990 Vrancea earthquake are provided in Figure 7 (Varbanov et al., 2010).
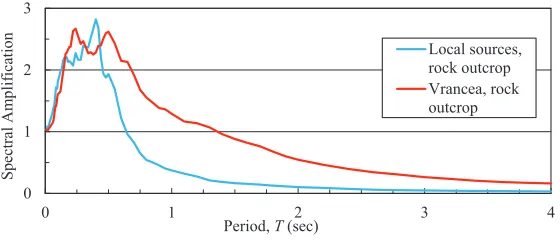
All GMs from local sources are recorded on rock outcrop. Normalized response spectra for Vrancea and Local GMs (rock outcrop) are shown in Figure 8 (Varbanov et al., 2010).
0.0 0.2 0.4 0.6
0 1 2 3 4
Spectr al accel erat ion, Sa (g)
Period, T(sec)
CVD, 300590 NS, free field CVD, 300590 NS, base rock CVD, 300590 EW, free field CVD, 300590 EW, base rock
Figure 7. Deconvolution of 30-05-1990 Vrancea records, Cernavoda station, Vs30=260 m/s, epicentral
0 1 2 3
0 1 2 3 4
Spectr
al Am
pli
fica
ti
on
Period, T(sec)
Local sources, rock outcrop Vrancea, rock outcrop
Figure 8. Normalized response spectra for input GMs from Vrancea and local sources (see Varbanov et al., 2010)
SITE RESPONSE ANALYSIS
One-dimensional analyses in the frequency domain were performed on the LHCED site models with the SHAKE91 code (Idriss & Sun, 1993), which applies the equivalent-linear approach developed by Schnabel, Lysmer and Seed (1972), with improved calculation resources, such as maximum number of sublayers, etc. In the 1D site models every layer was divided in sublayers to cover the Lysmer & Kuehlemeyer (1969) criterion for propagating waves with frequencies of up to about 20 Hz. For each site, 560 runs were performed with additional 560 for sensitivity analysis of Site #1 for a total of 2800 runs. The PGAs of the input outcrop motions were calibrated, so the mean output PGA on the free-field is equal to the value from the PSHA.
RESULTS
Since the values of free-field PGAs were already given as hazard curves in the PSHA, the data processing and assessment focused on the shape of the response spectra. The free-field acceleration spectra from each run of SHAKE for given site were normalized to PGA=1g. The mean and standard deviations of normalized spectral accelerations were then calculated for Vrancea and local earthquakes, giving the site-specific spectral shapes for both sources.
Normalized response spectra from Vrancea earthquakes
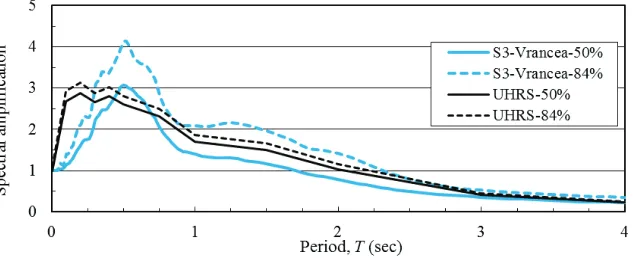
Figures from 9 to 12 show the site-specific normalized response spectra for 50% and 84% confidence levels from Vrancea earthquakes. For brevity, the spectra from local earthquakes have been omitted.
Figure 10. Normalized free-field response spectra for Site #2 from Vrancea earthquakes
Figure 11. Normalized free-field response spectra for Site #3 from Vrancea earthquakes
Figure 12. Normalized free-field response spectra for Site #4 from Vrancea earthquakes
Site response comparison
Figures 13 and 14 show the comparison between normalized spectra of the four sites and the UHRS.
Sensitivity analysis
Figure 13. Comparison of free-field response spectra with 50% confidence level
Figure 14. Comparison of free-field response spectra with 84% confidence level
Figure 15. Results of sensitivity analysis for log-normal and normal distribution
DISCUSSION
The 84% site spectra display similar trends, but with smaller relative differences between the sites. Site #2 has two clear peaks at T=0.25 sec and T=0.55 sec with amplification of about 3.5. The other sites have pronounced peaks at 0.55 sec with spectral amplifications 3.7 to 4.1 and lesser peaks at 0.25 sec. The important observation here is that the 84% UHRS envelopes the site-specific 84% spectra only for periods less than 0.20 sec and between 0.8 and 1.0 sec. This is a clear indication that the variation of model parameters in the detailed local response analyses is significantly larger than in the simplified GMPE-approach in the PSHA. This is caused partially by the numerical variability of soil properties, as well as the uneven distribution of soil properties in depth and complicated stratification of the soil deposits.
The ranking of sites by their local response to earthquakes was based on the spectral amplification, relation with the UHRS and the over-all geological conditions at the sites. Site #2 was preferred for the construction of a new NPP considering its stiffer soils and lower amplifications as compared to the other three sites. Additional geotechnical investigations were performed on a 100 m deep drill at the centre of the selected site. Their results were used as input for the re-run of the response analyses for the site. The design response spectrum for the new nuclear installation should be generated by enveloping, widening and smoothing of the modified site-specific spectrum and proposed to the Owner.
CONCLUSION
The paper presents a case study for seismic evaluation and selection of preferred site for the construction of a new NPP in north-west Bulgaria. The Latin Hypercube Experimental Design method has been implemented to generate lognormal and normal distributed soil parameters for 4 adjacent sites with different geological conditions. Frequency-domain analyses of the sites have been performed using the SHAKE91 code. The results are presented graphically as normalized response spectra. Their comparison shows increasing maximum spectral amplifications with decreasing the stiffness of the soil deposits. The mean site-specific spectra for 3 of the sites exceed the mean UHRS around T=0.55 sec with only Site #2 being completely enveloped. The 84% site-specific spectra for all sites exceed significantly the 84% UHRS for wide period ranges. The UHRS are not truly representative for any of the actual sites. The site with lowest spectral amplification is preferred for construction of the new nuclear installation and its geotechnical and dynamic properties are elaborated to obtain the design response spectrum.
In summary, the mean spectral accelerations for the preferred Site #2 are lower than predicted by the PSHA. The overall seismic hazard allows for successful construction and operation of a new NPP with additional geotechnical measures, mitigating the seismic risk for the facilities.
ACKNOWLEDGMENT
We would like to thank Dr Marin Kostov for his shared expertize and guidance in the course of this project, and Mrs Nina Koleva for her work in the data post-processing.
REFERENCES
Eglajs, V. and Audze, P. (1977). “New approach to the design of multifactor experiments”, Problems of Dynamics and Strengths, vol. 35 (in Russian), Riga, pp 104-107
Idriss, I. M. and Sun, J. I. (1993). User’s manual for SHAKE91: A computer program for conducting equivalent linear seismic response analyses of horizontally layered soil deposits. University of California, CA, USA
INTERNATIONAL ATOMIC ENERGY AGENCY. (2003). Site Evaluation for Nuclear Installations. IAEA Safety Standards Series No. NS-R-3. IAEA, Vienna, Austria.
INTERNATIONAL ATOMIC ENERGY AGENCY. (2004). Geotechnical Aspects of Site Evaluation and Foundation for Nuclear Power Plants. IAEA Safety Standards Series No. NS-G-3.6, IAEA, Vienna, Austria.
INTERNATIONAL ATOMIC ENERGY AGENCY. (2010). Seismic Hazard and Site Evaluation for Nuclear Installations. IAEA Safety Standards Series No. SSG-9. IAEA, Vienna, Austria.
Lysmer, J., Kuhlemeyer, R.L. (1969). “Finite Dynamic Model for Infinite Media”, ASCE, Journal of Engineering and Mechanical Division, pp. 859-877
Matala, A. (2008). “Sample Size Requirements for Monte Carlo Simulations Using Latin Hypercube
Sampling”, Department of Engineering Physics and Mathematics, Helsinki University of
Technology, Helsinki, Finland
McKay, M. D., Beckman, R. J. and Conover, W. J. (1979). “A Comparison of Three Methods for Selecting Values of Input Variables in the Analysis of the Output from a Computer Code”, Journal of the American Statistical Association, vol. 21 (2), pp 239-245
Institute for Earthquake Engineering and Engineering Seismology (1993), Initial Data of Seismic Input and Soil Conditions of Kozloduy NPP Site, IZIIS, Skopje, Macedonia
Schnabel, P. B., Lysmer, J. and Seed, H. B. (1972). SHAKE: A Computer Program for Earthquake Response Analysis of Horizontally Layered Sites. Report No. UCB/EERC-72/12. Earthquake Engineering Research Center, University of California, Berkeley, CA, USA
Varbanov, G., Kostov, M., Stefanov, D., Kaneva, A., and Koleva, N. (2007). “Seismic Risk Assessment for Large Dams”. Proceedings of the 8th PCEE, Singapore
Varbanov, G., Kostov, M. and Koleva, N. (2010). “LHCED Simulation for Assessment of NPP Site Local Response”,Proceedings of the 14th ECEE, Ohrid, Macedonia
Varbanov, G., Kostov, M., Andonov, A., Apostolov, K. and Iliev, A. (2011). “Seismic Risk Assessment of Large Dams”, Proceedings of the 15th WCEE, Lisbon, Portugal