ABSTRACT
JOIJODE, ABHAY SHAM. Nano-structuring Polymers by Processing them with Small Molecule Hosts. (Under the direction of Dr. Alan E. Tonelli).
Nano-structuring of polymers via the host-guest inclusion phenomenon offers a novel approach to reorganize their morphologies, which affects their resultant behaviors and properties. This involves formation of a non-covalently bonded inclusion complex between the guest polymer chains and small molecule hosts which is followed by careful removal of the host molecules to obtain coalesced polymers that have a largely extended and un-entangled morphology.
The first study involves processing PMMA, PVAc, and their blends with host urea (U) to initially form inclusion complexes (ICs) followed by coalescence of the guest polymers from the U-ICs. Formation of the U-ICs was characterized using FTIR, TGA and DSC, which confirmed the inclusion of the polymer chains in the narrow crystalline urea channels. FTIR and NMR data confirmed complete removal of urea from the coalesced polymers, while their DSC data showed higher Tgs than the corresponding as-received (asr)-polymers. For the coalesced blends it was found that PMMA was preferentially included over PVAc, as inferred from FTIR & DSC results, and a Tg-Composition relationship was also established.
Nano-structuring Polymers by Processing them with Small Molecule Hosts.
by
Abhay Sham Joijode
A dissertation submitted to the Graduate Faculty of North Carolina State University
in partial fulfillment of the requirements for the degree of
Doctor of Philosophy
Fiber and Polymer Science
Raleigh, North Carolina 2014
APPROVED BY:
_______________________________ ______________________________ Dr. Alan E. Tonelli Dr. Xiangwu Zhang
Committee Chair
DEDICATION
BIOGRAPHY
Abhay Sham Joijode was born in Mumbai, India and he completed his Bachelors of Technology degree in Fiber and Textile Processing Technology at Institute of Chemical Technology (formerly UDCT), Mumbai, India. With research and career interests in polymer science, he joined the research group of Dr. Alan E. Tonelli (INVISTA Professor of Fiber & Polymer Chemistry) at North Carolina State University. He has since been an active member of this group, investigating structure property relations in polymers mainly processed with small molecule hosts like cyclodextrins and urea.
After completing his PhD education, Abhay will start working as a Researcher at the Nonwovens Cooperative Research Center (NCRC) investigating blends of synthetic and biopolymers for novel nonwovens applications.
ACKNOWLEDGMENTS
First and foremost I would like to thank the chair of my advisory committee Dr. Alan E. Tonelli for his invaluable guidance and support during my graduate studies without which I would not have achieved my career goals. I would also like to thank the members of the advisory committee Drs. Xiangwu Zhang, Melissa Pasquinelli, and Jan Genzer.
TABLE OF CONTENTS
LIST OF TABLES ...ix
LIST OF FIGURES ... x
CHAPTER 1 ... 1
1. Background – Polymer Inclusion Compound ... 1
1.1 Guest Polymers ... 3
1.1.1 Poly (vinyl acetate) (PVAc) ... 3
1.1.2 Poly (methyl methacrylate) (PMMA) ... 4
1.2 Hosts ... 5
1.2.1 Cyclodextrins ... 5
1.2.2 Urea ... 8
1.3 Processing Polymers with Their Inclusion Compounds ... 10
1.3.1 Inclusion Phenomenon ... 10
1.3.1.1 Cyclodextrin Inclusion ... 11
1.3.1.2 Urea Inclusion ... 22
1.3.2 Polymers Coalesced from Their Inclusion Compounds ... 24
1.4 Overview of Analytical techniques for Polymer Characterization ... 25
1.4.1 Fourier Transform Infrared (FTIR) Spectroscopy ... 25
1.4.2 Nuclear Magnetic Resonance (NMR) Spectroscopy ... 27
1.4.3 Wide Angle X-ray Diffraction (WAXD) ... 28
1.4.4 Differential Scanning Calorimetry (DSC) ... 29
1.4.6 Thermo Gravimetric Analysis (TGA) ... 31
1.4.7 Dynamic Mechanical Thermal Analysis (DMTA) ... 32
1.4.8 Nano-Indentation ... 33
1.5 References ... 35
CHAPTER 2 ... 39
2. Glass-Transition Temperatures of Nano-Structured Amorphous Bulk Polymers and their Blends ... 39
2.1 Abstract ... 39
2.2 Introduction ... 40
2.3 Methods & Materials ... 43
2.4 Results & Discussion ... 45
2.5 Summary ... 64
2.6 References ... 66
CHAPTER 3 ... 68
3. Annealing Studies and Properties of Poly (vinyl acetate) (PVAc) Coalesced from its Inclusion Complex with Gamma-Cyclodextrin (γ-CD) and Urea (U) ... 68
3.1 Abstract ... 68
3.2 Introduction ... 69
3.3 Experimental Section ... 71
3.4 Results & Discussion ... 74
3.5 Acknowledgement ... 88
CHAPTER 4 ... 90
4. Improving the Behavior and Properties of Poly (ethylene terephthalate) (PET) Through Self-Nucleation ... 90
4.1 Abstract ... 90
4.2 Introduction ... 92
4.3 Experimental Section ... 95
4.4 Results & Discussion ... 102
4.5 Summary & Conclusions ... 117
4.6 Acknowledgement ... 118
4.7 References ... 119
4.8 Supporting Information ... 120
CHAPTER 5 ... 125
LIST OF TABLES
Table 1.1: Commercial CD-ICs ...14
Table 2.1: Tgs of (n-s)-PVAc-γ-CD-ICs ...53
Table 2.2: Hansen Solubility Parameters for PMMA and PVAc ...57
Table 2.3: Tgs of PMMA/PVAc Blends in Their Common (n-s)-γ-CD-IC ...60
Table 3.1: Measured Densities for as-received and coalesced PVAcs ...78
Table 3.2: Tgs of c-PVAc from its γ-CD-IC annealed at 70 oC for different time periods ...81
Table 3.3: Densities of asr-PVAc, c-PVAc (γ-CD), and their 50/50 blend after annealing at 70° C for 4 weeks* ...84
LIST OF FIGURES
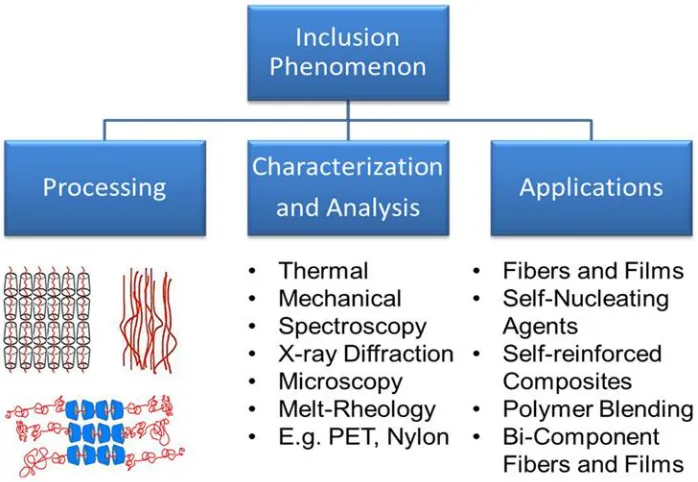
Figure 1.1: CD Host-Polymer Guest inclusion phenomena – processing, evaluation,
and applications ...2
Figure 1.2: Synthesis of PVAc...3
Figure 1.3: Cyclodextrin Production; a) Solvent & b) Non-solvent methods ...6
Figure 1.4: Cyclodextrins ...7
Figure 1.5: Urea manufacturing process ...9
Figure 1.6: Typical structures of polyrotaxanes ...10
Figure 1.7: Formation of Polyrotaxanes via cyclic-host and macromolecular guest inclusion ...11
Figure 1.8: CD structures: a) herringbone-type cage, b) layer-type cage and c) columnar ...15
Figure 1.9: FTIR data for PLLA-α-CD-IC...16
Figure 1.10: WAXD pattern for a) PMMA-CD-IC and b) as-received γ-CD ...17
Figure 1.11: Processing polymers with CDs ...18
Figure 1.12: WAXD data for a) γ-CD b) 1-Propanol-γ-CD-IC c-f) PDMS-γ-CD-ICs with molecular weights 237, 770, 1250 and 62,500 g/mol respectively ...19
Figure 1.13: FTIR data for PCL-α-CD-ICs, with varying PCL:α-CD ratios ...20
Figure 1.14: a) Nylon 6 and b) Nylon 6 + 2% 3:1 ns-IC ...21
Figure 1.15: Urea Inclusion – Matrix formation via hydrogen bonding ...23
Figure 1.16: Load-Displacement Curve ...34
Figure 2.1: Schematic illustration of the polymer nano-confinement in and release
from their crystalline ICs formed with CD hosts ...41
Figure 2.2: FTIR spectra for (top to bottom) U, PVAc-U-IC, and asr-PVAc ...46
Figure 2.3: FTIR spectra for coalesced polymers ...47
Figure 2.4: 13C-NMR spectra (below) for urea and c-PVAc ...48
Figure 2.5: TGA data for urea and PVAC-U-IC ...49
Figure 2.6: DSC observed glass transitions for U, P-U-ICs, and their physical mixtures ...50
Figure 2.7: Glass transitions in asr-polymers and those coalesced from their U-ICs ..52
Figure 2.8: Heating DSC scans of asr-PVAc and -PMMA and their (n-s)-γ-CD-ICs ..54
Figure 2.9: Channel structure a polymer-γ-CD-IC. 0.4 polymer chains/nm2 of γ -CD-IC crystal surface in the case of PVAc and PMMA, [21] which are singly included in each channel protruding polymer chains form Dense Polymer Brushes ~ half the density of chains in bulk polymer crystals ...55
Figure 2.10: DSC scans of 2-1-ns- γ-CD-IC (top) and PVAc coalesced from it (bottom). ...56
Figure 2.11: Suggested hydrogen bonding in PMMA/PVAc blends ...58
Figure 2.12: 1H NMR (500MHz) data for 3:1(n-s)-PMMA/PVAc(1:2)-γ-CD-IC in d6-DMSO...59
Figure 2.13: Heating DSC scans of (n-s)-PVAc/PMMA- γ-CD-ICs ...61
Figure 2.14: FTIR data for a 50/50 PMMA/PVAc blend coalesced from its U-IC ...62
Figure 2.16: Tg vs. Composition for PMMA/PVAc blends coalesced from their
common U-ICs ...64
Figure 3.0: Table of Contents (TOC) Figure ...69
Figure 3.1: Formation of and coalescence of a polymer sample from its crystalline cyclodextrin inclusion complex. ...70
Figure 3.2: Highly idealized depiction of extended un-entangled polymer chains in a coalesced sample (right) and the randomly-coiling entangled chains in a polymer solution or melt (left). ...71
Figure 3.3: FTIR spectra for PVAc-γ-CD-IC (above) and DSC scans for PVAc-ICs (below) ...76
Figure 3.4: 1H-NMR spectra for Urea (top) and c-PVAc (bottom) ...77
Figure 3.5: DSC Scans for asr-PVAc, c-PVAc from γ-CD and from urea ...78
Figure 3.6: Loss Moduli data for asr- and c-PVAc at 70 oC ...80
Figure 3.7: c-PVAc from U-IC annealed for different time periods ...82
Figure 3.8: DSC scans of an initial 50/50 physical mixture of asr-PVAc/c-PVAc before (top) and after (bottom) annealing for 14 days at 70 oC ...83
partition the remaining crystal cores into ‘‘cells’’ (right). On further melting, the
inner regions of these cells contain un-entangled melt ...87
Figure 4.0: Table of Contents (TOC) Figure ...91
Figure 4.1: Schematic representation of -, -, -cyclodextrins ...93
Figure 4.2: Formation of and coalescence from polymer-cyclodextrin inclusion complexes. ...94
Figure 4.3: Crystalline all trans (t) [top] and γ-CD-included g±tg
∓ (bottom)
conformations of PET. ...95Figure 4.4: 1st cooling and 2nd heating DSC scans for asr-PET. ...103
Figure 4.5: 1st cooling and 2nd heating DSC scans for p-PET ...104
Figure 4.6: 1st cooling and 2nd heating DSC scans for Self-Nucleated PET (95% as-PET/5% p-PET) ...104
Figure 4.7: CO2 absoprtion curves for asr-PET (upper) and nuc-PET (lower)...109
Figure 4.8: WAXS from rapidly melt-quenched asr- and p-PET films. All scattering data have been smoothed with the same Gaussian function. ...112
Figure 4.9: Load-Elongation curves for asr- and nuc-PET Fibers. ...114
Figure 4.10: PET fiber moduli (a) and tenacities (b). ...115
Figure 4.11: Repeated Self-Nucleation. ...117
Figure 4.12: Schematic representation of the preparation of precipitated-PET (p-PET) ...120
Figure 4.13: Schematic of the Magnetic Suspension Balance ...121
CHAPTER 1
1. Background – Polymer Inclusion Compounds
Macromolecules are more sensitive to processing than small molecules on account of their inherent long-chain flexible nature, which is imparted through various conformations, resulting in myriad sizes and shapes. Consequently, the behavior and properties of polymeric materials which depend on their structural organization can be readily modified through processing, as illustrated through the following example. Gel-spun Spectra poly (ethylene) (PE) fibers are extremely strong in the fiber direction and may be fabricated into light-weight armor, while molded articles, such as melt-blown PE garbage bags, are not nearly as strong, but have a much greater elasticity, even though the same polymer is used in both applications [1].
Research associated with polymer inclusion and coalescence phenomena is outlined schematically in Figure 1.1, using the cyclic host molecules cyclodextrins (CDs). This involves characterizing their behaviors and analyzing their properties and finally applying these morphologically novel materials. This section introduces the various hosts & guests used in our research, provides an overview of processing polymers via nano-confinement and subsequent release and the various analytical techniques used to characterize and analyze the behavior and properties of the polymers resulting from this nano-structuring process.
1.1 Guest Polymers
1.1.1 Poly (vinyl acetate) (PVAc)
PVAc is a commercial synthetic thermoplastic and belongs to the class of vinyl polymers. It has a molar mass of ~ 86 g/mol of repeat unit. PVAc was first synthesized by Dr. Klatte in Germany in the year 1912 but the potential for this polymer was not realized immediately. Later on Wacker Chemie developed commercial scale methods to produce vinyl acetate monomer (VAM) [CH2=CH(OCOCH3)], the raw material for PVAc, overcoming drawbacks in large scale manufacturing of PVAc from VAM [2].
Figure 1.2: Synthesis of PVAc [2]
produce VAM. Polymerization of VAM can be carried out using emulsion, suspension or solution-techniques, which may result in aqueous dispersions or solid resins of PVAc. A schematic for the synthesis of PVAc has been illustrated in Figure 1.2 [2].
PVAc produced by free radical polymerization is stereochemically atactic and so is amorphous in nature, with a glass transition temperature around room temperature. It is tasteless, odorless, and non-toxic, but not biodegradable. PVAc finds major application as an adhesive in packaging and wood gluing, chewing gum bases and in emulsions as a binder for coatings [2,3]. PVAc is also used as a precursor for manufacturing poly (vinyl alcohol) (PVOH), poly (vinyl butyral) (PVB) and poly (vinyl formal) (PVF). PVOH is used in barrier coatings for food packaging applications. PVB is used in automobiles as a plastic film in laminated safety glass, while PVF finds application in wire insulation [4].
1.1.2 Poly (methyl methacrylate) (PMMA)
PMMA is a transparent rigid thermoplastic polymer and belongs to the acrylic class of polymers. It was first synthesized by Rowland Hill and John Crawford in the 1930’s and was registered under the trademark ‘Perspex’ by Imperial Chemical Industries (ICI) in England. Around the same time, Otto Röhm of Rohm and Haas AG synthesized PMMA under the trade name ‘Plexiglas’ in Germany. E.I. du Pont de Nemours & Company introduced PMMA in the USA under the trademark ‘Lucite’ [4].
which is then converted to MMA. The presence of the pendent α-methyl group in the repeat unit and an atactic stereosequence generally keeps the polymer chains from packing closely into a crystalline structure, resulting in amorphous PMMA [4].
At room temperature PMMA is brittle in nature and not usually used in its pure state for commercial applications. PMMA is optically clear and has good mechanical properties. It has extremely high weatherability, but with a high sensitivity to electron radiation. It is used as a replacement for glass (Plexiglas) usually in combination with an additive to reduce the brittle nature of PMMA and also in microelectronics applications [3,4].
1.2Hosts
1.2.1 Cyclodextrins
Cyclodextrins are cyclic oligosaccharides and were discovered in 1891 [5]. Schardinger was the first to differentiate between different cyclodextrins based on the colors seen from their reaction with iodine [6]. Later, Pringsheim discovered that crystalline inclusion complexes can be formed between cyclodextrins and a range of organic compounds [7,8]. Freudenberg was the first to indicate the cyclic nature of these starches in 1930 [9]. Commercial production of cyclodextrins started in 1970 and research to investigate the practical applications of cyclodextrins has accelerated since then [10].
reaction and selectively precipitates a particular type of cyclodextrin. The non-solvent technique does not involve any complexing agent and thus yields a mixture of cyclodextrins. Figure 1.3 illustrates these processes [11].
Figure 1.3: Cyclodextrin Production; a) Solvent & b) Non-solvent methods [11]
complexing agent and the reaction conditions. Purification achieved in commercial productions is up to 98%. Further purification is possible by employing techniques like ion exchange chromatography and membrane filtration [11].
Figure 1.4: Cyclodextrins [12]
Cyclodextrin have α-1, 4 glycosidic linkages that bind together the starch molecules in a cyclic manner. There are three types of cyclodextrins that are of commercial interests. These are alpha- (α), beta- (β) and gamma cyclodextrins (γ-CD) consisting of 6, 7 and 8 glucopyranose units respectively. The dimensions of these cyclodextrins are shown in Figure 1.4 [12].
stability to acid hydrolysis depends on the time of exposure, temperature and strength of the acid. They are also resistant to UV and IR [13]. Cyclodextrins are relatively less soluble than their non-cyclic analogs due to stronger intermolecular hydrogen bonding. This can be altered by substituting a hydrogen atom or other group for the hydroxyl groups in its structure. Amongst the three CDs, β-CD has the lowest water solubility and this can be attributed to the intra-molecular hydrogen bonding within its structure. Also, γ-CD is more water soluble than α-CD [14].
Cyclodextrins have many applications. They are used to form inclusion complexes (ICs) with small or macromolecules, and can be used for food packaging, where the ICs are used to preserve flavors, protect active ingredients or to mask undesired odors/tastes [15]. In pharmaceutics, ICs are used for drug preservation and delivery applications [16]. For Personal Care, Cosmetics and Toiletries products CD-ICs are used as a means to control odor, for stabilization and to convert a liquid detergent into a solid commodity [17]. The agricultural field employs CD-ICs to maximize the effects of insecticides, fungicides and other specialty chemicals [18]. CD-ICs are also used in the paint industry to modify the rheology of paints.
1.2.2 Urea
This consists of four main steps, namely synthesis, purification, concentration and granulation. The process overview has been illustrated in Figure 1.5. In this method these components are reacted to yield ammonium carbamate (NH2-CO-O-NH4+), which in turn is reacted further to obtain urea by loss of a water molecule. The purification stage consists of removal of water, which is formed during synthesis, and also the removal of unreacted CO2 and NH3. The concentration step involves evaporation of water associated with urea. The process ends with the granulation step [19].
Figure 1.5: Urea manufacturing process [19]
1.3 Processing Polymers with Their Inclusion Compounds
1.3.1 Inclusion Phenomenon
Rotaxanes are molecular structures in which a cyclic molecule (host) encases another molecule (guest). This becomes a ‘polyrotaxane’ when the encapsulation assembly gets repeated, as in the case of macromolecular inclusion, wherein a single guest polymer chain gets covered up a number of cyclic host molecules. If the ends of a polyrotaxane are not terminated by bulky groups then the polyrotaxane is in equilibrium with un-included polymer and hence called a ‘poly-pseudorotaxane’. The two main types of polyrotaxanes have been illustrated in Figure 1.6. These assemblies occur at nano scale levels making it interesting to evaluate the effect of this molecular restructuring on the macroscopic properties of polymers [12].
Figure 1.6: Typical structures of polyrotaxanes [12]
(ε-caprolactone) (PCL)-γ-cyclodextrin inclusion complex, two PCL chains thread each γ-CD channel with a stoichiometry of 2:1 = PCL repeats:γ-CD. However the stoichiometry with respect to the polymer chain coverage can vary depending on the amount of γ-CD used in the inclusion complex formation process.Figure 1.7 illustrates formation of main chain type polyrotaxanes via cyclic-host and macromolecular guest inclusion where ‘m’ and ‘n’ denote number of cyclic host and polymeric guest repeat units, respectively. Depending on the ratio of ‘n’ to ‘m’ the resultant polymer chain coverage could either be stoichiometric (complete polymer chain coverage) or non-stoichiometric (partial polymer chain coverage).
Figure 1.7: Formation of Polyrotaxanes via cyclic-host and macromolecular guest inclusion
Different organic molecules that can be used as hosts (cyclic or not) include thiourea, hydroquinone, crown ethers, etc., but CDs and U are the two small molecule hosts most widely used to form polymer inclusion complexes.
1.3.1.1Cyclodextrin Inclusion
predominantly carried out using α-, β- and γ-CDs even though larger CDs are also available. For example, delta cyclodextrin (δ-CD), which has nine glucopyranose units, is available commercially, but does not have a regular truncated cone shaped structure like α-, β- and γ-CDs. Rather, its structure is collapsed and its cavity is smaller than γ-CD [20]. Small molecule guest inclusion compounds formed with cyclodextrins are used commercially with a large range of guests that include acids, ionic compounds, halogen compounds, aliphatic alcohols, aromatic compounds, monomers, dyes and drug molecules. Table 1.1 illustrates some of the examples of commercial small molecule CD-ICs applied in pharmaceutics [21].
Cyclodextrins can also form inclusion complexes with different polymers. Harada et al. were the first to report polymer-CD-ICs, when they successfully included polyethylene glycol (PEG) oligomers with different molecular weights in α-CD [22]. Prior to this work, in-situ polymerizations using CDs had been reported by Olga et al. [23]. The research groups of Harada [12] and Tonelli [1] have since investigated various polymer-CD combinations to improve the knowledge and understanding of the phenomenon of nano-confinement.
followed by their mixing, which yields the ICs. In the slurry method, firstly the CDs are partially dissolved (~50% w/w). The dissolved portion of CDs forms an IC and precipitates out making way for more CDs to dissolve thereby forming more ICs. In the paste technique the amount of water used to dissolve CDs is reduced to 20-30% w/w. In the dry mixing method water is not used at all during IC formation. This is not an efficient technique as it takes a lot of time to form the CD-ICs [21].
In this research, the co-precipitation technique has been employed in the formation of polymer-CD-ICs. The mechanism of inclusion in this technique is pretty straight forward. When a saturated solution of CD is prepared the hydrophobic cavities of the dissolved CDs contain water. When a polymeric solution (prepared in a good solvent for the polymer) is added to the CD solution the comparatively hydrophobic polymer chains push out the water inside the CD cavities as they are more stable inside the hydrophobic cavity than are the water molecules. Once the IC formation reaches the saturation point, the polymer-CD-IC precipitates out.
2. Table 1.1: Commercial CD-ICs [21]
the IC but does not confirm if the polymer chains are inside the CD cavities or if it is just a mixture of un-included guest polymer and free CD. Having said this, it has nevertheless usually been observed that the peaks in a stoichiometric IC that correspond to the polymeric guests are usually suppressed and sometimes with different absorption frequencies in comparison to those observed in physical polymer/CD mixtures. This can be taken as an indication of inclusion of polymer chains in the CD cavities. Figure 1.9 illustrates FTIR data for the inclusion complex of poly (L-lactic acid) (PLLA) formed with α-CD.
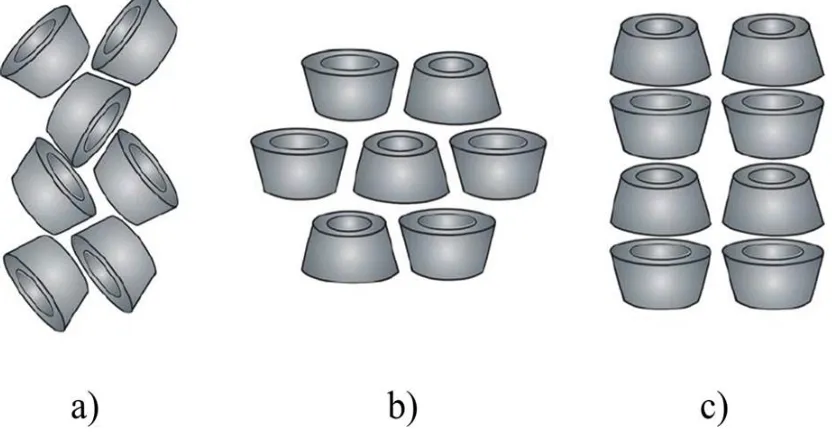
Figure 1.8: CD structures: a) herringbone-type cage, b) layer-type cage and c) columnar [21]
like glass transition or melting, during a heating scan are absent in the thermographs of their corresponding stoichiometric CD-ICs. This occurs because when polymers are processed via
nano-confinement each polymer chain gets threaded by CD molecules separating it from the other chains. As the polymer chains are not in contact with each other, they are unable to organize in to structures that are responsible for the thermal transitions that are reflected in their DSC thermographs.
Figure 1.9: FTIR data for PLLA-α-CD-IC.
Angle X-ray Diffraction (WAXD) patterns. The WAXD pattern of an uncomplexed CD that has a cage structure is distinct from that of a polymer-CD-IC, which has a columnar structure. The cage structure shows better resolved peaks in its WAXD pattern, while the columnar structure is comparatively more featureless, exhibiting fewer peaks. Figure 1.10 illustrates the change reflected by the WAXD data for PMMA-γ-CD-IC [25]. Cage γ-CD has characteristic peaks at 2θ = 12.4, 16.5, 18.8 and 23.4°. PMMA-γ-CD-IC crystals show a major peak at 2θ = 7.5°, which is absent for cage γ-CD and is characteristic for γ-CD in the channel structure [26].
Figure 1.10: WAXD pattern for a) PMMA-CD-IC and b) as-received γ-CD [25]
state. As the environment around the hydrogen and carbon atoms is altered during IC formation, there occurs a shift in corresponding resonance peaks and this shows up in the NMR data. Also the peaks corresponding to the guest polymers, which are absent in uncomplexed CDs are also visible in the NMR spectra of their ICs [21].
Figure 1.11: Processing polymers with CDs
crystals. There is a lot of literature available concerning stoichiometric ICs of CDs with various guest polymers like PLLA [27], PCL [28], poly (ethylene terephthalate) (PET) [29], etc. wherein these ICs have been successfully prepared and characterized. It is also possible to intimately blend polymers, which otherwise phase separate when processed by the usual blending techniques of melt-mixing or solution blending, by simultaneously nano-structuring them through formation of their common inclusion complexes. Rusa et al. prepared a binary blend of PLLA and PCL through their common α-CD inclusion [30], while Rusa & Uyar et al. prepared a ternary blend between PVAc, PMMA and poly carbonate (PC) to obtain novel structures [31]. Shuai et al. included a PCL-PLLA di-block copolymer in α-CD to alter its biodegradability through mixing of the PCL and PLLA blocks following coalescence [32].
In another study, Rusa et al. evaluated competitive CD-IC formation, which suggested that the geometrical compatibility and hydrophobicity of the guest polymer affects the inclusion phenomenon. In this case PLLA-α-CD ICs were suspended in a PCL solution for a specific amount of time and then the IC was filtered and analyzed. It was found that PLLA chains in the IC were replaced by PCL, suggesting competitive inclusion resulting in formation of the more stable PCL-α-CD ICs [33]. Polymers that are not solid at room temperature can also be included in CD channels. One such example is poly (di-methyl siloxane) (PDMS), which was included in γ-CD. Figure 1.12 provides the WAXD data which illustrates the inclusion phenomenon (observation of a pear at 2θ ~ 7.5o as seen in columnar ϒ-CD-ICs) [34].
Non-stoichiometric ICs (ns-ICs) are obtained when excess guest polymer is used during inclusion complexation. This results in CD-ICs with partial polymer chain coverage, wherein there are “dangling”/connecting chain portions from/in between CD-IC crystals. Behavior of ns-ICs is different from the stoichiometric CD-ICs on account of the unincluded polymer chains. Figure 1.13 illustrates FTIR data for ns-ICs of PCL with α-CD in varying ratios of PCL to α-CD. As the ratio of polymer to α-CD increases the PCL carbonyl peak in the CD-IC spectrum increases (~1730 cm-1, corresponds to C=O in PCL).
Figure 1.14: a) Nylon 6 and b) Nylon 6 + 2% 3:1 ns-IC [35]
for the rest of the polymer chains. Figure 1.14 shows polarized optical micrographs for bulk unmodified Nylon 6 and for Nylon 6 mixed with 2% of 3:1 Nylon 6-α-CD-ns-IC both crystallized from the melt. It is clearly evident that adding the ns-ICs results in smaller crystals that are uniformly distributed, as compared to larger crystals non-uniformly distributed in the unmodified bulk Nylon 6 [35].
For amorphous polymers, their ns-ICs show a higher glass transition temperature (Tg) for the unincluded chain portions than the unmodified polymer, which increase as the polymer to CD ratio is reduced. The ns-ICs can also be used to blend polymers, but the blending is not as efficient as the one obtained through formation of stoichiometric common CD-ICs. It has been observed that PVAc/PMMA-ns-γ-CD-ICs show three phases, which include phase separated PMMA-rich and PVAc-rich phases and an intermediate miscible phase whose composition can be varied depending on the PMMA/PVAc feed ratio [36].
1.3.1.2Urea Inclusion
hydrogen bonding [40]. Polymer inclusions with urea are usually done by a co-crystallization method. Different polymers that can form ICs with urea include poly (ethylene oxide) (PEO) [41], PLLA [42], polypropylene (PP) [43], etc. Similar to polymer-CD-ICs, FTIR spectra of polymer-U-ICs show peaks corresponding to both urea and polymer. WAXD data depends on the size of the guest polymer, which in turn relates to the size of the cavities formed by urea. PCL-U-IC [44] has a hexagonal structure, in comparison to the tetragonal structure of PP-U-IC [43]. It is evident from DSC data of U-ICs that the IC crystals melt at a higher temperature than pure U [44] on account of the difference between the crystal structures of pure urea and U-ICs. U-ICs also do not show the thermal transitions of the guest molecules, because they are completely covered by U channels similar to what is observed in the DSC thermographs of polymer-CD-ICs.
1.3.2 Polymers Coalesced from Their Inclusion Compounds
The CD- and U-ICs formed with polymers can be coalesced to obtain the guest polymers through careful and complete removal of the hosts. This can be done by washing with water (since both CDs and urea are water soluble) or in some instances with enzymes or acids. PCL-α-CD, for example, requires very brief treatment with hydrochloric acid for complete removal of α-CD.
Polymers coalesced from their CD- or U-ICs have behaviors and properties that are distinct from their normally processed analogs, i.e., the as-received (asr-) polymers. This includes higher crystallization temperatures for coalesced crystallizable guests [45] or higher Tgs for coalesced amorphous guest polymers [21]. Coalesced polymers also possess higher amorphous densities (even with same levels of crystallinity as that of asr-polymer) on account of the structural rearrangement to extended and largely un-entangled chains that yields better orientation and closer packing in the amorphous domains [46]. The coalesced polymers are also stable to repeated melt processing, but lose their properties if dissolved in a good solvent. PET processed by coalescence from its γ-CD clearly illustrates this characteristic of coalesced polymers. [47]. Crystallizable polymers coalesced from both their CD- and U-ICs are stable to long time annealing at temperatures above their melting points [28, 48]. Polymer blends coalesced from their common stoichiometric CD-ICs exhibit complete miscibility. This can be confirmed through observation of a single Tg, which occurs between the Tgs of the individual guest polymers [21].
temperature than the asr-polymer. Thus providing sites for crystallization and resulting in uniform crystal sizes and distributions [49]. Self-nucleation offers a clean way to improve the properties of polymers and does not complicate their recycling, since addition of foreign substances is avoided. Another application is to prepare self-reinforced composites using coalesced/nucleated and asr-films or fibers. This technique solves the problem of poor interfacial adhesion in polymer composites by providing extensive mixing at the interface, because the self-nucleated reinforcing films and fibers are chemically the same, and only morphologically different and spatially distinct from the asr-polymer matrix [49, 50].
1.4 Overview of Analytical techniques for Polymer Characterization
1.4.1 Fourier Transform Infrared (FTIR) Spectroscopy
FTIR Spectroscopy is a non-destructive polymer characterization technique that provides information about their chemical bonding and molecular structure. This analytical technique works on the principle of the vibrations of chemical bonds occurring at their characteristic frequencies. When the polymer specimen is subjected to a modulated IR beam it absorbs infrared energy at frequencies that are characteristic of that molecule and the sample’s vibrational pattern at different frequencies is transformed into an IR absorption plot as a function of wave number. The resulting FTIR spectrum is then analyzed and usually compared with a FTIR library to get a spectral match in order to identify the polymer.
resolution can be varied from 0.5 to 32 cm-1. The sample compartment is purged to remove the effect of the presence of moisture and CO2 on the spectra. The source in the FTIR instrument is infrared energy (Globar), and passes through an aperture, which controls the energy presented to the sample. An Interferometer is an important part of the instrumental assembly. Radiation from the IR source is directed through the sample cell to a beam splitter. Half of the radiation is reflected from a fixed mirror, while the other half is reflected from a mirror which moves continuously over a distance of about 2.5 micrometers. When the two beams are recombined at the detector, an interference pattern is produced.
A Helium–Neon Laser beam is introduced into the beam leaving the interferometer and this has a few important functions. Since IR is not detected by human eye, it permits us to place the sample in the sample compartment exactly between the incident beam and the detector. It improves the accuracy of each measured frequency, and helps in synchronization of multiple scans. The beam from the sample goes to the Deuterated Triglycine Sulfate (DTGS) detector, which measures the interferogram signal. The measured signal is digitized and sent to the computer, where the Fourier transformation takes place. The final infrared spectrum is then presented to the user for interpretation [51].
Infrared spectral studies were conducted with a Nicolet Nexus 470 FTIR spectrometer in the range 4000 - 400 cm-1, with a resolution of 4 cm-1 and 64 scans were collected for each sample. FTIR data were analyzed by using Omnic software.
1.4.2 Nuclear Magnetic Resonance (NMR) Spectroscopy
The basic property on which NMR works is the magnetic spin (I) associated with atomic nuclei, which depend on their atomic numbers and weights. Atoms with I = 0 (e.g., 12C) do not have a spin and thus no magnetic moment, which is essential for NMR. Atoms/isotopes with I=1/2 like 13C and 1H possess nuclear magnetic moments and evidence NMR spectra. For polymer analysis by 1H NMR, the samples are usually prepared in a deuterated solvent, so there are no solvent protons to interfere. Chemical shift (δ in ppm) is an important parameter in NMR analysis. The reference for chemical shift in 13C or 1H NMR is tetramethylsiloxane (TMS, δ=0). The δ can be calculated by comparing the frequency of resonance absorptions of the chemical groups of the polymer to the resonance frequency of the reference TMS [52].
1.4.3 Wide Angle X-ray Diffraction (WAXD)
WAXD is an important tool to study crystal structure and measure crystallinity in polymers. X-rays are electro-magnetic waves with a wavelength range ~ 0.1-100 Å. X-rays are produced when electrons ejected from a hot filament (cathode) strike a metal target (anode). For X-ray diffraction a highly monochromatic source is preferred to get a clear diffraction pattern. Semicrystalline polymers consist of amorphous and crystalline domains. X-ray diffraction from polymers occurs through apparent bending of the waves around the crystals and subsequent movement through the amorphous phase. The angle (2θ) at which the diffracted X-rays are collected can be of two types; 2θ < 5o (small angle) or 2θ > 5o (wide angle). WAXD is useful in analyzing single crystals and crystal structures, while SAXD is useful in studying the overall morphology in polymers [53].
There are four basic steps in analysis by WAXD, namely X-ray generation, diffraction, detection, and interpretation. The WAXD instrument setup starts with the source that generates X-rays and incident beam optics to align the X-rays with the sample. Next in the assembly are the sample chamber and the goniometer that helps rotate the sample. Once the X-rays pass through the sample, they are then made to go through a beam stopper which filters the unscattered radiation (to protect the detector from damage). Finally the diffracted X-rays are collected at the detector and the data is analyzed. WAXD can be performed on powders or on fibers, as well as single crystals [53].
produces X-rays with a wavelength of 1.54Å. The diffractograms were obtained with a 2θ range of 5-50o, and data were analyzed using TXRD 5.1 software.
1.4.4 Differential Scanning Calorimetry (DSC)
DSC is based on the principle that the response of polymers varies with changes in temperature. DSC is a quantitative analytical tool that profiles caloric heat changes from a sample pan with respect to an empty reference pan. A DSC thermogram helps in the analysis of thermal properties related to phase changes like glass transition, crystallization, and melting behavior. It measures endothermic and exothermic heat flows in the polymer samples, which is done by monitoring the power (mW) required to maintain the sample and its pan at the same temperature as the empty reference pan. Prerequisite for this instrument is the knowledge of thermal stability of the polymer sample, which can be obtained from Thermo-gravimetric analysis (TGA). TGA tells us about the percentage loss in weight of a polymer as a function of temperature. From TGA data a suitable temperature range can be chosen for DSC analysis in order to prevent sample degradation.
DSC thermograms were obtained using a Perkin-Elmer Model 7 Differential Scanning Calorimeter (DSC). Perkin Elmer Diamond DSC is a power compensated DSC which measures the power required to keep the reference pan at the same temperature as the sample pan. The instrument consist of two aluminum pans, one containing sample and other used as a reference placed in a holder above the furnace. Temperature range for the instrument is from -50 to 700 oC and is monitored with thermocouples. For samples that may have glass transition temperatures below room temperature, there is an Intracooler 2 which can achieve temperatures down to -50 oC. A nitrogen gas cylinder is used for purging air (O2 and H2O) from the sample. The Pyris software analyzes the DSC plots and helps in the calculation of the transition temperatures and their associated enthalpies [54].
About 3-5 mg of sample was used in all tests. Samples were sealed in aluminum pans, and depending on the sample geometry (pellet or powder/flakes) either a volatile or non-volatile pan was used. The instrument was calibrated before each set of scans with Indium or Tin, depending on the temperature range of interest. Nitrogen was used as the purge gas to provide an inert atmosphere and to prevent sample degradation. The procedure that was employed for DSC scanning of all the samples is described as follows:
Hold Heat Hold Cool Hold Heat
1.4.5 Density Measurements
The densities of polymer films were measured by floatation using water (W) and 40% Sodium Bromide (NaBr), which have densities of 1 and 1.4 g/cm3, respectively, that are lower and higher than the density of PVAc. Small pieces of both asr- and c-PVAc films were placed in a known volume of water, vol(W) containing a magnetic stir-bar, where they sunk to the bottom of the volumetric cylinder, which was then sealed with aluminum foil. The NaBr solution was slowly added from a burette with stirring until each PVAc film was lifted and became suspended in the solvent mixture, and the volume of added NaBr solution, vol(NaBr), was noted. The PVAc densities were then obtained from:
1.4.6 Thermo Gravimetric Analysis (TGA)
The TGA technique helps us in analyzing the degradation of polymers and their IC samples by monitoring the mass of a sample as a function of temperature which can be done in the presence of air or an inert medium like nitrogen. Other applications of TGA include studying the effect of residual solvents/moisture and presence of additives on the degradation profile of samples.
signals proportional to weight change. The sample pan is made of platinum and can accommodate 5-10 mg of the sample. The furnace surrounds the sampler and holder and contains nitrogen gas. It is programmed for linear heating rates. The temperature range for the instrument is 25 to 950 oC [55], the heating rate can be varied between 0.1 - 200 oC/min, and the temperature is maintained using a thermocouple. The purge gas system removes residual gases and maintains a constant environment.
The software plots % weight of sample vs. temperature and it helps in analyses of weight loss and important temperatures at which degradation occurs. TGA measures the change in weight of a sample with respect to time or temperature which tells us about its thermal stability.
1.4.7 Dynamic Mechanical Thermal Analysis (DMTA)
constant frequency or vice versa. In our studies we have used TA Instruments Q800 Dynamic Mechanical Analyzer with an attached shear-sandwich clamp. In this assembly equal sized films are sheared between two fixed outer plates and a moving inner plate. A strain was selected from the LVE range and frequency was varied at a constant temperature. The instrument has a furnace to raise the temperature of polymer samples and also a nitrogen cooling unit. Data were analyzed using TA’s Universal Analysis software [56].
1.4.8 Nano-indentation
Nano-indentation is a non-destructive technique for measuring the mechanical properties of polymeric surfaces. It makes use of a probe or an indenter whose mechanical properties are known. There are different types of indenter geometries but the three sided indenters (e.g. Berkovich Indenter) are used more commonly for nano-scale evaluation.
modulus of the films. All tests were performed at ambient temperature (approximately 20 oC). Each of the sample films was indented 9 times in a 3×3 square pattern using a Berkovich diamond tip.
Figure 1.16: Load-Displacement Curve [57]
Reduced Young’s modulus (Er) and hardness values were all determined automatically by the software while the actual value (E) can be calculated from the formula shown below, where υ is the Poisson’s ratio. The software helps in the automatic scanning of the surface of the film by adjusting the tip height based on the force feedback and mapping surface topography.
1.5 References
1. A. Tonelli; Beilstein Journal of Organic Chemistry; 8: 1318 (2012) and ADV. Polym. Sci., 222, 115 (2009)
2. M. Amann and O. Minge; Advanced Polymer Science; 245: 137 (2012) 3. Polymer data handbook, Oxford University Inc.; 882 (1999)
4. Encyclopedia Britannica – Academic Online Edition 5. A. Villiers; Compt. Rend. Acad. Sci.; 112: 536 (1891) 6. F. Schardinger; Zentalblatt Bakte 2; 29: 188 (1911)
7. H. Pringshei; Chemistry of the Saccharides, McGraw-Hill (1932)
8. R. Walton; Comprehensive Survey of Starch Chemistry, Chemical Catalog Company (1928)
9. K. Freudenberg, G. Blomqvist, L. Ewald, K. Soff; Ber. Dtsch. Chem. Ges. 1; 69: 1258 (1936)
10.J. Szejtli; Chem. Rev; 98: 1743 (1998)
12.A. Harada, A. Hashidzume, H. Yamaguchi, Y. Takashima; Encyclopedia Of Polymer Science and Technology; DOI: 10.1002/0471440264.pst573 (2012)
13.J. Szejtli; Chem. Rev.; 98: 1743 (1998)
14.J. Szejtli; Journal of Inclusion Phenomena and Molecular Recognition in Chemistry, 14: 25 (1992)
15.L. Szente, J. Szejtli; Trends in Food Science & Technology; 15: 137 (2004) 16.J. Szejtli; Medicinal Research Reviews, 14: 353 (1994)
17.N. Prasad, D. Straus, G. Reichart; United States Patent: 6,287,603, (1999) 18.J. Pitha; United States Patent: 6,001,821 (1998)
19.J. Copplestone, C. Kirk, I-Chemicals-A-Ammonia and Urea catalogue 20.S. Immel; Ph.D. Dissertation; Darmstadt University of Technology (1995) 21.T. Uyar; Ph.D. Dissertation, North Carolina State University (2005) 22.A. Harada, M. Kamachi; Macromolecules; 23: 2823 (1990)
23.N. Ogata, K. Sanui, J. Wada; J Polym Chem.; 14: 459 (1976)
24.W. Saenger; Inclusion Compounds, Vol. 2 (Atwood J., Davies J., MacNiclol D.Eds) Academic, London, chap 8 (1984)
25.T. Uyar, C. Rusa, M. Hunt, E. Aslan, J. Hacaloglu, A. Tonelli; Polymer; 46: 4762 (2005) 26.T. Lind, T. Kuge; Agr Biol Chem; 34: 568 (1970)
27.A. Gurarslan, A. Joijode, A. Tonelli; J. Poly. Sci-Part B Poly Phys.; 50: 813 (2012) 28.B. Williamson, R. Krishnaswamy, A. Tonelli; Polymer; 52: 4517 (2011)
30.C. Rusa, M Wei, X. Shuai, T. Bullions, X. Wang, T. Uyar, A. Tonelli; J. Poly. Sci-Part B Poly Phys.; 42: 4207 (2004)
31.C. Rusa, T. Uyar, M. Rusa, M, Hunt, X. Wang, A. Tonelli; J. Poly. Sci-Part B Poly Phys.; 42: 4182 (2004)
32.X. Shuai, M. Wei, F. Porbeni, T. Bullions, A. Tonelli; Bio-macromolecules; 3: 201 (2002)
33.C. Rusa, J. Fox, A. Tonelli; Macromolecules; 36: 2742 (2003) 34.F. Porbeni, E. Edeki, I. Shin, A. Tonelli; Polymer; 42: 6907 (2001)
35.A. Mohan, X. Joyner, R. Kotek, A. Tonelli; Macromolecules; 42: 8983 (2009) 36.G. Antony; M.S Thesis, North Carolina State University (2011)
37.M. Bengen; Ger. Pat. Appl. OZ; 123438 (1940)
38.E. Weber, M. Czugler; Molecular Inclusion and Molecular Recognition-Clathrates II; 149: 45 (1988)
39.H. Yang; A. Tonelli, Controlling the Stereoregularity of Polyacrylonitrile and Its Determination Using Small-Molecule Host Inclusion Compounds, MS Thesis (2006 40.M. Gdaniec; In Channel Inclusion Compounds; Encyclopedia of Supramolecular
Chemistry; Taylor & Francis: New York, 223 (2007)
41.N. Vasanthan, I. Shin, A. Tonelli; Macromolecules; 29: 263 (1996)
42.C. Howe, N. Vasanthan, C. MacClamrock, S. Sankar, I. Shin, I. Simonsen, A. Tonelli; Macromolecules; 27: 7433 (1994)
45.B. Williamson; Ph.D. Dissertation, North Carolina State University (2010) 46.A. Gurarslan; M.S Thesis, North Carolina State University (2011)
47.J. Vedula, A. Tonelli, J. Poly. Sci-Part B Poly Phys., 45: 735 (2007) 48.A. Gurarslan, J. Shen, A. Tonelli; Macromolecules; 45: 2385 (2012) 49.A. Gurarslan and A. Tonelli; Macromolecules; 44: 3856 (2011)
50.A. Gurarslan, J Shen, A. Tonelli, Polymer Materials-Sci. &. Engg; 104: 407 (2012) 51.L. Åmand, C. Tullin; The Theory Behind FTIR analysis (1996)
52.T. Kitayama, K. Hatada; NMR Spectroscopy of Polymers (2004)
53.N. Kasai, M. Kakudo; X-ray Diffraction of Macromolecules; Springer Series in Chemical Physics (2005)
54.J. Kenkel; Analytical Chemistry for Technicians; 3rd edition (2005) 55.Perkin Elmer Pyris 1 TGA-Brochure.
http://las.perkinelmer.com/content/RelatedMaterials/Brochures/bro_pyris-1-tga.pdf 56.TA Instruments DMA-Brochure
CHAPTER 2
2. Glass-Transition Temperatures of Nano-Structured Amorphous Bulk Polymers and their Blends
Abhay S. Joijode, Gerry J. Antony, Alan E. Tonelli*
Fiber & Polymer Science Program North Carolina State University
Campus Box 8301 Raleigh, NC 27695-8301
* This chapter has been taken from the following peer-reviewed publication,
Citation: Journal of Polymer Science, Part B: Polymer Physics, 51, 1041–1050 (2013)
2.1 Abstract
comparison, several conclusions were reached concerning how their molecular weights, the organization of chains in their coalesced samples, and the degree of constraint experienced by un-included portions of their chains in (n-s)-γ-CD-IC samples with different stoichiometries affect their chain mobilities and resultant Tgs.
Figure 2.0: Table of Contents (TOC) Figure
2.2Introduction
Somewhat related are observations of bulk guest polymer samples coalesced from their inclusion compounds (ICs) formed with small molecule hosts [2, 3], such as those with host cyclodextrins (CDs) in Figure 2.1. The polymer chains included in ICs formed with CDs and other small molecule hosts, such as urea (U), occupy narrow parallel channels, which in the case of CD-ICs range in diameter from ~0.5 – 1.0 nm. Consequently, not only are they separated from their neighboring chains, through IC confinement, but they are also highly extended. When the host small molecule lattice is carefully removed, a bulk sample of coalesced IC guest polymers is obtained.
Figure 2.1: Schematic illustration of the polymer nano-confinement in and release from their crystalline ICs formed with CD hosts
techniques from their solutions and melts. This is likely a result of the differences between highly extended un-entangled polymer chains found in the narrow channels of their ICs and the randomly-coiling entangled polymer chains in their solutions and melts. We believe [4] that coalesced samples of amorphous polymers consist of small un-oriented regions containing extended and largely un-entangled polymer chains, because the volume of individual un-oriented crystals in the polymer-CD-IC powders are ~10 times the volume of the polymer coalesced from each.
Such nano-structured amorphous polymer samples, as obtained through confinement in and subsequent release from their ICs, have been observed [2-4] to have glass-transition temperatures, Tgs, substantially elevated above their normally processed samples. This is believed to result from the closer packing of extended un-entangled coalesced chains which produce samples with higher densities3. Here urea (U) and gamma-cyclodextrin (γ-CD) were utilized to form crystalline ICs with low [5,6] and high [7] molecular weight poly(vinyl acetate) (PVAc), poly(methyl methacrylate) (PMMA), and their blends as included guests. Upon careful removal of the host crystalline U and γ-CD lattices, nano-structured coalesced bulk PVAc, PMMA, and PVAc/PMMA blend samples were obtained, and their Tgs were measured.
their molecular weights, the organization of chains in their coalesced samples, and the degree of constraint experienced by un-included portions of their chains in (n-s)-γ-CD-IC samples with different stoichiometries affect their chain mobilities and resultant Tgs.
2.3Methods and Materials
Atactic PMMA (Mw = 350 kDa), atactic PVAc (Mw = 167 kDa), and U were purchased from Aldrich Co.. γ-CD was obtained from Wacker Pharmaceuticals, while dioxane was obtained from Fischer Scientific.
Inclusion complexes (ICs) of PMMA, PVAc and their blends with U were obtained by a co-crystallization process. In this method a saturated solution of urea in de-ionized (D-I) water was added drop-wise to dilute solutions (0.5% wt./vol.) of PMMA, PVAc and their blends prepared in dioxane at 50 oC. A white precipitate was observed upon addition of the U solution to the polymer solutions. After complete addition of the urea solution, the suspension was cooled to room temperature and kept overnight without stirring. The resultant U-ICs were filtered, washed with dioxane to remove uncomplexed polymer and finally dried overnight at room temperature. The polymer U-ICs were then coalesced by washing them with excess DI water for about 1 hour at 50 oC, and were finally filtered and dried overnight at room temperature.
get different coverage ratios from 2:1 - 6:1. A single γ-CD can house ~ three repeat units of PMMA and PVAc, so a fully covered stoichiometric γ-CD-IC essentially contains one γ-CD for every three repeat units of the guest polymer. As an example, we doubled the relative amount of polymer (compared to the amount used for the fully covered stoichiometric IC) to form a 2:1 (n-s)-polymer-γ-CD-IC. Similarly, we used the same process to calculate the amount of polymer required to form non-stoichiometric 3:1 and 6:1 γ-CD-ICs containing excess PVAc and/or PMMA. The polymer solutions were stirred at 60 oC on a hot plate for about 5 minutes. The aqueous solution of γ-CD was added drop-wise to the polymer solution with continuous stirring, stirring was continued at this temperature for about 3 hours, and then cooled to room temperature before stirring for an additional 3 days. After this period, the precipitate was filtered and dried in a vacuum oven. In addition to the polymer blends, neat (n-s)-polymer-γ-CD-ICs were individually made with each polymer in the same ratios as used for their blends.
to purge the furnace. Samples were heated from 25 to 800 oC at a rate of 10 oC per minute and Pyris software was used to analyze the data. Finally, DSC thermal scans were performed with a Perkin Elmer Diamond DSC-7 instrument and TA Instruments Q1000 differential scanning calorimeter. All DSC scans followed a Heat-Cool-Heat profile and the samples were held above their glass transition/melting temperatures after the first heating scan for a substantial amount of time to get rid of prior processing history. The heating and cooling rates used for U, U-ICs, physical mixture of polymer and U (same ratio as used in IC preparation) and (n-s)-γ-CD-ICs (unless mentioned otherwise) were 20 oC /min. The asr- and c-polymers and their blend samples were heated at 5 oC /min and were rapidly cooled at 50 oC/min. Nitrogen was used as the purge gas. DSC data were analyzed with Pyris software.
2.4Results and Discussions
Stoichiometric Inclusion Complexes and Coalesced Polymers:
thermal transitions reflected in their DSC thermographs. The coalesced polymers obtained from these γ-CD-ICs exhibited higher Tgs on account of largely extended and un-entangled chain morphologies achieved through the nano-confinement and subsequent release processes.
In this section we discuss PVAc and PMMA processed in the above manner with U as IC host and compare the findings to those observed using their γ-CD-ICs. Vibrational peaks observed for the PVAc-U-IC are slightly shifted when compared to the peaks observed individually for U and PVAc, suggesting possible interactions between the two components in the IC, which is similar to that observed with other polymer-U-ICs [8-11].
Figure 2.2 displays the FTIR spectra for U, PVAc-U-IC and asr-PVAc, while the Table adjacent to the spectra shows that the peaks in PVAc-U-IC exhibit strong absorptions for bonds and functional groups present in both bulk U and PVAc. The FTIR spectrum for PVAc-U-IC shows peaks for amino and carboxylic groups observed in U and also exhibits peaks from carboxylic and methyl groups from the acetate groups present in PVAc, thus confirming the existence of both in the IC. The change in the crystal structure resulting from the polymer inclusion process can be evaluated from some of the peak shifts observed in its FTIR spectrum. For example, the carbonyl (C=O) stretching vibration in U has shifted from 1675 to 1681 cm-1, while the amino (N-H) bending vibration at 1590 cm-1 has shifted to 1596 cm-1. FTIR results indicate the presence of both PVAc and U in the complex, but only suggest and do not confirm if guest PVAc chains are included in the continuous columnar cavities of the host U or if it is simply a physical mixture.
The FTIR spectra of c-polymers obtained from their U-ICs (Figure 2.3) are virtually identical to those of their asr-polymers, thus suggesting that there is no difference in the chemistry of asr- and c-polymer samples, and that inclusion complex formation and coalescence are merely physical processes. Also, the slight shift in the peak positions of c-polymers with respect to their asr-samples can be attributed to the change in their conformations resulting from the inclusion and coalescence processes. The c-PVAc FTIR spectrum does not show any observable traces of U. To confirm this observation, c-PVAc was analyzed using 13C-NMR, which is more sensitive than FTIR for detecting traces of U as seen in Figure 2.4. The carbonyl carbon resonance in c-PVAc was observed at ~ 170 ppm [12]. The carbonyl (C=O) peak in urea is located at ~ 161 ppm [13] and was absent in the c-PVAc spectrum, thus confirming the fact that the coalescence process completely removed urea from the inclusion complex.
TGA data helps in understanding the decomposition profile of a sample, and can provide another means to confirm the presence of both polymer and U in their ICs. The decomposition of U into ammonia and cyanic acid followed by formation of an intermediate biuret (which decomposes into the final residues) is well known and can be represented as follows:
NH2CONH2 NH3 + HNCO H2N–CO–NH–CO–NH2 Decomposition of Residues
Figure 2.5: TGA data for urea and PVAC-U-IC
shifted when compared to pure U due to the presence of the additional included guest component [16]. Similarly the decomposition transitions for PVAc-U-IC were shifted when compared to U and this difference is also evident in the derivative plots of the TGA curves in Figure 2.5. Careful observation of the TGA curves between the temperature range of 300 to 550 oC shows the presence of an addition thermal transition for PVAc-U-IC. The thermal transition at ~400 o C can be attributed to the decomposition of the deacetylation products of PVAc [17], thus confirming the presence of both components in the IC.
Figure 2.6: DSC observed glass transitions for U, P-U-ICs, and their physical mixtures
suggesting complete inclusion of the polymer-IC guest, while their physical mixtures show Tgs indicating there is no interaction between them.
Figure 2.7 shows the heating scans for asr- and c-polymers, and there it is seen that both c-polymers have higher Tgs. These observations are closely similar to the behavior of coalesced PVAc and PMMA obtained from their γ-CD-ICs [5] and can be attributed to the better packing of chains in the largely un-entangled extended chain morphologies, resulting from their processing with urea. Solution-cast PVAc does not show any increase in its Tg, thus confirming the fact that the improvement in the Tg of coalesced polymers is a result of the IC formation and coalescence processes. PVAc with molecular weights of 13 and 167 kDa that were coalesced from their γ-CD- and U-ICs, respectively, showed Tgs of 36 and 41 oC (see Figure 2.8). This difference in Tgs seems rather small considering the over one-order of magnitude difference in their molecular weights.
made because c-polymer samples are believed to be comprised of largely extended and un-entangled chains, while the chains in asr-samples are randomly-coiling and un-entangled (See Figure 2.1).
Non-Stoichiometric Inclusion Complexes:
For the neat (n-s)-γ-CD-ICs we observe shifts in the Tgs of the un-included portions of PMMA and PVAc chains to higher temperature compared to those of both their as-received and coalesced neat samples. For the neat (n-s)-PVAc-γ-CD-ICs in Figure 2.8 and Table 2.1, we observe higher glass transition temperatures as we progressively increase the quantity of γ-CD added to the preparation mixture. In other words, as the average lengths of the un-included PVAc chains decrease their Tgs increase, consistent with the expected increasing constraint placed on shorter un-included PVAc chain portions emerging from their (n-s)-γ-CD-ICs. For example, the Tg observed for the 6:1 (n-s)-PVAc-γ-CD-IC with the longest un-included chain portions is close to that of c-PVAC obtained from its neat γ-CD-IC.
Table 2.1: Tgs of (n-s)-PVAc-γ-CD-ICs
Sample PVAc (g) γ-CD (g) Tg (oC)
asr-PVAc - - 28
2:1 0.369 0.928 49
3:1 0.369 0.615 49
6:1 1.107 0.928 44
constraint placed on the un-included “dangling” chain portions by the ordering of the remaining included polymer chain portions that are forced to arrange themselves within the γ-CD cavities [20].
It has been shown that the PVAc coalesced from their stoichiometric γ-CD-ICs has a largely extended chain configuration with distinct properties that are distinct from those of its as received analog which has a random coiled morphology. We felt it would interesting to investigate PVAc coalesced from their ns-γ-CD-IC that has dangling chains which exhibit higher Tg. For this, we prepared a 2-1-ns-PVAc-γ-CD-IC, coalesced it and analysed its thermal behavior (See Figure 2.10).
Figure 2.9: Channel structure ofa polymer-γ-CD-IC. 0.4 polymer chains/nm2 of γ -CD-IC crystal surface in the case of PVAc and PMMA, [21] which are singly included in each channel protruding polymer chains form Dense Polymer Brushes ~ half the density of chains in bulk polymer crystals [22]
is not unexpected since the dangling chains in the ns-ICs have a high Tg and this behavior stays even after the coalescence process.
PMMA/PVAc Blends obtained from Nano-confinement:
Blending two or more polymers offers a way to obtain a single functional material with properties that possess, or hopefully even surpass, the desired properties of its constituent polymers. Blending can be achieved by various techniques, but the most popular is casting from their common solvents. Miscibility in solution-cast polymer blends depends on many factors, such as type of solvent, evaporation rate, composition of the casting solution, etc. Studies done previously on PMMA/PVAc blends found that they are generally not miscible [6]. Miscibility can be achieved by treatment with some solvents [23], but these blends phase separate when processed at temperatures above their Tgs [6].
Table 2.2: Hansen Solubility Parameters for PMMA and PVAc [24]
Polymer
δ
dδ
pδ
hbδ
J1/2/cm3/2 or MPa0.5
PMMA 15.6 10.5 5.2 19.5
PVAc 15.7 11.4 7.8 20.9
hydrogen bonds while estimating δ as shown in the following equation, and the δ values for PMMA and PVAc have been summarized in Table 2.2. δ values and structure for PMMA and PVAc are quite similar and this suggests potential for polymer blend miscibility mainly through hydrogen bonding as illustrated in Figure 2.10. In this study we have used γ-CD and U inclusion for blending PMMA and PVAc.
δ
2=
δ
2d+
δ
2p+
δ
2hbwhere,
d ~ dispersion forces, p ~ polar interactions, hb ~ hydrogen bonds.
PMMA/PVAc intimately mixed blends have been previously obtained by formation and coalescence of their common γ-CD-ICs [6]. This was done using lower molecular weight PVAc (~ 13 kDa) and PMMA (~ 15 kDa). It was observed that blends coalesced from their common γ-CD-ICs showed some miscibility above the Tg of PVAc, where PVAc chains can diffuse in to PMMA domains.
PMMA/PVAc can also be partially blended using γ-CD as a compatibilizer through formation of their common non-stoichiometric (n-s)-γ-CD-ICs. In such a study we prepared (n-s)-γ-CD-ICs with a 3:1 ratio of the polymer pair (1:1 & 1:2, PMMA:PVAc) to γ-CD. In order to experimentally verify the ratio of polymer to cyclodextrin in these (n-s)-γ-CD-ICs of PMMA/PVAc, and the relative ratio of the PVAc and PMMA in the blend, we employed 1H-NMR (See Figure 2.12). The analysis was done on the 3:1 γ-CD (n-s)-IC of PMMA/PVAc (1:2) using d6-DMSO, as the solvent. Partial integration was carried out on the peaks corresponding to the PMMA (CH2), PVAc (CH), and γ-CD (1H) protons at ~4.4, ~5.6, and ~4.9 ppm, respectively. Keeping in mind the number of protons contributing to each, PMMA (2), PVAc (1), and γ-CD(8) peak, and that one γ-CD includes 3 repeat units of either PVAc or PMMA, we determined the relative ratio of included polymer (PMMA + PVAc) to cyclodextrin in their common (n-s)-γ-CD-ICs. The ratio of PVAc:PMMA in the (n-s)-blend-γ-CD-IC can also be obtained.
Theoretically, we expect the ratio of total polymer to the cyclodextrin in the 3:1-(n-s)-γ-CD-IC to be 3.375, based on the calculation of 3x the number of polymer protons that are included in a fully-covered 1:1 IC. The 1H-NMR analysis yielded an experimental value of 3.4±0.4, which is close to the expected value. The observed molar ratio of PVAc:PMMA in the blend was found to be 2.1±0.2, also very close to the expected value of 2.
DSC results for the (n-s)-PVAc/PMMA-γ-CD-IC blends have been summarized in Table 2.3. In the 1:1 PMMA/PVAc initial mixture we observe the glass transition temperatures of PVAc and PMMA at 48 and 143 oC, respectively, as seen in Figure 2.13. This is similar to the Tgs obtained for the neat (n-s)-ICs of PVAc and PMMA in the previous section. This indicates that the 3:1 (n-s)-PMMA/PVAc(1:1)-γ-CD-IC contains distinct γ-CD-IC crystals including exclusively each of the neat guest polymers. We can also see in Table 2.3, that unlike the Tg’s of the neat (n-s)-γ-CD-ICs, which simply shifted to higher temperatures, in the case of the 3:1 (n-s)-PVAc/PMMA-γ-CD-IC, with 2:1 PVAc;PMMA stoichiometry, they move closer to each other, indicating a certain degree of mixing between the “dangling” PVAc and PMMA chain portions.
Table 2.3: Tgs of PMMA/PVAc Blends in Their Common (n-s)-γ-CD-IC (n-s)-IC Sample
(Polymer:γ-CD)
PMMA/PVAc (Molar Ratio)
Tg1 (oC) Tg2 (oC) Tg3 (oC)
3:1 1:1 48 - 142
Although the mixing was not complete, as confirmed by a Tg close to that of the neat 3:1 (n-s)-PMMA-γ-CD-IC, the difference in the other two Tgs observed in relation to both the as-received and coalesced polymers is an indication of the presence of PMMA in PVAc-rich domains and vice versa. Thus, we get hardening (higher Tg) of the PVAc component caused by the presence of PMMA, and softening (lower Tg) of the PMMA from the presence of PVAc, resulting in a decrease of its glass transition temperature, compared to both asr- and c-PMMAs. Rather more interesting is the observation of an intermediate Tg at 113 oC, which is consistent with a well-mixed phase containing similar amounts of un-included portions of PVAc and PMMA chains.
Figure 2.14: FTIR data for a 50/50 PMMA/PVAc blend coalesced from its U-IC
Figure 2.15: PMMA/PVAc blends coalesced from their common U-ICs
![Figure 1.2: Synthesis of PVAc [2]](https://thumb-us.123doks.com/thumbv2/123dok_us/1597228.1197197/20.612.128.523.313.546/figure-synthesis-of-pvac.webp)
![Figure 1.3: Cyclodextrin Production; a) Solvent & b) Non-solvent methods [11]](https://thumb-us.123doks.com/thumbv2/123dok_us/1597228.1197197/23.612.108.522.183.562/figure-cyclodextrin-production-solvent-b-non-solvent-methods.webp)
![Figure 1.4: Cyclodextrins [12]](https://thumb-us.123doks.com/thumbv2/123dok_us/1597228.1197197/24.612.119.505.187.414/figure-cyclodextrins.webp)
![Figure 1.5: Urea manufacturing process [19]](https://thumb-us.123doks.com/thumbv2/123dok_us/1597228.1197197/26.612.152.483.290.533/figure-urea-manufacturing-process.webp)

![Figure 1.10: WAXD pattern for a) PMMA-CD-IC and b) as-received γ-CD [25]](https://thumb-us.123doks.com/thumbv2/123dok_us/1597228.1197197/34.612.116.509.326.545/figure-waxd-pattern-pmma-cd-ic-received-cd.webp)
![Figure 1.12: WAXD data for a) γ-CD b) 1-Propanol-γ-CD-IC c-f) PDMS-γ-CD-ICs with molecular weights 237, 770, 1250 and 62,500 g/mol respectively [34]](https://thumb-us.123doks.com/thumbv2/123dok_us/1597228.1197197/36.612.151.474.379.604/figure-waxd-data-propanol-pdms-molecular-weights-respectively.webp)
![Figure 1.15: Urea Inclusion – Matrix formation via hydrogen bonding [38, 39]](https://thumb-us.123doks.com/thumbv2/123dok_us/1597228.1197197/40.612.162.473.401.649/figure-urea-inclusion-matrix-formation-via-hydrogen-bonding.webp)