Vulnerability Analysis of Flat Plate Structures
Nikitha Eliza Mathew1, Airin.M.G2
P.G. Student, Department of Civil Engineering, SCMS School of Engineering and Technology, Karukutty,
Kerala, India1
Assistant Professor, Department of Civil Engineering, SCMS School of Engineering and Technology, Karukutty,
Kerala, India2
ABSTRACT: Any natural hazard becomes a natural disaster depending upon how it affects people and their lives ie, any hazard becomes a disaster when it results in damage to life and property. Natural disasters are unpredictable, so is the loss due to it. Therefore preparedness for such scenarios is very important so as to avoid major destruction. Vulnerability is the measure of the degree and type of exposure to risk generated by different societies in relation to hazards. The assessment of how much risk the society faces both quantitatively and qualitatively is called vulnerability analysis or vulnerability assessment. Vulnerability analysis helps in reducing the risk factor involved in such unpredictable situations. This paper focuses on the measurement of vulnerability of structures caused due to earthquakes and that may be expressed through probabilistic fragility functions (ie, fragility curves) representing the conditional probability of reaching or exceeding a predefined damage state given the measure of earthquake shaking. A case study was carried out on a G+7 flat plate slab structure. Non linear analysis was carried out on the case study building using SAP2000. Damage states were identified depending on the behaviour of the structure due to the ground shaking. Finally fragility curves were developed with the results obtained from the analysis using which the vulnerability of the building was identified for different intensities of earthquakes. Comparison with conventional type building was also done which showed that flat plate structures had a better fragility curve in case of mid-rise building.
KEYWORDS: Vulnerability, Fragility Curves, Flat Plate Structures, Pushover Analysis.
I.INTRODUCTION
resistant design. Thus, vulnerability may be defined as the degree of damage of a given item of the built environment to a given strength of shaking.
Performance-Based Building Design is an approach to the design of any intricacy of building, from single-detached homes up to and including high-rise apartments and office buildings. A building constructed in this way is required to meet certain quantifiable or expected performance requirements, such as energy efficiency or seismic load, without a specific prescribed method by which to attain those requirements. Such an approach provides freedom to develop tools and methods to assess the entire life cycle of the building process, from the business dealings, to procurement, through construction and the evaluation of results. This paper focuses on the vulnerability analysis flat plate structures. Structural vulnerability of flat plate structures is done by developing fragility curves with the pushover analysis results in this work. SAP2000 is used in the modelling and analysis of the same. The pushover curve and capacity spectrum is plotted from the analysis results. Using probability functions, fragility curves are then plotted which gives an idea of the vulnerability of the building.
II.RELATEDWORK
Fragility curves are functions that describe the probability of failure, conditioned on the load, over the full range of loads to which a system might be exposed. In particular they are functions rather than point estimates, the loads are treated deterministically, so fragility curves express a probability of failure that is conditional on the load rather than an overall probability of failure and the probabilities are generally interpreted in absolute terms.
HAZUS MH 2.1
HAZUS is a technical manual which describes the methods for performing earthquake loss estimation. It has developed a nationally applicable methodology for estimating potential earthquake loss on regional basis. This manual is in agreement with The Federal Emergency Management Agency (FEMA). The primary purpose is to develop guidelines and procedures for making earthquake loss estimates at a regional scale. HAZUS also defines equations for fragility curves and have developed values for constants for different types of buildings.
Colangelo (2008)
A number of methods exist for deriving the fragility curves. This work briefly reviews several approaches, and compares empirically the fragility curves obtained by such methods, once applied to a same benchmark structure. This journal is on a deterministic four-story masonry-infilled reinforced-concrete (RC) frame, modeled member by member and analyzed under artificial accelerograms. The infill damage is considered. The peak interstory drift ratio is adopted as the damage index. The intensity of the ground motion is characterized in terms of the peak ground acceleration (PGA). The different methods of fragility curve development are used to plot the curve.
Wijayanti et al., (2015)
This study aims to determine the seismic vulnerability of 5th Building of Engineering Faculty, SebelasMaret University by developing its fragility curves. Fragility curve is a measure of probabilistic seismic performance under various ground motion. The intensity of ground motion adopted in this study is median spectral displacement, , with lognormal
standard deviation, βds as uncertainty parameter. The value of lognormal standard deviation is adopted from HAZUS.
The parameters of median spectral displacements are identified from the capacity spectrum curve. The capacity curve obtained from non-linear static pushover analysis. Capacity curves can be converted into capacity spectrum to identify the location of the median spectral displacement at various damage states. The obtained fragility curves provide information on the probability of various damage states to occur when certain ground motion level strikes the building under study.
III.FLATPLATESTRUCTURES
conditioning/heating costs. For vertical loads, the structural performance and design of flat plates are well established. Under lateral loads, many aspects of the behaviour of flat plates are uncertain. A serious problem that can arise in flat plates is brittle punching shear failure due to poor transfer capacity of shearing forces and unbalanced moments between slabs and columns. In case of residential buildings the major issue that structural designers face is the requirement of service ducts in flat plate structures.
IV.CASESTUDYBUILDING
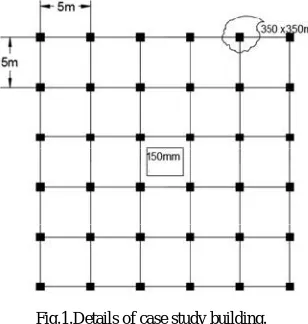
Fig.1 shows the details of the case study building selected for the study.
Fig.1.Details of case study building.
Table 1 shows the details of the case study building selected.
Table 1 Details of case study building
Description Values
No. of storeys 8
No. of bays 5
Width of bay (m) 5
Height of each floor (m) 3
Live load (kN/m2) 2
Slab thickness (mm) 150
Column size (mm x mm) 350 x 350
Concrete grade M25
Steel grade Fe 500
Zone factor (Z) 0.36
Importance factor (I) 1.5
V.FRAGILITYCURVEDEVELOPMENT
comprehensive perspective on system reliability than nominal failure probabilities based on traditional reliability index because they convey more information about the reliability of the system.The conditional probability of failure is estimated from the following relationship: (HAZUS)
( | ) =
, (1)
where, P( | ) =
Probability of exceeding a limit state at a given ground motion intensity Φ = Standard normal
cumulative distribution function = Standard deviation of the natural
logarithm of spectral displacement for damage state, ds S = Randomly varied spectral
displacement values (mm) S , = Median value of spectral displacement at which
the building reaches thethreshold of damage state, ds (mm)
Damage states or limit states for both structural and non-structural systems are defined as the point in which the system is incapable of satisfying a desired function. There are many types of performance levels in the field of earthquake engineering. In addition, performance levels can be identified by qualitative and quantitative approaches. The values of median spectral displacement at yielding damage state, slight damage state andcomplete damage state can be determined accurately from pushover analysis result (see. fig.2). The median spectral displacements for other damage states i.e. moderate and extensive damage state can be calculated from the values of median spectral displacement at slight and complete damage state. The median spectral displacement for moderate damage state is 1.5 of the median spectral displacement for slight damage state; while the median spectral displacement for extensive damage state is a midway between median spectral displacement for moderate and complete damage state.
Fig.2. Capacity spectrum and the location of key points
VI.FRAGILITYCURVEDEVELOPMENT
Table 2.Values of βds and Sd,ds for model FPS
Damage State Spectral Displacement,
Sd,ds, (mm)
βds
Slight 88.8 0.73
Moderate 133.2 0.77
Extensive 184 0.83
Complete 235 0.98
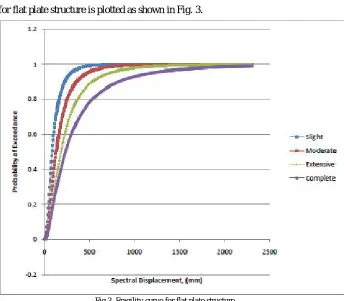
Fragility curve for flat plate structure is plotted as shown in Fig. 3.
Fig.3. Fragility curve for flat plate structure.
VII.CONCLUSION
On knowing the spectral acceleration and fundamental period of a building of a region, the spectral displacement value using equation 2 can be calculated. The strong earthquake is defined with the return period of 2500 year. For structures with 50 year service life, the probability of occurrence equals to 2%, with the spectral acceleration value, Sa = 0.52 g. Meanwhile the moderate and low earthquake may be defined as earthquake with return period of 75 and 20 years respectively. Therefore, the earthquake probability of occurrence would be 50% and 92%, given the structure is
designed for 50 years‟ service life.
=
.
(2)can be identified. This result can further be used to predict the type of retrofit measure needed for the building exposed to damage.
There are different methods for developing fragility curves.The resulting curves are strongly dependent on the choices made for the analysis method, structural idealization, seismic hazard identification and the damage models used. These choices can cause significant discrepancies in the vulnerability predictions by different researchers, even in the cases where similar structural types and the same seismicity information are employed.The steep shape of the slight limit state curve is because of the flexibility of the flat plate structure, whereas the curves shows gradual increase.
VIII.SCOPEFORFUTUREWORK
The work in this paper has been limited to a G+7 reinforced concrete flat plate structural frame system. Some of the future research needs related to seismic fragility and retrofitting are listed below:
(i) This study could be extended to other types of structures including, steel, masonry, composite and other concrete structures to develop fragility curves.
(ii) This study is only for mid-rise structures, future studies can be made on low-rise and high rise structures.
REFERENCES
[1] Dhananjay.D.Joshiand Dr.Pranesh.B.Murnal,”Performance of flat slab structure using pushover analysis”, IOSR Journal of Mechanical and
Civil Engineering, 41-44 , 2013
[2] ErlinWijayanti, StefanusAdiKristiawan, EdyPurwantoand SenotSangadji, “Seismic vulnerability of reinforced concrete building based on the
development of fragility curve: A case study”, Applied Mechanics and Materials, 252-258, 2016
[3] F.Colangelo,” On the computation of Seismic Fragility Curves”, The 14th World Conference on Earthquake Engineering, 2008
[4] V.Vyshak, Dr.Bindhu K.R and Rahul Leslie, “Determination of Performance Point in Capacity Spectrum Method”, International Journal of
Innovative Research in Science, Engineering and Technoology, Vol.2,Special Issue 1,167-173, 2013
[5] Vazurkar U.Y and Chaudhari D.J, “Development of fragility curves for RC buildings”, International Journal of Engineering Research,
591-594,2016
[6] Y.K.Wen, B.R.Ellingwoodand J.Bracci, “Vulnerability function framework for consequence-based engineering”, MAE Center Project DS-4
Report ,2004
[7] HAZUS-MH 2.1, Multi-hazard Loss Estimation Methodology
[8] FEMA 356, Prestandard and Commentary for the Seismic Rehabilitation of Buildings