Validation of a “Centralized Data Processing
Unit” for a Manufacturing Setup through
Simulation
Pooviarasan U1, Dr. V N Gaitonde2
Assistant Professor, Department of Mechanical Engineering, Ballari Institute of Technology and Management, Ballari,
Karnataka, India1
Professor, Department of Industrial and Production Engineering, KLE Technological University, Hubli, Karnataka,
India2
ABSTRACT: Centralization has provided many solution in reducing the unavoidable expense and damage done to our
ecological system and is one of the important process to be carried out in discrete manufacturing firms too. For the project being discussed, centralizing the data processing unit will result into reduction in - manpower cost, infrastructure cost, idle time cost and carbon footprint count for the units which were earlier distributed at 4 different locations. Validating a centralized data processing unit and proposing the best alternative involves a systematic study of the existing system. The system under study itself is highly complex with many entities interacting with each other delivering an output; which too keeps changing as the inputs change. Thus, for such dynamic systems which are sensitive to changes and the relationship amongst the entities are quite complex and beyond the limits of human understanding, System Simulation comes as a boon. The system simulation in the present work is carried out using popular and widely accepted simulation software and the calculation of carbon foot prints is done with the help of an online carbon footprint calculator.
KEYWORDS:Simulation, Discrete event Simulation, Centralization, carbon footprint, idle time cost
I. INTRODUCTION
Centralization in any business organization is the limelight of supremacy and control. Implementing the ideas of centralization will bring out both positives and negatives, just like in any concept. But in this case centralization has more advantages when compared to the disadvantages. We shall explore the advantages of centralization through modeling and simulating the system under study. A Popular and widely accepted simulation software by the industry as well as academics is used for the study.
A simulation is a way to model a random event. In the real world, statisticians use simulations to approximate probabilities or sampling distributions in [1] complex situations where mathematical theory provides approximations that might be too crude, or in a situation when results are too difficult to derive mathematically. In addition, simulations are often used to understand what results look like under one scenario (null hypothesis), so that we can compare them to a real-life scenario.
LITEREATURE SURVEY 1. Types of Simulation
real-world system[2] As such, simulation has a long-standing record of assistance to manufacturing operations; indeed, manufacturing is among the oldest and most frequent areas of simulation application
Simulation models are classified as shown as follows [4]. A) With respect to dependency on Time:
i. Static simulation – A simulation of a system at one specific time, or a simulation in which time is not a relevant parameter.
Example: Monte Carlo Simulation.
ii. Dynamic simulation – A simulation representing a system evolving over time. Example: The simulation of a bank from 9:00 a.m. to 4:00 p.m.
B) With respect to Entities involved:
i. Live simulation – A simulation involving real people operating real systems.
Example: War games to explore the effects of warfare or to test strategies without actual combat. ii. Virtual simulation – A simulation involving real people operating simulated systems.
Example: Aircraft simulator for pilot training.
iii. Constructive simulation – A simulation involving simulated people operating simulated systems. Example: Tabletop war games (miniature war games).
C) With respect to Time Advance:
i. Continuous simulation – State of the system is viewed as changing continuously across time. System typically described by a set of differential equations. Example: rise of water level in a dam, flow of fluids in pipes.
ii. Discrete (Event) simulation – Are event-driven where the state variables change at discrete time points. Example: in a factory - parts are assembled based on receipts or anticipation of orders, arrival of customers in a
bank, machine repair problem etc. D) With respect to Results:
i. Deterministic simulation – A model that contains no random variables (no probability).
Example: modelling of fixed-cycle-time operations like arrivals with preset appointments to a doctor or a lawyer’s office.
ii. Stochastic simulation – A model that contains one or more random variables (contains probability). Example: inter-arrival time or service time in case of a bank.
The process of building simulation models will invariably involve some form of software. The software could either be a high level programming language or a data driven software system in which the model is specified using user-defined and default data items (e.g. machine scrap rate of 5% with default efficiency of 100%). Hence the model is either the software itself or held within a host software system. With the development of more user-friendly simulation systems it is generally the user who will build the model, not an expert. Inside the software or model will be a number of important concepts, namely entities and logic statements.
2. IDLE TIME COSTS
Idle time is simply the time for which labour has been paid for but no work has been done. Whereas inefficiency arises when labour is actually engaged on production but output is not as expected or not 100%. Idle time may arise out of normal or abnormal situations and it is the situation that will tell whether it is a normal idle time (unavoidable idle time) or abnormal idle time (avoidable idle time).
3. CARBON FOOTPRINTS
Carbon foot prints are the measure of emission of carbon-dioxide into the atmosphere by burning the fossil fuel energy. A dangerous atmospheric deviation is a certainty, and develops into a full scope of issues of legislative, economy, society, innovation, environment and biology on a worldwide scale from a solitary experimental issue [5]
directly through to its utilization and the last re-use, reusing or transfer [8]. An authoritative carbon footprint measures the GHG outflows from every one of the exercises over the association, incorporating vitality utilized as a part of structures, mechanical procedures and organization vehicles. A nation carbon footprints concentrates on carbon dioxide emanations in the whole nation created by the general utilization of materials and vitality, vegetation and other carbon sequestrations, and in addition the roundabout and direct outflows brought on by import and fare exercises, to investigate the carbon dioxide discharges of the whole country [9].
These carbon footprints emissions are widely classified into two types; a. Primary Carbon footprints (Direct emissions)
b. Secondary Carbon footprints (Indirect emissions).
Business organizations mainly focus on Primary carbon footprints so that they can have a direct control on emissions.
II. RELATED WORK
A manufacturing firm in India has three other branches in India which perform individual data processing at their respective units, these discrete units along with their value addition also contribute losses to the firm in terms of infrastructure cost and associated manpower cost and the carbon footprint count, as they process individually, so a better solution can be provided by centralizing the data processing units. The main aim of the work is to reduce the overall costs and increase the resource utilization along with reducing the carbon foot prints by centralizing the manufacturing units.
Objectives of this work are, finding:
1. Percentage reduction in manpower cost after centralization 2. Percentage reduction in infrastructure cost after centralization 3. Percentage reduction in idle time cost after centralization 4. Percentage reduction in carbon-foot prints after centralization
Initial Input Data:
The above table is the detail of cost (investment) for server, air conditioning, security systems etc, for each individual discrete data processing units which are located at different parts of the country, this table also consists the manpower required for that particular unit and also the number of shifts running per day.
The above table gives the details of shift timings, tea breaks and miscellaneous timings of all the employees, which will be useful to study the centralization process of the data processing unit
III. Initial ‘As-Is’ models
(c) (d)
Fig. 1 “As- Is” Model (a) “As- Is” Model of Unit-1 (b) “As- Is” Model of Unit-2 (c) “As- Is” Model of Unit-3 (d) “As-Is” Model of Unit-4
As per the data available the models are built using the software, four discrete models are built (As-Is), to study the current working scenario of the data processing units. Then these results are compared and studied to validate the outcome with respect to the centralized (What- If) model’s working. These models of different units are modelled and simulated for a 24 hrs run time and made sure that the entities move out of the system within the stipulated time period. The model building not only involves the management of entities arrival time but also focuses on scheduling of the resources to the entities during day shifts as well as night shifts.
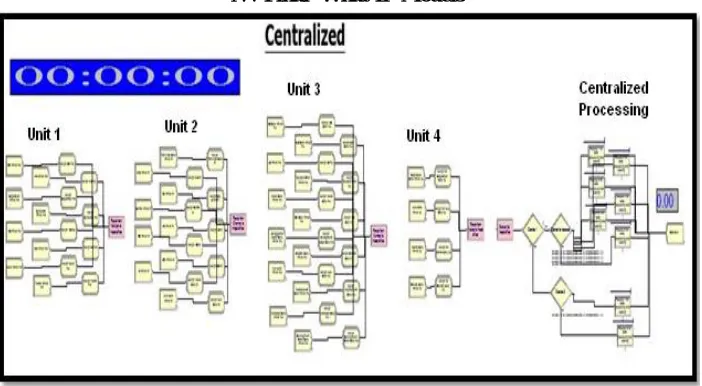
IV.Final ‘What-If’ Models
Fig 2 “What-If” Centralized Model
After conducting several experiments on the centralized model, the most effective and efficient working model as per the requirement has been proposed.
V.INDENTATIONS AND EQUATIONS The Abbreviations
(X)B.C = ‘X’ Before Centralization
(X)A.C = ‘X’ After Centralization
CO2e = Carbon-di-oxide emission
GHG = Green House Gases IST = Indian Standard Time Mins = minutes
(1) Percentage reduction in Man power cost = (Total cost) B.C – (Total cost) A.C x100
(Total cost)B.C
(2) Percentage reduction in Infrastructure cost = (Total cost) B.C –(Total cost) A.C x100
(Total cost)B.C
(3) Percentage reduction in Idle Time Costs = (Total cost) B.C – (Total cost) A.C x100
(Total cost)B.C
(4) Percentage Reduction in Carbon foot prints = (CO2e) B.C – (CO2e) A.C x 100
(CO2e)B.C
VI.RESULTS AND INTERPRETATIONS
From the above results table interpretations are described below:
Manpower cost is maximum for Unit 1 (i.e. Rs 40000), and the sum of manpower costs of all the individual units together is Rs 112000(because 14 employees are used). But, when it is centralized the overall manpower cost reduces to Rs 64000 (only 8 employees are used). Therefore the percentage reduction in manpower cost is 42.86 %.
Infrastructure cost is maximum for Unit 4 (i.e. Rs 520000) and minimum for Unit 3 (i.e. Rs 330000), and the sum of Infrastructure costs of all the individual units together is Rs 1590000. But, when it is centralized the overall infrastructure cost reduces to Rs 855000. Therefore the percentage reduction in infrastructure cost is 46.23%.
Idle time cost per month is maximum for Unit 1 (i.e. Rs 8520) and minimum for Unit 3 (i.e. Rs 5130), and the sum of Idle time costs of all the individual units together is Rs 24870. But, when it is centralized the overall idle time cost reduces to Rs 12300. Therefore the percentage reduction in idle time cost is 50.50%.
Carbon footprints is maximum for Unit 1 (i.e. 16.99 tons CO2e) and minimum for Unit 4 (i.e. 9.19 tons CO2e),
and the sum of CO2e of all the individual units together is 52.36 tons CO2e. But, when it is centralized the
VII. CONCLUSION
Now a day’s firms are more keen on reducing the non value added activities and its costs, irrespective of their field. So, centralization has provided a better solution which addresses the major portion of non value added activities which eventually reduces its cost to the company (CTC).
From the ‘As- Is’ model built using the software, we can clearly conclude that the number of employees used in discrete systems are being underutilized and thus increasing the idle time costs. There for the work conducted has laid in the fruitful results of reducing these costs.
After conducting many experiments on ‘What- If’ (Centralized) model, we have come to a clear conclusion, that the reduction on number of employees to perform the same set of job which was earlier done by the discrete units is valid and now the required employees are reduced to 8 in numbers from 14 in numbers. Thus the reduction in infrastructure cost, manpower cost, idle time cost and carbon footprint units is also validated.
REFERENCES
[1] Abdel-Malek L, Wolf C, Johnson F and Spencer T, OR practice: Survey results and reflections of practising INFORMS members, Journal of the Operational Research Society50 (10), pp .994–1003, 1999.
[2] Jerry Banks, John S. Carson, Barry I. Nelson, and David M. Nicol, Discrete Event System Simulation, Fourth Edition, Prentice Hall, 2001. [3] P Wiedmann, T. and Minx J A, Definition of 'Carbon Footprint'. In: C. C. Pertsova, Ecological Economics Research Trends: Chapter 1, (Nova
Science Publishers, Hauppauge NY, USA), pp. 1-11, 2008.
[4] Bubnicki, Zdzislaw, Simulation of an Industrial Transport System, In Proceedings of the 8th European Simulation Symposium, eds. Agostino G.
Bruzzone and Eugène J. J. Kerckhoffs, pp. 305-309, 1996.
[5] The United Nations Intergovernmental Panel on Climate Change. Climate Change, Synthesis Report [R]. IPCC, Geneva, Switzerland, 2007. [6] Wiedmann T, Minx J, A definition of Carbon Footprint [J]. ISA Res Rep; pp. 7:1–7, 2007.
[7] Weidema BP, Thrane M, Christensen P, et al. Carbon footprint. [J] Ind Ecol; pp.12:3–6, 2008.
[8] Finkbeiner M. Carbon footprinting—opportunities and threats [J]. Int J Life Cycle Assess; pp.14:91–4, 2009.
[9] Tao Gao*, Qing Liu and JianpingWang, A comparative study of carbon footprint and assessment standards, International Journal of Low-Carbon Technologies Advance Access, pp 1-7, 2013.sss
[10] Clark, Gordon M, Introduction to Manufacturing Applications, In Proceedings of the 1996 Winter Simulation Conference, eds. John M. Charnes, Douglas J. Morrice, Daniel T. Brunner, and James J. Swain, pp.85-92, 1996.
[11] Centeno, Martha A, An Introduction to Simulation Modeling, In Proceedings of the 1996 Winter Simulation Conference, eds. John M. Charnes, Douglas J. Morrice, Daniel T. Brunner, and James J. Swain, pp.15-22, 1996.
[12] Law, A. M., & Kelton, W. D,“Simulation Modeling and Analysis”, McGraw-Hill, Third Edition, 2000.