DOI: 10.1534/genetics.105.042762
The Impact of Using Related Individuals for Haplotype Reconstruction in
Population Studies
Michael T. Schouten,*
,†,1Christopher K. I. Williams* and Chris S. Haley
†*School of Informatics, University of Edinburgh, Edinburgh EH1 2QL, United Kingdom and †Roslin Institute (Edinburgh), Roslin, Midlothian EH25 9PS, United Kingdom
Manuscript received March 1, 2005 Accepted for publication June 2, 2005
ABSTRACT
Recent studies have highlighted the dangers of using haplotypes reconstructed directly from population data for a fine-scale mapping analysis. Family data may help resolve ambiguity, yet can be costly to obtain. This study is concerned with the following question: How much family data (if any) should be used to facilitate haplotype reconstruction in a population study? We conduct a simulation study to evaluate how changes in family information can affect the accuracy of haplotype frequency estimates and phase reconstruction. To reconstruct haplotypes, we introduce an EM-based algorithm that can efficiently accommodate unrelated individuals, parent-child trios, and arbitrarily large half-sib pedigrees. Simulations are conducted for a diverse set of haplotype frequency distributions, all of which have been previously published in empirical studies. A wide variety of important results regarding the effectiveness of using pedigree data in a population study are presented in a coherent, unified framework. Insight into the different properties of the haplotype frequency distribution that can influence experimental design is provided. We show that a preliminary estimate of the haplotype frequency distribution can be valuable in large population studies with fixed resources.
T
HERE is currently a strong interest in how best to use linkage disequilibrium (LD) information for fine-scale mapping and association analysis of complex traits. A growing number of studies demonstrate that haplotype-based approaches may provide more power and accuracy in locating quantitative trait loci (QTL) and causative disease variants than single-locus meth-ods (see,e.g., Fallinet al.2001; Morriset al.2002; Zhao et al.2003). Since haplotypes are typically not observedin vitro, haplotype-based studies are likely to follow a two-step procedure: first, haplotypes are inferred from a sam-ple of phase-unknown genotypes using a computational algorithm, and second, inferred haplotypes are fed into a multilocus LD model, where they are treated as having been directly observed.
There are two principal approaches to inferring haplotypes from population data, both with potential drawbacks. One approach is to use family data, which may be able to deterministically resolve phase for ge-notypes featuring multiple heterozygous loci. However, ascertaining this information can be costly. When re-sources are fixed, it may actually be more efficient to use a genotype-based mapping model rather than reallo-cate resources to ascertain family data for haplotype reconstruction (Grapeset al.2004).
A second approach is to infer haplotypes directly from population data. A variety of statistical algorithms exist for random-mating populations, and good com-parative surveys are available (see, e.g., Stephens and
Donnelly 2003; Zhao et al. 2003). A problem with
reconstructing haplotypes using these models is that there may be considerable uncertainty associated with the inferred haplotypes. It was recently demonstrated that failing to account for this uncertainty can result in unreliable location estimates in a subsequent mapping analysis (Morris et al. 2004). These results indicate
that, when possible, haplotype-based analyses should be modified to efficiently accommodate this uncertainty. When the two-stage procedure must be used, it is impor-tant to understand the factors that will limit its effective-ness. One important factor is likely to be the haplotype frequency distribution. This is because, under the stan-dard assumption of random mating, the data can be regarded as independent samples from this distribution. In this article, we illustrate the different ways in which the haplotype frequency distribution can affect the accuracy of both the phase assignments and the haplo-type frequency estimates. We also examine the effec-tiveness of using family data to improve accuracy for different frequency profiles.
To facilitate our analysis, we begin by introducing an EM-based haplotype reconstruction model that can ac-commodate outbred half-sib pedigrees, unrelated indi-viduals, and family-child trios. The method is efficient for arbitrarily large sibships with missing marker data
1Corresponding author:School of Informatics, University of Edinburgh,
5 Forrest Hill, Edinburgh EH1 2QL, Scotland, United Kingdom. E-mail: [email protected]
and will be of interest to studies of hierarchical popula-tion structures, including those in populapopula-tions of many natural and domestic animal species.
The remainder of the article is devoted to simulating and analyzing results, using a diverse set of published haplotype frequencies. We describe summary statistics that can be calculated directly from inferred frequency data and that can be used to predict the accuracy of phase assignment and the usefulness of family data. A wide variety of results that either extend or complement existing analysis are presented in a coherent, unified framework.
METHODS
Notation and modeling assumptions: We consider a candidate region in the genome characterized by L
tightly linked biallelic loci. Let h ¼ h1,. . .,hM
de-note the M ¼ 2L
possible haplotypes, and let Q ¼ (u1,. . . ,uM) denote corresponding haplotype frequen-cies in the target population.
For a large, panmictic population, we can specify the probability of observing a given phase configuration,
z¼(hi,hj) as
pðz¼hi;hjjQÞ ¼cuiuj; ð1Þ
wherec¼1 if the individual is a homozygote (i.e.,i¼j) or 2 if the individual is a heterozygote (i.e.,i6¼j).
Similarly, the probability of observing a given phase-unknown genotype,y, in a panmictic population is
pðyjQÞ ¼ X
z2zðyÞ
pðzjQÞ; ð2Þ
wherez(y) is the set of all possible phase configurations that can resolvey. Note that the size ofz(y) increases exponentially with the number of heterozygous loci.
Haplotype reconstruction via the EM algorithm:Let
y¼ y1,. . .,yN denote a sample of N phase-unknown
genotypes. The objective of the EM-based approach to haplotype reconstruction is to calculate the maximum-likelihood estimate ofQgiveny. Haplotype frequency estimates can then be used to reconstruct phase.
An important initial assumption concerns any un-derlying pedigree structure of the data. It is useful to make these assumptions explicit by characterizing the observed data using two parameters: the marker data,y, and a representation of the underlying pedigree struc-ture, F. When individuals are unrelated, or no addi-tional family information is included, we setF ¼B.
A central challenge of any likelihood-based pedigree model is achieving reasonable computational complex-ity for a givenF, and one of the principal contributions of our method is that we provide an efficient algorithm for sparse half-sib pedigrees. It is useful to first review the EM-based approach for unrelated individuals.
EM algorithm for unrelated individuals: The EM algo-rithm for unrelated individuals has been developed and evaluated in many different contexts (see, e.g., Hill
1974; Terwilliger and Ott 1994; Excoffier and
Slatkin 1995; Hawley and Kidd 1995; Fallin and
Shorck2000; Kirkand Cardon2002; Qinet al.2002).
The general approach entails augmenting the observed phase-unknown genotypes for each member in the sam-ple by the corresponding phase configurations. We de-note these latent phase configurations byz¼z1,. . .,zN.
Each iteration of the EM algorithm requires calculating the expected log-likelihood of the augmented data,
EpðzjyQ˜Þlog½pðy;zjQÞ ¼
XN
i¼1 XM
j¼1
Epðzijyi;Q˜Þnijloguj
1Constant; ð3Þ
where ˜Qdenotes the current estimate ofQandnijrefers
to the number of times haplotypejappears in the phase configuration of individuali. Once (3) has been calcu-lated, the result is maximized with respect toQand the process is repeated until ˜Qconverges at a maximum, ˆQ. Note that without the expectation, (3) is a straight-forward description of ‘‘gene counting.’’ The added complexity incurred from using the EM algorithm is therefore attributed to calculatingpðzijyi;Q˜Þ. This
quan-tity is given by dividing Equation 1 by Equation 2. The complexity is dominated by calculating the terms in (2), which increase linearly with the number of ble phase configurations. However, the number of possi-ble phase configurations increases exponentially with the number of heterozygous genotypes, which limits the number of SNPs that can reasonably be evaluated. This constraint will apply to any EM-based approach that requires estimating the distribution of phase given marker data, including the one we are about to describe for outbred half-sib pedigrees. It is worth mentioning that one way to accommodate a large number of mark-ers is to use the partition-ligation algorithm introduced by Niuet al.(2002). While this algorithm was developed
as part of a Bayesian model, it has since been incor-porated into the EM framework (Qinet al.2002).
EM algorithm for outbred half-sib pedigrees:We now con-sider the case where members of y may be related through one ofP#Nsires. IfP,N, then the likelihood in (3) is no longer valid since the summation overN fol-lows only from assuming that each animal is unrelated. One EM-based approach that accommodates nuclear family information is described by Rohdeand Fuerst
sib structure of moderate size. For sparse family struc-tures, such as half-sib pedigrees with untyped parents, it is not a realistic strategy.
The starting point for our model follows a generic approach described by O’Connell(2000), and entails
augmenting the data by the latent phase configurations of the founders. The E-step would then require calcu-lating the marginal distribution of each founder given the marker data specific to that founder’s pedigree.
Let the latent phase configurations of the sires and dams be denotedsandd, respectively. The expectation of the augmented data (omitting the constant term) is XP
i¼1 XM
j¼1
EpðsijQ˜;y;F Þ½nijloguj1
XN
i¼1 XM
j¼1
EpðdijQ˜;y;F Þ½nijloguj:
ð4Þ
The challenge is therefore how to calculate pðsijQ˜Þ
andpðdijQ˜Þ. This can be done in any number of ways,
but many potentially relevant techniques have been developed in the context of human linkage analysis. In
the appendix we provide a formal derivation of the
approach we use for calculating the marginal distribu-tions of the sire and dams. Briefly, inferring pðsijQ˜Þ
follows a straightforward application of the peeling al-gorithm (Elstonand Stewart1971). InferringpðdijQ˜Þ
can be achieved by adopting general principles used to simulate pedigree data (Ploughmanand Boehnke
1989). Using these techniques results in a computa-tional complexity that is cubic in the number of phase configurations. This is still two orders of magnitude worse than the complexity for unrelated individuals. In theappendix, we also demonstrate how to achieve
quadratic complexity for both sire and dam. In the con-text of haplotype reconstruction, the corresponding re-duction in computational resources can be substantial. The methods of both O’Connell(2000) and Rohde
and Fuerst (2001) assume nonrecombinant
haplo-types, which is realistic for small genomic regions or over regions lacking recombination hotspots. We make the same assumption and note that O’Connell(2000)
outlines a strategy for dealing with recombinant regions that is similar to the partition-ligation algorithm (Niu et al.2002) for accommodating large numbers of loci.
Our algorithm also provides a unified framework to evaluate arbitrarily large half-sib pedigrees, parent-child trios (a sibship of size one), and unrelated individuals. When no additional family data are provided, results are the same as using the standard EM algorithm for un-related individuals.
SIMULATIONS
We conduct a simulation study based on independent half-sib pedigrees, using empirically derived haplotype
data. Our simulation strategy is divided into the follow-ing three steps: (1) specification of a haplotype fre-quency distribution for the parental population, (2) simulation of genotypes for independent half-sib ped-igrees, and (3) estimation of haplotype frequencies and phase configurations using alternate categories of family data.
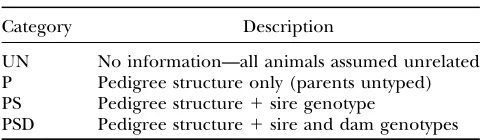
We fix the number of sampled individuals at 100 and consider sib sizes of 1, 2, 5, 10, and 25. The categories of family information that are used with each sample when reconstructing haplotypes are given in Table 1. Family sizes are exact, and therefore results for samples featur-ing a family of size 1 correspond to unrelated individuals or, if parental genotypes are provided, to parent-child trios. One consequence of using this simulation stra-tegy is that increasing the size of a sibship will reduce the number of independent haplotypes in a given sam-ple. This allows us to evaluate whether the resolving power from additional pedigree data compensates for the loss in independent haplotypes (i.e., whether the im-proved quality of the data compensates for the reduced quantity).
The most important parameter in the simulation study is the parental haplotype frequency distribution. Our analysis is based on three empirically derived hap-lotype frequency distributions. The first two frequency profiles, APOE1 and APOE2, were provided by Fallin
et al.(2001) and correspond to two sets of marker data for a control group used in an association study for Alzheimer’s disease. The third data set, IL8E, was
pre-sented by Hullet al.(2001) and corresponds to
haplo-type frequency estimates of a European sample for six biallelic loci spanning a 7.6-kb region within the IL8 locus.
One of the central results from the simulation study is that the expected accuracy for any EM-based quantity will be different for each of the population frequency distributions. It is useful to identify relevant summary statistics that capture the relative performance that can be expected for random samples from each of the populations.
Qin et al. (2002) demonstrate that the expected
information in a random sample of phase-unknown genotypes can be expressed as the sum of two com-ponents: the first component reflects the variance of ˆQif phase configurations are observed, while the second
TABLE 1
Categories of family data that can be included with a sample of phase-unknown genotypes in a simulation study
Category Description
UN No information—all animals assumed unrelated P Pedigree structure only (parents untyped) PS Pedigree structure1sire genotype
component reflects the loss of information because of unknown phase configurations.
The first component can be approximated by the gene diversity, 1PM
i¼1u 2
i, which is a measure of the
uniformity of the frequency distribution.
To describe the additional uncertainty from the un-known phase configurations, we use the expected error rate using the most likely phase configuration. Consider a given phase-unknown genotype,y. The probability that the most likely phase configuration is the correct one is given by max p(zjy,Q). A measure of the uncertainty from not knowing phase for this genotype is 1max
p(zjy,Q). The expectation of incorrectly assigning phase for a random sample is therefore
EðejQÞ ¼X
y
pðyjQÞ½1maxpðzjy;QÞ: ð5Þ
Appreciating the relevance of Equation 5 in the context of accurate EM-based phase reconstruction cannot be overstated. The expression describes the number of in-correct phase assignments that is expected in a popula-tion sample when the most likely phase configurapopula-tion is used and haplotype frequencies are known. It can therefore be considered a lower bound on the number of errors that are calculated from haplotype frequencies inferred by the EM algorithm.
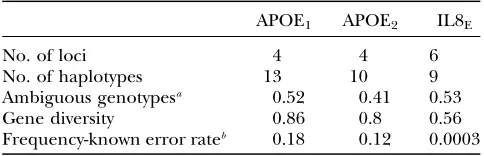
These two statistics are presented in Table 2. If the population haplotype frequency forAPOE1were known with certainty, we would expect to get no greater than 82% of the sample correct if the most likely phase cri-terion is used. By contrast, phase assignment using the most likely phase criterion would be virtually error free for population samples generated from the IL8E
dis-tribution, even though the expected number of am-biguous genotypes (i.e., genotypes with two or more heterozygous loci) is similar to that inAPOE1. Although there are multiple phase configurations that can, in theory, resolve an ambiguous genotype sampled from
IL8E, the vast majority of these will feature at least one
haplotype that does not actually segregate in the popu-lation. This demonstrates that family data may be un-necessary for accurate phase reconstruction, even when a sample features many ambiguous genotypes.
RESULTS
We describe the results from our simulation study using two standard summary statistics based on hap-lotype frequency estimates and phase accuracy. For assessing haplotype frequency estimates, we use the discrepancy metric (Excoffierand Slatkin1995; Kirk
and Cardon2002), which is defined as
DðQ;QˆÞ ¼1 2
X2L
i¼1
juiˆuij: ð6Þ
For the phase configurations, we use the estimated fre-quencies to assign each individual its most likely phase configuration and then calculate the percentage of in-dividuals that are incorrectly assigned. This metric is appropriate since it is the typical criterion on which haplotypes are assigned for use in a fine-scale mapping analysis.
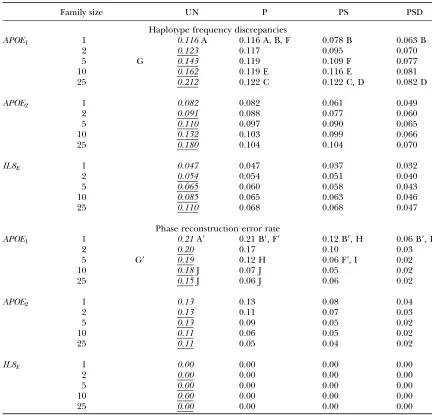
Results for these two measures of accuracy are pre-sented in Table 3. Table 3 is structured to highlight a wide variety of trends, some of which are indexed by letters that are referenced in the text. When referring to an entry in Table 3 indexed byX, we use the notation (X). We include only indexes for the APOE1 results since annotating each table would have obscured trends. It is contextually clear which distribution(s) is relevant to supporting a given statement. Similarly, we do not include standard errors. Comparative state-ments were verified at the 95% significance level using a pairedt-test.
Table 3 also features results from a standard analysis using the EM algorithm for unrelated individuals (column in italics). These will be useful when discussing the results from treating related individuals as unrelated (underlined italics). Note that using our algorithm gives the same results as those of the EM algorithm for un-related individuals when no family data are provided (Table 3, A). Hence either entry can be used to describe accuracy for 100 unrelated individuals, which is often useful as a base comparison to other scenarios that use family data.
Broadly, we are interested in how changes in family data, sample size, and frequency distribution affect each of the two measures of accuracy. We are also interested in whether trends observed for one measure of accuracy apply to the other one. Since the number of progeny is fixed at 100, we measure sample size by the number of independent haplotypes segregating in the sample.
We begin by focusing exclusively on the accuracy of haplotype frequency estimation. We then provide
TABLE 2
Summary statistics for haplotype frequency estimates used in data analysis
APOE1 APOE2 IL8E
No. of loci 4 4 6
No. of haplotypes 13 10 9
Ambiguous genotypesa 0.52 0.41 0.53
Gene diversity 0.86 0.8 0.56
Frequency-known error rateb 0.18 0.12 0.0003
aThe expected proportion of a population sample that is heterozygous for at least two loci.
a similar analysis for phase reconstruction accuracy, highlighting how the two metrics differ in sensitivity to family data. These two sections collectively illustrate the importance of the true haplotype frequency distribu-tion in determining the magnitude of reconstrucdistribu-tion er-ror as well as the effectiveness of reallocating resources for family data. In the last section, we discuss the sensi-tivity of a popular case-control association test to biased frequency estimates that are inferred by treating related individuals as unrelated.
Impact of family data on haplotype frequency es-timation: We start by observing that for a given family size, increasing family information typically results in an
improvement in accuracy (i.e., discrepancy decreases along a given row). However, adding family information does not always contribute to accuracy, as can been seen in the case of adding the genotype from a single parent (Table 3, C). This is because the number of progeny is sufficient to explain the parental phase and therefore the sire genotype provides redundant information. By contrast, there is always an improvement in discrepancy if both parental genotypes are included (Table 3, D). This is because the second parental genotype will always provide information regarding an additional indepen-dent haplotype (which follows from our assumption of one progeny per dam).
TABLE 3
Impact of family size, family information, and parental haplotype distribution on estimated haplotype frequencies, as measured by the discrepancy statistic (top) and on phase reconstruction error (bottom)
Family size UN P PS PSD
Haplotype frequency discrepancies
APOE1 1 0.116A 0.116 A, B, F 0.078 B 0.063 B
2 0.123 0.117 0.095 0.070
5 G 0.143 0.119 0.109 F 0.077
10 0.162 0.119 E 0.116 E 0.081
25 0.212 0.122 C 0.122 C, D 0.082 D
APOE2 1 0.082 0.082 0.061 0.049
2 0.091 0.088 0.077 0.060
5 0.110 0.097 0.090 0.065
10 0.132 0.103 0.099 0.066
25 0.180 0.104 0.104 0.070
IL8E 1 0.047 0.047 0.037 0.032
2 0.054 0.054 0.051 0.040
5 0.065 0.060 0.058 0.043
10 0.085 0.065 0.063 0.046
25 0.110 0.068 0.068 0.047
Phase reconstruction error rate
APOE1 1 0.21A9 0.21 B9, F9 0.12 B9, H 0.06 B9, I
2 0.20 0.17 0.10 0.03
5 G9 0.19 0.12 H 0.06 F9, I 0.02
10 0.18J 0.07 J 0.05 0.02
25 0.15J 0.06 J 0.06 0.02
APOE2 1 0.13 0.13 0.08 0.04
2 0.13 0.11 0.07 0.03
5 0.13 0.09 0.05 0.02
10 0.11 0.06 0.05 0.02
25 0.11 0.05 0.04 0.02
IL8E 1 0.00 0.00 0.00 0.00
2 0.00 0.00 0.00 0.00
5 0.00 0.00 0.00 0.00
10 0.00 0.00 0.00 0.00
25 0.00 0.00 0.00 0.00
This example demonstrates how increasing the num-ber of independent haplotypesor the amount of fam-ily information improves accuracy. The question of whether resources intended for population data should be reallocated for family data is concerned with whether one should be increased at the expense of the other. This question was addressed for the case of nuclear fami-lies vs. unrelated individuals in several studies, which showed that the optimal allocation decision will be frequency dependent (Beckerand Knapp2002; Schaid
2002). Our results illustrate that these frequency-dependent trade-offs between the quality and quantity of population data can be found for many pedigree con-figurations. Specifically, we compare the accuracy of 200 independent haplotypes from a sample of unrelated individuals to 140 independent haplotypes segregating in 20 half-sib pedigrees of size 5 with a typed sire (Table 3, F). For the APOE1 distribution, better accuracy is achieved from using more family data and fewer in-dependent haplotypes, while for theAPOE2 and IL8E
distributions more independent data are preferable to family data. As discussed in the previous section, a ran-dom sample generated from theAPOE1distribution will have the most uncertainty associated with phase assign-ments and therefore will benefit most from family data. We also observe that when family data are ignored (i.e., related individuals are treated as unrelated) discrepancy increases with family size (Table 3, G). This follows since increasing family size (i.e., increasing the number of conditional dependencies in the data) im-plies further deviation from the assumption of un-related (independent) individuals. We evaluate these results squarely in the context of association analysis at the end of this section.
Impact of family data on phase reconstruction ac-curacy: The most striking result is the uniformly per-fect phase reconstruction given byIL8E, which provides
an example of a distribution where family data are redundant despite .50% of a sample containing am-biguous genotypes. These results are consistent with the frequency-known error rate given in Table 2. We note that for all three distributions, the observed error rate (Table 3, A9) is fairly close to the frequency-known error rate, which is the best-case average error rate that can be achieved when using the EM algorithm. In this context, it is reasonable to claim that EM-based phase assign-ments are accurate.
For theAPOE1andAPOE2distributions, increasing sib size and adding parental marker data always improve phase reconstruction accuracy. Specifically, as we move down a given column or across a row for either distribu-tion, we observe agradualdecrease in phase reconstruc-tion error rate. It should be noted that when resources are fixed, increasing family size decreases the number of independent haplotypes used in the subsequent study, and therefore this gain in phase reconstruction accu-racy may not be justified.
While phase reconstruction error decreases with family information, it is not eliminated. Even for very large sib sizes, there is a small, but significant error when both parental genotypes are provided. Note also that for both distributions, there is also a discernable increase in the error rate when only the genotype for the common parent is provided. However, results for theAPOE1 distri-bution are consistently worse than those for theAPOE2 distribution. These observations highlight the impor-tance that both the frequency distribution and the ped-igree structure have in determining whether resources should be allocated to ascertain family data.
Although increasing both sib size and parental marker information will improve phase reconstruction accu-racy, obtaining parental marker data is more efficient than adding more half-sibs. For both distributions, in-troducing genotype data for an untyped parent is more efficient than introducing as many as five additional half-sibs (Table 3, H and I). This complements the re-sults that show that two full-sibs with untyped parents can be very inefficient in the context of optimal fre-quency estimation (Schaid2002).
It is important to recognize that reconstruction ac-curacy for progeny does not extend to parents. This means that parental phase may still be incorrectly re-constructed even when reconstruction is accurate for progeny. Adding half-sibs will help reconstruct phase for an untyped common parent, yet our results show that the total number of half-sibs needed to make this parental genotype redundant can be quite large. For each of the three distributions, we see that a typed sire still provides a small, but significant, improvement in discrepancy when as many as 10 progeny are available (Table 3, E). Introducing sibs without genotyping parents can actually be worse than reconstruction from population data if this information is to be used in a subsequent LD model that relies on haplotype accuracy of both parents and progeny (Meuwissen et al. 2002;
Leeandvan derWerf2004).
related individuals that are treated as unrelated in-creases (Table 3, G9). This paradox can be explained by noting that for more closely related individuals, there is a higher probability that two haplotypes are identical by descent (i.e., more homozygosity) in the genotype data.
Fallinand Shorck(2000) made a similar observation
when investigating the robustness of the EM algorithm to departures from Hardy-Weinberg Equilibrium by imposing homozygosity on the haplotype data. When individuals are related, however, the appropriate com-parison is not the ‘‘benefit’’ in phase reconstruction ac-curacy relative to unrelated individuals, but the loss by not properly accounting for the conditional dependen-cies in the data. This loss can be quite large as seen in the case of APOE1, where .10 haplotypes are incorrectly assigned by not accounting for underlying pedigree structure (Table 3, J).
An application to association analysis: We now eval-uate the discrepancy that arises from treating related individuals as unrelated (Table 3, G), in the context of an association analysis. This is relevant for many natural and domestic populations, where, in the ab-sence of pedigree information, a sample may be treated as unrelated even through the sampled members can be closely related. A popular test that utilizes haplotype frequencies directly is a chi-square test, which is used to detect association in a case-control study (Zhao et al.
2000). While variants of the test have been proposed
(Fallin et al.2001), the underlying principle remains
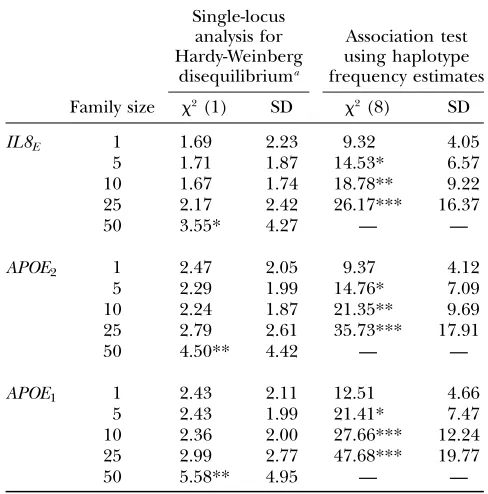
that if a causative variant is linked to a marker haplotype, then case haplotype frequencies should differ from those of the control frequencies. A type I error occurs when the reconstructed frequencies for case and con-trol data are considered significantly different, yet the markers are actually unlinked with a causative variant. Treating related individuals as unrelated might be ex-pected to increase the probability of committing a type I error, since variability that naturally arises between two groups sampled from the same neutral region will be accentuated when the data are dependent. To investigate the impact of using these reconstructed frequencies on a type I error, we simulate neutral marker data for hypothetical cases and controls from two repetitions of the simulation process described above. We estimate frequencies under the assumption that individuals are unrelated and then calculate the chi-square statistic on the basis of the reconstructed frequencies. The results are presented in Table 4, columns 4 and 5. They reveal that an inflated type I error is likely to be realized for a family size of 5 for each of the distributions. Even though the actual discrepancy statistic is uniformly greatest for theAPOE1and least for
IL8E, the rate at which significance increases with family
size is fairly consistent for each of the three distribu-tions: the principal difference lies in the standard deviation. We also ran a standard single-locus Hardy-Weinberg test for each of the loci and present the results
in Table 4, columns 2 and 3. This reveals that data sets that are sufficiently related to exhibit a type I error in case-control association analysis will not be detected using the standard single-locus Hardy-Weinberg test.
DISCUSSION
The results of this study have significant implications for an experimental design using two-stage haplotype analysis. The effectiveness of a two-stage haplotype analysis will be contingent on two factors: (1) the mag-nitude of the estimation error, which we have shown depends on the haplotype frequency distribution, and (2) the sensitivity of the subsequent haplotype-based analysis to this estimation error, which can be deter-mined from simulation studies.
EM-based haplotype frequency estimates are often considered accurate for sample sizes consisting of100 individuals (Fallinand Shorck2000; Qinet al.2002).
For smaller samples sizes, or for samples featuring large amounts of missing genotype data, a Bayesian approach may be more appropriate (Stephenset al. 2001; Niu et al.2002). The EM algorithm is also considered to pro-vide accurate results under departures from the ran-dom-mating assumption (Fallin and Shorck 2000).
TABLE 4
Impact of treating half-sibs as unrelated on two nonparametric tests: single-locus tests for Hardy-Weinberg Disequilibrium
and nonhomogeneity of haplotype frequency profiles for case control data in a neutral genomic region
Single-locus analysis for Hardy-Weinberg
disequilibriuma
Association test using haplotype frequency estimates
Family size x2(1) SD x2(8) SD
IL8E 1 1.69 2.23 9.32 4.05
5 1.71 1.87 14.53* 6.57
10 1.67 1.74 18.78** 9.22
25 2.17 2.42 26.17*** 16.37
50 3.55* 4.27 — —
APOE2 1 2.47 2.05 9.37 4.12
5 2.29 1.99 14.76* 7.09
10 2.24 1.87 21.35** 9.69
25 2.79 2.61 35.73*** 17.91
50 4.50** 4.42 — —
APOE1 1 2.43 2.11 12.51 4.66
5 2.43 1.99 21.41* 7.47
10 2.36 2.00 27.66*** 12.24 25 2.99 2.77 47.68*** 19.77
50 5.58** 4.95 — —
*Significance at 90%; **significance at 95%; ***signif-icance at 99%. Numbers of loci are in parentheses.
However, our results demonstrate that failing to account for related individuals in a sample (by treating each member in the sample as independent) can lead to an appreciable increase in type I error in a study where two populations are contrasted using EM-based haplotype frequencies. In natural populations featuring sibships, it is important to ascertain pedigree information,e.g., by sibship reconstruction methods described by Thomas
and Hill(2002), before using this test.
The results of Morris et al. (2004) clearly
demon-strate that phase assignments based on the most likely phase criterion should not be blindly used in a sub-sequent haplotype-based analysis. We show that while reconstruction errors may be unavoidable (i.e., inde-pendent of sample size), this error rate can be calcu-lated directly from the frequency distribution. We also provide an example where the most likely phase cri-terion will yield perfectly accurate results, even for a sample containing a large proportion of ambiguous genotypes.
Practically, we can calculate the error rate from an estimated frequency distribution that is based on a preliminary sampling of the population. This estimated error rate can then be compared against a predeter-mined threshold denoting the minimum level of phase accuracy. If the predicted phase reconstruction error exceeds this threshold, then either pedigree data are required or an alternative to the two-stage approach must be used.
The effectiveness of pedigree data will also depend on the haplotype frequency distribution, as well as on the type of pedigree information provided. We considered two kinds of information: increasing the family size and introducing parental marker data. For half-sibs, intro-ducing parental genotypes is more efficient than in-creasing family size and leaving parents untyped. In general, assessing the effectiveness of pedigree struc-ture and frequency distribution on haplotype inference can be done through a simulation study based on the inferred frequencies.
In conclusion, we have confirmed that the biased haplotype frequency estimates that result from treating related individuals as unrelated can affect association analysis, and we have provided the appropriate statisti-cal methods to efficiently accommodate some impor-tant population structures. We have also demonstrated how to forecast the accuracy of phase reconstruction on the basis of the most likely phase criterion, which will determine whether pedigree data are warranted. We find that the impact of pedigree data depends upon the actual haplotype structure in the population. Since this structure will vary throughout the genome, a single optimal strategy for accurate haplotype reconstruction from markers used in genomewide scans is unlikely. Rather, the impact of various pedigree data on partic-ular subsets of markers can be assessed through a simulation study based upon initial frequency estimates.
The authors thank Sarah Blott and two anonymous reviewers for their valuable suggestions. Michael Schouten also thanks Michalis Titsias for his technical insight and Alan Stubbs and Vivian Fu for their comments on the manuscript. This research was supported by Sygen International and by the Biotechnology and Biological Sciences Research Council.
LITERATURE CITED
Becker, T., and M. Knapp, 2002 Efficiency of haplotype frequency estimation when nuclear family information is included. Hum. Hered.54:45–53.
Elston, R., and J. Stewart, 1971 A general model for the genetic analysis of pedigree data. Hum. Hered.21:523–542.
Excoffier, L., and M. Slatkin, 1995 Maximum-likelihood estima-tion of molecular haplotype frequencies in a diploid populaestima-tion. Mol. Biol. Evol.12:921–927.
Fallin, D., and N. Shorck, 2000 Accuracy of haplotype frequency estimation for biallelic loci, via the expectation-maximization algorithm for unphased diploid genotype data. Am. J. Hum. Genet.67:947–959.
Fallin, D., A. Cohen, L. Essioux, I. Chumakov, M. Blumenfeld et al., 2001 Genetic analysis of case/control data using hap-lotype frequencies: application to APOE locus variation and Alzheimer’s disease. Genet. Res.11:143–151.
Grapes, L., J. Dekkers, M. Rothschildand R. Fernando, 2004 Com-paring linkage disequilibrium-based methods for fine mapping of quantitative trait loci. Genetics166:1561–1570.
Hawley, M., and K. Kidd, 1995 HAPLO: a program using the EM algorithm to estimate the frequencies of multi-site haplotypes. J. Hered.86:409–411.
Hill, W. G., 1974 Estimation of linkage disequilibrium in randomly mating populations. Heredity33:229–239.
Hull, J., H. Ackerman, K. Isles, S. Usen, M. Pinderet al., 2001 Un-usual haplotypic structure of IL8, a susceptibility locus for a common respiratory virus. Am. J. Hum. Genet.69:413–419. Kirk, K. M., and L. R. Cardon, 2002 The impact of genotyping
error on haplotype reconstruction and frequency estimation. Eur. J. Hum. Genet.10:616–622.
Lee, S. H., and J. H. van der Werf, 2004 The efficiency of designs for fine-mapping of quantitative trait loci using com-bined linkage disequilibrium and linkage. Genet. Sel. Evol.36:
145–160.
Meuwissen, T. H. E., A. Karlsen, S. Lien, I. Olsakerand M. E. Goddard, 2002 Fine mapping of a quantitative trait locus for twinning rate using combined linkage and linkage disequilib-rium mapping. Genetics161:373–379.
Morris, A., J. Whittakerand D. Balding, 2002 Fine-scale map-ping of disease loci via shattered coalescent modeling of geneal-ogies. Am. J. Hum. Genet.70:686–707.
Morris, A., J. Whittaker and D. Balding, 2004 Little loss of information due to unknown phase for fine-scale linkage-disequilibirium with single-nucleotide-polymorphism genotype data. Am. J. Hum. Genet.74:945–953.
Niu, T., Z. S. Qin, X. Xuand J. S. Liu, 2002 Bayesian haplotype in-ference for multiple linked single-nucleotide polymorphisms. Am. J. Hum. Genet.70:157–169.
O’Connell, J. R., 2000 Zero-recombinant haplotyping: applications to fine mapping using SNPs. Genet. Epidemiol.19:S582–S587. Ploughman, L. M., and M. Boehnke, 1989 Estimating the power of a proposed linkage study for a complex genetic trait. Am. J. Hum. Genet.44:543–551.
Qin, Z. S., T. Niuand J. S. Liu, 2002 Partial-ligation-expectation-maximization for haplotype inference with single nucleotide polymorphisms. Am. J. Hum. Genet.71:1242–1247.
Rohde, K., and R. Fuerst, 2001 Haplotyping and estimation of hap-lotype frequencies for closely linked biallelic multilocus genetic phenotypes including nuclear family information. Hum. Mutat.
17:289–295.
Schaid, D. J., 2002 Relative efficiency of ambiguous vs. directly mea-sured haplotype frequencies. Genet. Epidemiol.23:426–443. Stephens, M., and P. Donnelly, 2003 A comparison of Bayesian
Stephens, M., N. J. Smithand P. Donnelly, 2001 A new statistical method for haplotype reconstruction from population data. Am. J. Hum. Genet.68:978–989.
Terwilliger, J., and J. Ott, 1994 Handbook of Human Linkage Anal-ysis.Johns Hopkins University Press, Baltimore.
Thomas, S. C., and W. G. Hill, 2002 Sibship reconstruction in hierarchical population structures using Markov chain Monte Carlo techniques. Genet. Res.79:227–234.
Zhao, H., R. Pfeifferand M. H. Gail, 2003 Haplotype analysis in population genetics and association studies. Pharmacogenomics
4:171–178.
Zhao, J. H., D. Curtisand P. C. Sham, 2000 Model-free analysis and permutation tests for allelic associations. Hum. Hered.50:
133–139.
Communicating editor: J. B. Walsh
APPENDIX: AN EFFICIENT ALGORITHM FOR EVALUATING HALF-SIB PEDIGREES
Our objective is efficient computation of the poste-rior distributions for sire and dam phase configurations, which are required to calculate the complete-data log-likelihood given in (4). We begin by describing a straight-forward peeling approach to obtain the posterior for the sire. We then demonstrate how the results obtained during the peeling process can be used for efficient calculation of the dam distribution. Both of these ap-proaches achieve cubic complexity in the number of possible phase configurations. We conclude by demon-strating how complexity can be reduced to quadratic complexity, which, as described in the text, can result in substantial savings in computational resources.
To minimize notational clutter we drop explicit references to ˜Q and F, and it should be understood that this information is given. Furthermore, since we are talking about the distribution for a specific sire or dam, we can drop any index that refers to an order in the sample. Hence,
pðsijQ˜;y;F Þ ¼: pðsjyÞ: ðA1Þ
Finally, we need to reference other members in a given sibship. For a sibship of sizeK, we assign an arbitrary ordering to all progeny and dam pairs and use (yi,di), i¼1,. . .,K, to refer to theith pair.
Calculating the distribution of the sire phase: We begin by writing the objective as
pðsjyÞ ¼ P
dpðs;d;yÞ
pðyÞ : ðA2Þ
Using the key insight of Elstonand Stewart(1971),
the joint distribution is expressed as a telescopic sum,
pðy;sÞ ¼pðsÞY
K
k¼1 X
dk
pðykjs;dkÞpðdkÞ
( )
; ðA3Þ
where
pðykjs;dkÞ ¼
X
z2zðyiÞ
pðzijs;diÞpðyijziÞ: ðA4Þ
Peeling thejth family first entails calculating
pðs;yjÞ ¼X
dj
pðs;yj1Þpðyjjs;djÞpðdjÞ; ðA5Þ
whereyj1¼y0,y1,. . . ,yj1andy0¼B. The likelihood is then updated to
pðyÞ ¼pðs;yjÞ Y
K
k¼j11 X
dk
pðykjs;dkÞpðdkÞ
( )
:
Each family is iteratively peeled and, after the final family has been peeled, the resulting expression,p(y,s), can be used to calculate p(sjy). p(y) can then be ob-tained by summing outs.
Calculating the posterior for the dam: First, we can rewrite our objective as
pðdjjyÞ ¼X
s
pðs;djjyÞ
¼ 1
pðyÞ X
s
pðs;dj;yÞ
¼ 1
pðyÞ X
s
pðs;yjÞpðyjjdj;sÞpðdjÞ; ðA6Þ
where efficient calculation ofp(y) is given above and the definition ofp(s,yj) is given by
pðs;yjÞ ¼pðs;y0;y1;. . .;yj1;yj11;. . .;yKÞ:
To calculate p(s, yj), we must store each of the K
expressions given by (A5),i.e.,
pðs;yjÞ; j¼0;. . .;K: ðA7Þ These are sufficient to calculatep(s,yj) since
pðs;yÞ
pðs;yjÞ " #
pðs;yj1Þ ¼ QK
i¼1pðyijsÞ Qj
i¼1pðyijsÞ
pðs;yj1Þ
¼ Y
K
i¼j11
pðyijsÞpðs;yj1Þ
¼pðyj11;. . .;yKjsÞpðs;yj1Þ
¼pðs;yjÞ: ðA8Þ
Further reduction in complexity: From Equations A4 and A8, we see that the complexity of the phase distribution for both sire and dam is dominated by the expression p(yjs,d), which is cubic in the number of phase configurations. To achieve quadratic complexity, we show how to calculate this expression by evaluating
Consider first evaluating the relevant expression for the sire where the genotype of the dam is unknown. Rather than summing over all the dam configurations, as suggested by (A3), we attempt to directly evaluate
pðy;sÞ ¼pðsÞY
K
k¼1
pðykjsÞ: ðA9Þ
A given set of phase configurations, z 2 z(yk), can be
expressed as
pðz¼hi;hjjs¼hk;hlÞ: ðA10Þ
Lett1(s) denote the event that the sire transmittedhk
and lett2(s) denote the event that the sire transmittedhl.
Then (A10) can be written as
pðz¼hi;hjjs¼hk;hlÞ ¼pðz;t1ðsÞÞ1pðz;t2ðsÞÞ ðA11Þ
¼pðzjt1ðsÞÞpðt1ðsÞÞ1pðz;t2ðsÞÞpðt2ðsÞÞ;
ðA12Þ
where p(t1(s)) ¼ p(t2(s)) ¼ 1
2. Importantly, p(zjt1(s)) and p(zjt2(s)) can be calculated directly from ˜Q; for example,
pðzjt1ðsÞÞ ¼ ˜
uj k¼i
˜
ui k¼j
0 otherwise:
8 <
: ðA13Þ
When the genotype of the dam is known, the probabil-ities in (A13) can be calculated from the distribution
pðdjQ˜Þ. Evaluating Pspðyjs;dÞ follows an analogous