PRELIMINARY ANALYSIS OF FLOOR RESPONSE SPECTRA OF A
SEISMICALLY BASE ISOLATED NUCLEAR POWER PLANT
Jenna Wong1 and Stephen Mahin2
1 Ph.D. Candidate, Dept. of Civil and Environmental Engineering, University of California, Berkeley, CA 2 Professor, Dept. of Civil and Environmental Engineering, University of California, Berkeley, CA
ABSTRACT
The purpose of this preliminary study is to investigate the effects of seismic base isolation on the floor response spectra at key locations in a nuclear power plant. Seismic isolation is increasingly being used in both traditional and industrial structures for its ability to reduce structural responses while effectively protecting sensitive building contents, such as machinery.
Floor response spectra analysis is conducted by two different means. The first is the traditional use of time history analysis. The second is the use of complex modal analysis that utilizes response spectra as an input. For this study, the work focuses on the representative models of auxiliary and reactor buildings that house the majority of the essential equipment for continued operation. The motion of and application of ground motions to the structure are restricted to the horizontal plane. This provides a basic knowledge of interaction between the isolation and structure prior to the introduction of any other motion such as vertical ground motions. Ground motions considered are consistent with a 10,000-year event based on requirements from U.S. Nuclear Regulatory Commission Guidelines for a plant located in the central and eastern portions of the United States.
From these floor response spectra, conclusions are drawn concerning the effectiveness of various isolation systems, influence of ground motions on response, differences in response at various locations in the structure, as well as potential areas for future research to make isolation a viable technology in the nuclear sector.
INTRODUCTION
The nuclear power industry worldwide is experiencing a number of changes in terms of technology, requirements from regulators, and general expectations from the communities they serve. In the US, nuclear power is experiencing an opportunity for rebirth in the energy sector. Given the increased energy demand and desire to find alternative clean sources of energy, nuclear power is actively being considered in many parts of the world.
Over the past 30 years, the U.S. nuclear industry has not seen the construction of a major power plant. It was not until early 2012 that the U.S. Nuclear Regulatory Commission (NRC) certified a new plant for construction since the 1970s. With this in mind, the technology behind the latest reactors has significantly advanced since the last major US plant construction. However, at this point, there is a great opportunity to explore opportunities to improve the safety and performance of a nuclear power plant (NPP) through the use of advanced structural engineering concepts, such as seismic isolation.
Seismic isolation is a mature technology that has been applied to seismic protection of various types of critical infrastructure facilities, including nuclear power plants and related nuclear facilities. Development of the technology continues at a rapid pace to improve seismic performance, as well as to extend the load and displacement capacities and durability of isolation devices in the face of ever more challenging seismic environments.
characterization of seismic hazards, and introduce performance-based design approaches, it is logical to explore more fully the application of seismic isolation to nuclear power plants.
This paper discusses a simplified case study to understand how a nuclear power plant responds to ground motions for a non-isolated (fixed based) and isolated case. Floor response spectra analyses are conducted by two different means of comparison. The first is the traditional use of time history analysis (THA). The second is the use of complex modal analysis that utilizes response spectra as an input.
MODEL
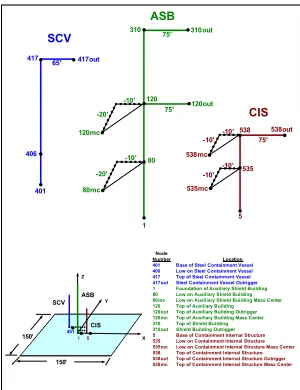
For the various scenarios investigated, a representative plant is used that is based on an simplified AP1000 model provided by the Electric Power Research Institute (EPRI) as shown in Figure 1.
Study Input Parameters
! ! " #$% %#& '%( )*+, )*+, -.+) .+) .+/ .)0 /*, .)0123
4+ 5)+ )6+78 )6+123 5)+123 ) )6+ 96+, 9)+, 4+78 96+, 9)+, 0*, )* :;1<= ;27>=? @18A3B1C .+) ::::(AD=:1E:%3==F:#1C3ABC7=C3:&=DD=F .+/ ::::@1G:1C:%3==F:#1C3ABC7=C3:&=DD=F .)0 ::::H1I:1E:%3==F:#1C3ABC7=C3:&=DD=F .)0123 ::::%3==F:#1C3ABC7=C3:&=DD=F:J23?BKK=? ) ::::L12C<A3B1C:1E:'2MBFBA?N:%OB=F<:(2BF<BCK 4+ ::::@1G:1C:'2MBFBA?N:%OB=F<:(2BF<BCK 4+78 ::::@1G:1C:'2MBFBA?N:%OB=F<:(2BF<BCK:PADD:#=C3=? )6+ ::::H1I:1E:'2MBFBA?N:(2BF<BCK )6+123 ::::H1I:1E:'2MBFBA?N:(2BF<BCK:J23?BKK=? )6+78 ::::H1I:1E:'2MBFBA?N:(2BF<BCK:PADD:#=C3=? 5)+ ::::H1I:1E:%OB=F<:(2BF<BCK 5)+123 ::::%OB=F<:(2BF<BCK:J23?BKK=? * ::::(AD=:1E:#1C3ABC7=C3:$C3=?CAF:%3?2832?= *5* ::::@1G:1C:#1C3ABC7=C3:$C3=?CAF:%3?2832?= *5*78 ::::@1G:1C:#1C3ABC7=C3:$C3=?CAF:%3?2832?=:PADD:#=C3=? *54 ::::H1I:1E:#1C3ABC7=C3:$C3=?CAF:%3?2832?= *54123 ::::H1I:1E:#1C3ABC7=C3:$C3=?CAF:%3?2832?=:J23?BKK=? *5478 ::::H1I:1E:#1C3ABC7=C3:$C3=?CAF:%3?2832?=:PADD:#=C3=? * 0*, 9)+, 9)+, *5* *54123 *5*78 *5478 *54 9)+, 9)+, %#& '%( 0*, #$% Figure 2-6
Advanced Reactor Structure Stick Model With Outriggers and Offset Mass Centers
2-9
Figure 1. AP1000 Model (EPRI and USDOE, 2006)
There are three major components to this model, which include the ASB, CIS, and SCV. ASB is the Auxiliary Containment Structure that consists of an Auxiliary Building and the reinforced concrete containment structure. The CIS is the Containment’s Internal Structure, which is comprised of the reactor’s equipment and machinery. Finally, the SCV is the Steel Containment Vessel, which can exist either as a steel lining on the containment structure or an enclosing vessel around the internal structure. Based on the goals of this investigation, work will focus on the ASB component with the AP1000 model simplified by removing the massless outriggers and restricting motion to a single horizontal direction.
SITES
Several locations were selected for the response spectra and time history analyses. For the response spectra analysis, two sites in the eastern U.S. were selected: Manchester, New Hampshire and Savannah, Georgia. These were two of seven sites detailed in assessments reported in Central and Eastern United States (CEUS) Seismic Source Characterization for Nuclear Facilities, EPRI (2012). This report was carried out as a joint project of EPRI, the U.S. NRC, and the U.S. Department of Energy. The Manchester and Savannah sites were chosen to consider locations with fundamentally different seismic source characteristics. Thus, one site was selected in New England and the other from the South Eastern part of the U.S.
three levels of ground shaking need to be considered for an isolated NPP: Ground Motion Response Spectrum (GMRS), Extended Design Basis (EDB), and HCLPF Extended Design Basis Ground Motion Spectrum (HEBD GMRS). The GMRS has an annual frequency of exceedence less than 1x10⁻⁴ (USNRC, 2012). This corresponds to an earthquake with a return period of 10,000 years.
For this preliminary study, the GMRS was generated by utilizing information provided for the two sites in the new Seismic Source Characterization Report and using procedures outlined for Newmark and Hall to develop spectra for different conditions. The soil classifications considered are: Hard Rock, Deep Soil, and Shallow Soil.
For the time history analysis, the Pacific Earthquake Engineering Research (PEER) Research Center has an extensive database of ground motions for the West Coast. In terms of the central and eastern U.S., a similar database is not yet available but is being developed under PEER’s NGA East project. There are several ground motion records available, however, their magnitudes are relatively low and would require scaling for an effective time history analysis.
Scaling of earthquake ground motions is a very controversial topic. The main reason behind this issue is the expected changes in the frequency content with ground motion intensity. This can result in the modification of energy characteristics of the motion producing unrealistic results (Naeim and Kelly, 1999). Consequently, an alternative was needed.
The solution came in the form of simulated ground motions that were produced by Pacific Engineering (PE). These motions were simulated for a magnitude 7.6 earthquake approximately 43 miles (70 km) from the New Madrid source on the Mississippi Embayment. The New Madrid seismic zone is a source of intraplate earthquakes for the southern and midwestern section of the United States and the site of some of the largest earthquakes that have occurred in North America. This zone also has the potential to be the source of future large magnitude earthquakes. Based on this setting, PE simulated ground motions for hard rock and deep soil scenario by randomizing a number of parameters. These histories are all based on seismic source characterizations that do not include the newly updated information from EPRI’s CEUS Report.
FLOOR RESPONSE SPECTRA FROM TIME HISTORY ANALYSIS
Floor response spectra were generated for six ground motions, 3 for hard rock and 3 for deep soil, for three different scenarios including non-isolated (fixed based) and isolated using low damping rubber bearings (LDRB) and lead plug rubber bearings (LPRB). The bearings were designed with the goal of a three second period of isolation with the LDRB exhibiting low damping at 2% and LPRB having 15% damping. This variation will provide insight into how bearing type and damping can impact response. The time history analysis was conducted using SAP2000.
Two locations in the ASB model were identified for investigation. The Control Room located in the ASB is the site at which the operators control and maintain observations over the entire system. If in the case of an accident or emergency after a seismic event, then it will be an essential part of this structure to ensure that operators can effectively work and execute any necessary shutdowns or procedures. The fuel building is where the nuclear materials are handled before and after use in the process of energy generation. The current model does not specify points within this structure with the most specific location being the roof. Thus, this point will be considered for the purpose of getting a general understanding for this section of the plant. Although there are numerous locations to investigate, the possibilities are quite limited due to the extent of information pertaining to the model specifics. These locations were selected due to their importance within the operation of the system and the availability of node location within the specific models. It is suggested that once more nodes can be identified that this analysis should be conducted to understand the impacts isolation has at those levels.
fuel building roof as seen in Figure 3. In this case, the deep soil scenario shows an even greater amplification at almost three times the input motion at its maximum. These types of amplifications can cause serious damage to sensitive equipment during times of emergency.
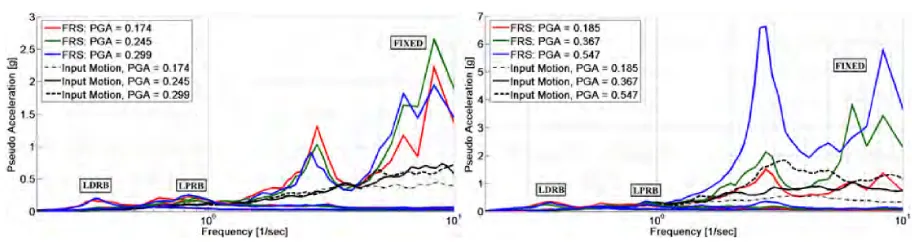
Figure 2. Non-Isolated Floor Response Spectra at Control Room-Hard Rock (Left) and Deep Soil (Right)
Figure 3. Non-Isolated Floor Response Spectra at Fuel Building Roof-Hard Rock (Left) and Deep Soil (Right)
With the introduction of isolation, there is a significant change in the accelerations at the key locations. This can be seen in Figures 4 to 6. For the hard rock scenarios, there is an amplification of the ground motion at low frequency levels that is exhibited for both the LDRB and LPRB. However, these amplifications do not occur in the area of concern for most equipment and machinery. Rather, in the 2 to 10 Hz range, the accelerations fall magnitudes below the input ground motion contrary to the non-isolated cases. Additionally, both the LDRB and LPRB showed a consistent behavior at both locations investigated. The relatively small differences in the accelerations are significant given that these locations are at least 6 stories apart vertically. In the non-isolated scenarios, the fuel building roof saw the introduction of additional peaks in the spectra with more fluctuation in the accelerations overall. The isolation has effectively controlled the response at various levels of the ASB structure.
Figure 5. LDRB Floor Response Spectra at Fuel Building Roof-Hard Rock (Left) and Deep Soil (Right)
Figure 6. LPRB Floor Response Spectra at Control Roof-Hard Rock (Left) and Deep Soil (Right)
Figure 6. LPRB Floor Response Spectra at Fuel Building Roof-Hard Rock (Left) and Deep Soil (Right)
Figure 8. Comparison of Isolated and Non-Isolated Floor Response Spectra at Fuel Building Roof-Hard Rock (Left) and Deep Soil (Right)
Figures 7 and 8 provide a comparison of the non-isolated and isolated floor response spectra against the input motion. The LDRB and LPRB both show a small amplification in ground motion, as previously discussed, but there is a frequency shift upon which this occurs. But as seen in comparison to the non-isolated case, the isolation has significantly improved the accelerations especially in the higher frequency range. For example, the control room on soft soil was resulting in responses that were approximately 4g. But with the introduction of the isolation, this was reduced to nearly 0.2g.
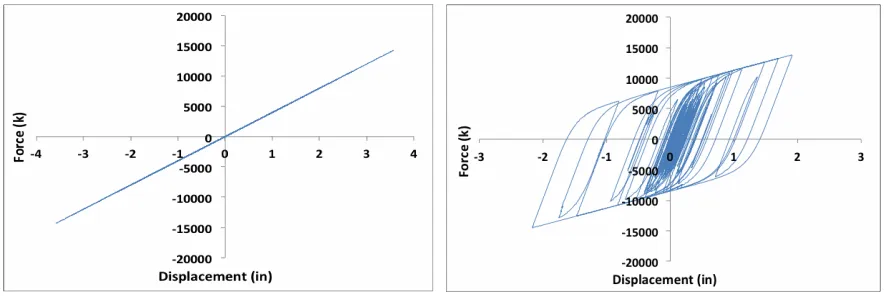
Another benefit of using TH analysis is the availability of information about the displacement and acceleration time histories along with hysteretic behavior of the isolators. As seen in Figures 9-11, the deep soil scenario is utilized as an example of the results observed. For Figure 9, the LDRB shows peak accelerations during the peak of the input ground motions with low fluctuation before and after this range of time. However, the LPRB shows a significant amount of acceleration fluctuation throughout the time span with slightly lower overall peak acceleration than the LDRB. Figure 10 gives insight into the overall displacement of the isolators. The LDRB displaces approximately 2 inches more than the LPRB but both appear to return back to the original starting point without a significant residual displacement. Figure 11 shows the hysteresis of the two isolators. The LDRB has linear behavior while the LPRB has a non-linear hysteretic with slightly rounded corners. These results show the LPRB is just as effective as the LDRB with reduced displacement however the nonlinearity in the hysteretic may be the root of additional fluctuations in response at various points in the time history. These changes could possibly filter through the structure creating localized peaks in the FRS. These isolator results provide a basis for future research to determine the causes and effects of localized peak responses.
With these results, the next step is to see how accurate and effective a response spectrum analysis can be as a preliminary step to studying these floor response spectra.
Figure 10. Displacement Time Histories for LDRB (Left) and LPRB (Right) for Deep Soil Ground Motion with a PGA = 0.547g
Figure 11. Hysteresis Loops for LDRB (Left) and LPRB (Right) for Deep Soil Ground Motion with a PGA = 0.547g
FLOOR RESPONSE SPECTRA FROM RESPONSE SPECTRUM ANALYSIS
For this analysis, the Manchester and Savannah spectra are used as inputs into MATALB codes that calculate the floor response spectra for the non-isolated and isolated models. These codes were initially developed by Dr. Tracy Becker (Becker, 2011) and modified for the purposes of this study. This code uses both generalized modal analysis and complete quadratic combination (CQC). More information on the procedural details can be found in papers by Igusa et al. (1984), Veletsos and Venture (1986), and Der Kiureghian (1981).
This analysis considered a series of variations to the damping and period of the isolators. The isolator periods considered are 2.0, 2.5, 3.0, 3.5, and 4.0 seconds. The effective damping ratios of 2%, 10%, 15%, and 20% are considered. A constant 2% damping was assigned to the ASB model. In this case, the isolator is not specific to a LDRB or LPRB but instead consider a variety of isolator parameters. Using the process and code as described above, the same points as in the time history analysis were studied in the ASB. Observed trends are generally discussed below using example plots as seen in Figures 12 and 13.
accelerations in comparison to the non-isolated case for the majority of the frequency range studied.
Figure 12. Comparison of Floor Response Spectra for Control Room for Manchester (Left) and Savannah (Right) on Soft Soil at 20% Damping for Isolation
Figure 13. Comparison of Floor Response Spectra for Fuel Building Roof for Manchester (Left) and Savannah (Right) on Soft Soil at 20% Damping for Isolation
CONCLUSION
Although the main trends were observed between both analyses, the RSA does not capture as much information. There are a number of fluctuations in the response, but the RSA shows smoother spectra. In the case of the non-isolated scenarios, there are a number of local peaks that occur, however, the RSA show a slow gradual increase that plateaus towards the higher frequencies. Due to this representation, there was the misconception of the motion amplification and did not accurately show the relative effectiveness of the isolation. In terms of the isolated cases, the RSA does provide relatively accurate results. This would be a good step in a study to evaluate the relative difference in accelerations that will be observed between non-isolated and isolated cases. However, if there were concerns for behavior in a specific frequency range, then a THA would be recommended.
In terms of the effectiveness of isolation, this study showed that this system is extremely capable of reducing responses in a structure. Even with the introduction of a low damping system like the LDRB, the structure can see major reductions in accelerations. But as seen in this report’s figures, there are variations in the maximum spectral values and the frequency ranges where this occurs. By exploring two different isolation scenarios, it is clear that isolation can be an adaptive system. The parameters surrounding the isolation design can be optimized for various design constraints.
respectively. The manner in which this changes the floor response spectra and the overall response at the various locations in the structure is an area for future work.
Additionally, these spectra showed very acute peaks at points of local maximum and minimum values. With these abrupt changes, there rises the question of high frequency impact on the overall system. This opens up another area for research in terms of evaluating the various models for the isolators and the ability to adapt these systems for more gradual changes in response.
This study was able to accomplish a number of tasks. Firstly, it showed the ability of isolation to reduce responses in a structure especially at key locations that are important to the operation of the NPP. Next, we explored the capabilities of creating floor response spectra in a non-traditional manner. Through this, we learned that response spectrum analysis is a great preliminary step into developing an understanding of the structural response of the isolated system. However, this analysis provides more of a statistical type of study where the likely response of the structure is produced. The time history analysis and the resulting floor response spectra give more insight that can provide viable information for the development of an effective isolation design.
REFERENCES
Becker, Tracy. (2011). “Advanced Modeling of the Performance of Structures Supported on Triple Friction Pendulum Bearings,” PhD thesis, University of California at Berkeley, California, USA.
Der Kiureghian, A. (1981). “A response spectrum method for random vibration analysis of MDF structures,” Earthquake Engineering and Structural Dynamics, 9, 419-435.
EPRI and USDOE (2006). “Program on Technology Innovation: Effect of Seismic Wave Incoherence on Foundation and Building Response”, Palo Alto, CA and Germantown, MD.
EPRI and USDOE (2012). “Technical Report: Central and Eastern United States Seismic Source Characterization for Nuclear Facilities,” Palo Alto, CA.
Igusa, T. and Der Kiureghian, A. (1985). “Generalization of floor spectra including oscillator structure interaction,” Earthquake Engineering and Structural Dynamics, 13, 661-676.
Igusa, T., Der Kiureghian, A. and Sackman, J.L. (1984). “Modal decomposition method for stationary response of non-classically damped systems,” Earthquake
Engineering and Structural Dynamics, 12, 121-136.
Naeim, Farzad, and Kelley, James M. (1999). Design of Seismic Isolated Structures: from Theory to Practice, John Wiley, New York.
Silva, Walter, Gregor, N., and Darragh, R. (1993). “Development of Regional Hard Rock Attenuation Relations for Central and Eastern North America, Mid-Continent and
Gulf Coast Areas.”
United States Nuclear Regulatory Commission. (2012). Technical Considerations for Seismic Isolation of Nuclear Facilities, Tech. Office Nuclear Regulatory Research Division of Engineering. Draft. Veletsos, A.S. and Ventura, C.E. (1986). “Modal analysis of non-classically damped