ABSTRACT
WINHAM, STACEY JEAN. Model Selection with Epistasis: A Focus on Comparative Performance and Prediction to Improve the Usability of Multifactor Dimensionality Reduction. (Under the direction of Dr. Alison Motsinger-Reif).
A principal goal in genetic epidemiology is to identify genetic risk factors for disease. It is hypothesized that common, complex diseases may be the result of a complex interplay between multiple genetic and environmental factors and that gene and
gene-environment interactions, or epistasis, may play an important role in the etiology of these types of diseases. Detecting these interactions in high-dimensional data is a difficult problem, which is exacerbated as the number of variables increases far beyond the sample size, as is common in studies of human genetics. As an alternative to traditional statistical methods, data-mining approaches designed to sift through large amounts of data are gaining popularity for association studies, performing variable selection and statistical modeling simultaneously. One of the most commonly used data-mining approaches to evaluate
potential gene-gene interactions is Multifactor Dimensionality Reduction (MDR). MDR is a combinatorial, exhaustive search method designed for retrospective association studies, which classifies individuals to disease status based on their genetic information. The objective of this dissertation will be to provide an in-depth investigation into the utility of this popular approach, including its strengths and weaknesses, and to propose extensions to improve the predictive performance and computational speed of the method.
We begin to examine the utility of the approach by evaluating the method’s
performance as compared to another popular variable selection approach, penalized logistic regression. We find that under certain conditions, MDR provides improved performance over the penalized techniques, whereas other times the penalized approach is superior. We describe when each method might be preferable to identify certain types of interactions.
We also consider the utility of MDR by focusing on the method’s usability to produce predictive models. Data-mining methods are typically aimed at prediction, and these
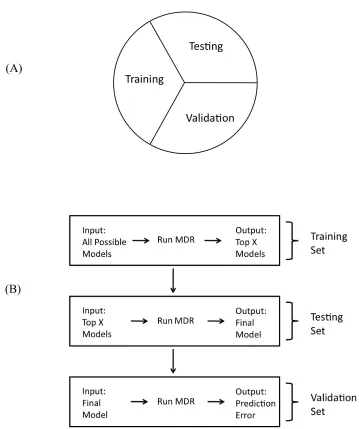
methods include internal validation procedures to assure that the constructed models will be good predictors of disease in the population rather than in a specific dataset. We investigate improving the MDR method by considering an alternative internal validation procedure to prevent over-fitting and improve the quality of predictive models, observing that an alternative technique, the three-way split, can reduce computation time without impairing performance.
We continue the focus on prediction by exploring the statistical properties of the MDR estimate of prediction error. For many applications, the usability of an MDR model requires that the identified gene-gene interactions can effectively predict disease status. We evaluate the predictive value of the retrospective MDR prediction error estimate by exploring its bias and variance and show that MDR can both underestimate and overestimate prediction error. The MDR estimate is constructed from retrospective data, but we argue that a
Model Selection with Epistasis: A Focus on Comparative Performance and Prediction to Improve the Usability of Multifactor Dimensionality Reduction
by
Stacey J. Winham
A dissertation submitted to the Graduate Faculty of North Carolina State University
in partial fulfillment of the requirements for the Degree of
Doctor of Philosophy
Statistics
Raleigh, North Carolina 2011
APPROVED BY:
_______________________________ ______________________________
Dr. Alison Motsinger-Reif Dr. Spencer Muse
Chair of Advisory Committee
________________________________ ______________________________
DEDICATION
BIOGRAPHY
Stacey (Wood) Winham was born on August 20, 1983 in Sioux Falls, South Dakota to Roger and Teresa Wood. As a child, she enjoyed learning and always had a thirst for knowledge in all subjects, including mathematics. In high school she was a dedicated student athlete in both gymnastics and track and field, but academics remained her primary focus. She graduated high school as a National Merit Finalist in 2002 and attended St. Olaf College in Northfield, Minnesota where her love of mathematics continued to blossom. While at St. Olaf, she had the opportunity to study mathematics in Budapest, Hungary and biostatistics in Geneva, Switzerland, and as an undergraduate researcher she became interested in statistics as an applied and interdisciplinary branch of mathematics, with a focus on health sciences. She graduated Summa Cum Laude with a B.A. in Mathematics and a concentration in Statistics in 2006. She moved to North Carolina to begin her graduate work in statistical genetics at North Carolina State University and received her Master’s degree in 2008. She augmented her statistical coursework and research with various applied collaborations and by teaching an introductory statistics course for undergraduates, helping others to understand and appreciate the field of statistics. She married her high school sweetheart, Dale Winham, in 2008, and they currently live in Raleigh, North Carolina with their curious cat, Tobias. She has accepted a position as a postdoctoral research fellow at the Mayo Clinic in
ACKNOWLEDGMENTS
A special thank you to my advisor, Dr. Alison Motsinger-Reif, for all of her encouragement, guidance, and especially enthusiasm. I have learned so much from her expertise, and without her advice, assistance, and reassurance this work would not have been possible. I would also like to thank my other committee members, Dr. Spencer Muse, Dr. Jung-Ying Tzeng, and Dr. Matthew Breen for their time and helpful contributions to enhance the quality of this work, and for Dr. Zhao-Bang Zeng for stepping in. I would also like to acknowledge my training grant, Grant Number T32GM081057 from the National Institute of General Medical Sciences and the National Institute of Health, for providing the financial support to make this research feasible. Additionally, this work is greatly strengthened by real data application, so thanks to Dr. David Haas from Vanderbilt University and the AIDS Clinical Trials Group (ACTG) for permission to use the HIV immunogenetics study data for methodological research. I would also like to extend my greatest appreciation to the rest of my NCSU family, both faculty and fellow students, for providing a sense of community and fostering stimulating intellectual growth.
inspired me to make statistical genetics a profession. She continually challenges me to push my limits, cultivating self-confidence and preparing me for the next step.
A simple thank you might not be enough to acknowledge my parents, Roger and Teresa, who have always done everything they could to assure that I would have all of the opportunities possible. They have been a constant source of love and support and have given me the confidence to achieve my goals. I am also extremely grateful for the support of my family (particularly my siblings) and close friends, who I can always count on to give me the strength necessary to persevere. Lastly, I reserve a great deal of gratitude for my
TABLE OF CONTENTS
LIST OF TABLES... viii
LIST OF FIGURES ... ix
INTRODUCTION ... 1
References Cited ...6
1 INVESTIGATING EPISTASIS: A LITERATURE REVIEW ... 7
1.1 Introduction... 7
1.2 Biological Epistasis... 10
1.3 Statistical Epistasis... 14
1.4 Interpretation... 17
1.5 Epistasis in Model Organisms ... 19
1.6 Epistasis in Humans... 22
1.7 Study Designs in Human Genetics ... 24
1.8 Traditional Statistical Methods ... 27
1.9 Novel Computational Methods ... 30
1.10 Multifactor Dimensionality Reduction ... 36
References Cited ... 40
2 A COMPARISON OF MULTIFACTOR DIMENSIONALITY REDUCTION AND L1-PENALIZED REGRESSION TO IDENTIFY GENE-GENE INTERACTIONS IN GENETIC ASSOCATION STUDIES ... 50
2.1 Introduction... 50
2.2 Methods... 53
2.2.1 Notation... 53
2.2.2 Multifactor Dimensionality Reduction ... 53
2.2.3 Traditional L1 Penalized Regression (LASSO)... 55
2.2.4 Group Lasso for Logistic Regression ... 58
2.3 Simulation Design and Analysis... 59
2.4 Results... 64
2.5 Discussion ... 71
References Cited ... 78
3 A COMPARISON OF INTERNAL VALIDATION TECHNIQUES FOR MULTIFACTOR DIMENSIONALITY REDUCTION... 81
3.1 Introduction... 81
3.2 Methods... 84
3.2.1 Multifactor Dimensionality Reduction ... 84
3.2.3 MDR with Three-Way Split... 89
3.2.4 Post-Hoc Pruning ... 92
3.2.5 Simulation Design... 93
3.2.6 Data Generation ... 94
3.2.7 HIV Immunogenetics Data ... 96
3.2.8 Analysis of Simulated Data ... 97
3.3 Results... 101
3.3.1 Simulation Results ... 101
3.3.2 Real Data Analysis... 111
3.4 Discussion ... 112
3.5 Conclusions... 117
References Cited ... 118
4 THE EFFECT OF RETROSPECTIVE SAMPLING ON ESTIMATES OF PREDICTION ERROR FOR MULTIFACTOR DIMENSIONALITY REDUCTION ... 122
4.1 Introduction... 122
4.2 Methods... 125
4.2.1 Multifactor Dimensionality Reduction ... 125
4.2.2 Retrospective Classification Error ... 127
4.2.3 Prospective Classification Error ... 129
4.2.4 Error Estimate for Bootstrap Resampling... 132
4.2.5 Simulation Study Design ... 133
4.2.6 Data Generation and Analysis ... 136
4.3 Results... 138
4.4 Discussion ... 145
References Cited ... 153
5 SOFTWARE FOR DETECTING GENE-GENE INTERACTIONS USING MULTIFACTOR DIMENSIONALITY REDUCTION: THE R PACKAGE MDR ...156
5.1 Introduction...156
5.2 Implementation ...157
5.3 Internal Validation ... 158
5.4 Methods... 159
5.5 Post-Hoc Functions for Inference ... 159
References Cited ... 161
6 CONCLUSION AND FUTURE DIRECTIONS... 162
APPENDICES ... 167
APPENDIX A Supplements to Chapter 2 ... 168
APPENDIX B Supplements to Chapter 3... 170
LIST OF TABLES
Table 1.1 Epistatic Interaction in Mouse Hair Color ... 11
Table 1.2 Penetrance function of a general two-locus interaction model... 12
Table 1.3 A heterogeneity model with two loci acting together... 13
Table 1.4 Chicken Varieties and Comb Type ... 19
Table 1.5 Genotype Distribution... 20
Table 1.6 Flower Color and Genotype Distribution ... 21
Table 2.1 Penetrance patterns for 2-locus epistatic models ... 61
Table 3.1 (A) Penetrance function for the XOR model (B) Penetrance function for the ZZ model ... 96
Table 3.2 Conservative and liberal power results for all single locus models... 102
Table 3.3 Conservative and liberal power for special epistatic models of size two loci... 106
Table 3.4 Average size of selected models by true model size... 106
Table 3.5 Significance of simulation factors on conservative and liberal power ... 107
Table 3.6 Results of the 5-fold cross-validation MDR analysis of the HIV pharmacogenomics data... 112
Table 3.7 Results of the 3WS MDR analysis of the HIV pharmacogenomics data 112 Table 4.1 Penetrance function patterns for data simulation... 135
LIST OF FIGURES
Figure 2.1 Penetrance function by genotype for XOR, BOX, and MOD patterns...61
Figure 2.2 Conservative power for increasing heritability for MDR, TL1, and GL1 ...65
Figure 2.3 Liberal power for increasing heritability for MDR, TL1, and GL1...66
Figure 2.4 True positive rates for increasing heritability for MDR, TL1, and GL1 ...68
Figure 2.5 False positive rates for increasing heritability for MDR, TL1, and GL1 ..69
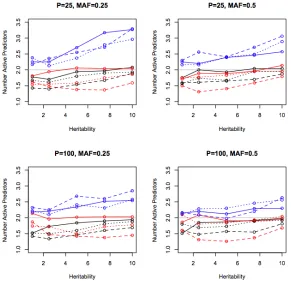
Figure 2.6 Average number of active predictors versus heritability for MDR, TL1, and GL1...70
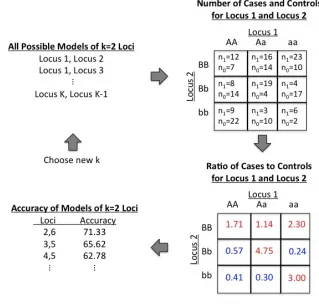
Figure 3.1 Overview of MDR method for k=2 loci...86
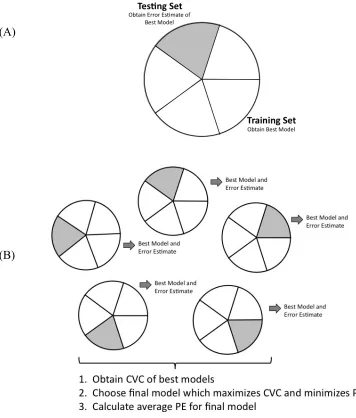
Figure 3.2 (A) 5-fold cross-validation split of the full sample data (B) Explanation of how 5-fold cross-validation is incorporated into the MDR method ...88
Figure 3.3 (A) Three-way split of the full sample data (B) Explanation of how the three-way split is incorporated into the MDR method...90
Figure 3.4 Conservative and liberal power for epistatic models with two loci...103
Figure 3.5 Conservative and liberal power for epistatic models with three loci...104
Figure 3.6 Conservative power for epistatic models with four loci ...105
Figure 3.7 Conservative and liberal power for epistatic models for two and three loci with MAF=0.5 ...110
Figure 4.1 Bias and variance of MDR and bootstrap estimates of prediction error by prevalence for a single locus model with dominant risk...138
Figure 4.2 Bias and variance of MDR and bootstrap estimates of prediction error by prevalence for a single locus model with recessive risk ...139
Figure 4.4 Bias and variance of MDR and bootstrap estimates of prediction error by prevalence for the two-locus XOR risk model ...140 Figure 4.5 Bias and variance of MDR and bootstrap estimates of prediction error
by prevalence for the two-locus ZZ risk model ...141 Figure 4.6 Bias and variance of MDR and bootstrap estimates of prediction error
by prevalence for the two-locus Box risk model ...141 Figure 4.7 Prospective bias and variance of CEMDR, CEBOOT with N=100, and
CEadj with known prevalence for the single locus model with additive risk...143 Figure 4.8 Prospective bias for CEBOOT with under-estimated and over-estimated
prevalence from np=100, 500 subjects compared with CEBOOT with
known prevalence and CEMDR for the two-locus ZZ risk model ...144 Figure 4.9 Variance for CEBOOT with under-estimated and over-estimated
prevalence from np=100, 500 subjects compared with CEBOOT with
INTRODUCTION
One of the primary objectives in human genetics is to characterize the translation of
genotype to phenotype; how our unique genetic codes dictate and influence our individual
traits. Specifically, genetic epidemiology aims to identify genetic risk factors associated with
human disease, which can be viewed as a statistical problem of variable selection. Recently,
scientific advances in both computer science and sequencing technology have caused an
explosion in the magnitude of the data now collected in human genetics. The amount of
high-dimensional data now available has created new analytical challenges as the number of
variables far exceeds the sample size. Variable selection techniques are needed to search
through these large amounts of data and isolate the important causal factors.
Furthermore, much evidence suggests that common, complex diseases are different in
nature from rare genetic disorders and are not explained by simple Mendelian inheritance
patterns with a small number of variants. Instead these types of diseases are more likely the
results of complex etiologies involving potentially many genes and environmental
components and complicated interactions between them [Moore 2003]. Such gene-gene
interactions, or epistasis, are difficult to identify in high-dimensional data using traditional
statistical approaches and more sophisticated methods are necessary to detect these complex
architectures for common diseases. Data-mining approaches are rising in popularity for
variable selection in association studies, and one method used to evaluate potential gene-gene
MDR is a nonparametric data-mining method designed specifically for retrospective
case-control association studies [Ritchie, et al. 2001]. It is a combinatorial, exhaustive search
approach to examine potential gene-gene interactions through data reduction. Currently the
most commonly used, novel approach to detect gene-gene interactions, it has been shown to
have good performance in simulation studies [Motsinger-Reif, et al. 2008]. MDR has also
been used in a number of real data applications, particularly in the area of pharmacogenomics
to investigate the predictive ability of gene-gene interactions for individual drug response.
The purpose of this dissertation is to explore the strengths, weaknesses, and potential
utility of this popular data-mining method to address the genetic problem through
comparison with other approaches and development and extension of the current
methodology. Specifically, we will compare MDR with other popular options; we will
consider alternative approaches to internal model validation; and we will evaluate the
statistical properties of the method and its predictive value. We begin with Chapter 1, a
background to the genetic problem of epistasis, including how it is defined and how it can be
detected. We will explore the failure of traditional approaches to identify gene-gene
interactions and the need for novel, data-mining methods to address this problem. We will
introduce the MDR method and give a review of the literature describing extensions to the
method and previous comparisons with other variable selection approaches. Subsequent
chapters will investigate the MDR methodology in depth and are organized such that they
can be read as separate, comprehensive articles addressing a specific issue.
Previously, MDR has been compared with a number of traditional and novel
now gaining increased recognition in the field of statistics. Penalized regression methods
such as the Least Absolute Shrinkage and Selection Operator (‘lasso’) are now being applied
to association studies, including extensions for interactions. In Chapter 2, we compare the
performance of MDR, the traditional lasso with L1 penalty (TL1), and the group lasso for
categorical data with group-wise L1 penalty (GL1) to detect gene-gene interactions through a
broad range of simulations [Park and Hastie 2007; Meier, et al 2008]. We find that each
method has both advantages and disadvantages, and relative performance is context
dependent [Winham, et al. 2011]. TL1 frequently over-fits, identifying false positive as well
as true positive loci. For epistatic models that exhibit independent main effects, the main
effects tend to dominate for both penalized methods and MDR has higher power. For purely
epistatic models, GL1 has the best performance for lower minor allele frequencies, but MDR
performs best for higher frequencies. These results indicate when each approach might be
preferred for detecting and characterizing different patterns of interaction.
In addition to comparison with other approaches, we can also consider potential
changes to the method to improve the performance and utility of MDR. In all data-mining
methods, it is important to consider internal validation procedures to obtain prediction
estimates to prevent model over-fitting and reduce potential false positive findings.
Currently, MDR utilizes cross-validation for internal validation. In Chapter 3, we
incorporate the use of a three-way split (3WS) of the data in combination with a post-hoc
pruning procedure as an alternative to cross-validation to reduce computation time without
impairing performance [Winham, et al. 2010]. We compare the power to detect true disease
epistatic disease models and we analyze a dataset in HIV immunogenetics to demonstrate the
results of the two strategies on real data [Haas, et al. 2006]. We find that MDR with 3WS is
computationally five times faster than 5-fold cross-validation. The power to find the exact
true disease loci without detecting false positive loci is higher with 5-fold cross-validation
than with 3WS before pruning, but the performance of the two internal validation methods is
equivalent with the use of post-hoc pruning procedures. This implies 3WS may be a
powerful and computationally efficient internal model validation approach to screen for
epistatic effects, and could be used to identify candidate interactions in large-scale genetic
studies.
Thus far research into MDR has concentrated on the performance of variable
selection, but we should also consider the usefulness of the identified models. Many
applications of genetic association studies focus on the predictive value of genetic
associations, requiring that identified gene-gene interactions can effectively predict the
response variable of interest. MDR relies on classification error to rank and evaluate
potentially predictive models based on retrospective data, producing estimates of prediction
error. Previous work has demonstrated the high power of MDR, but has not considered the
statistical properties of the MDR prediction error estimate. In Chapter 4, we evaluate the
bias and variance of the retrospective MDR error estimate and show that MDR can both
underestimate and overestimate prediction error. We argue that a prospective error estimate
is necessary if MDR models are used for prediction, and propose a bootstrap resampling
[Winham and Motsinger-Reif 2011]. We demonstrate that this bootstrap estimate is
preferable for prediction to the error estimate currently produced by MDR.
In Chapter 5, we introduce new software to implement the MDR methodology
described in the previous chapters using the R statistical programming language. We
describe an R package designed to provide an alternative implementation for R users with
great flexibility and utility for both data analysis and research [Winham and Motsinger-Reif
2010]. We conclude this work with Chapter 6, which summarizes the major findings and
REFERENCES CITED
Moore JH. 2003. The ubiquitous nature of epistasis in determining susceptibility to common human diseases. Hum Hered 56(1-3):73-82.
Ritchie MD, Hahn LW, Roodi N, Bailey LR, Dupont WD, Parl FF, Moore JH. 2001.
Multifactor-dimensionality reduction reveals high-order interactions among estrogen-metabolism genes in sporadic breast cancer. Am J Hum Genet 69(1):138-47.
Motsinger-Reif AA, Wood SJ, Oberoi S, Reif DM. 2008b. Epistasis List: A Curated Database of Gene-Gene and Gene-Environment Interactions in Human Genetics. ASHG. Philadelphia, PA.
Park MY and Hastie T 2007. L-1-regularization path algorithm for generalized linear models. Journal of the Royal Statistical Society Series B-Statistical Methodology 69:659-677.
Meier L et al 2008. The group lasso for logistic regression. Journal of the Royal Statistical Society Series B-Statistical Methodology 70:53-71.
Winham SJ, Wang C, Motsinger-Reif AA. 2011. A comparison of multifactor dimensionality reduction and L1-penalized regression to identify gene-gene interactions in genetic association studies. Stat Appl Genet Mol Biol 10(1):4.
Winham SJ, Slater AJ, Motsinger-Reif AA. 2010. A comparison of internal validation techniques for multifactor dimensionality reduction. BMC Bioinformatics 11:394.
Haas DW, Geraghty DE, Andersen J, Mar J, Motsinger AA, D'Aquila RT, Unutmaz D, Benson CA, Ritchie MD, Landay A. 2006. Immunogenetics of CD4 lymphocyte count recovery during antiretroviral therapy: An AIDS Clinical Trials Group study. J Infect Dis 194(8):1098-107.
Winham SJ, Motsinger-Reif AA. 2011. The effect of retrospective sampling on estimates of prediction error for multifactor dimensionality reduction. Ann Hum Genet 75(1):46-61.
CHAPTER 1
INVESTIGATING EPISTASIS: A LITERATURE REVIEW
11.1
INTRODUCTION
Epistasis, loosely defined as gene-gene and gene-environment interaction, is gaining
increased recognition in the area of human genetics, particularly in the study of common,
complex diseases. Unlike rare disorders attributed to simple Mendelian inheritance patterns,
common complex diseases are thought to comprise much more intricate architectures and
will likely involve epistasis. Embracing this challenging phenomenon is a necessary
component in investigating the genetic basis of disease susceptibility, demonstrated by a
number of well-documented examples of epistasis in both model organisms and human
genetics. The concept of biological epistasis is validated in model systems where the level of
genetic complexity is more easily tested and understood than in the human system. In the
study of human disease, even traits that were originally thought to be simply Mendelian in
nature are now known to involve more complex interactive pathways.
Additionally, many studies citing independent main effects do not tend to replicate in
follow-up studies, including many genome-wide association studies, and the presence of
strong interactive components may explain this lack of replication. With the advent of
1 Excerpts based on Wood, S.J. and Motsinger-Reif AA. 2008. Epistasis: Understanding and Evaluating the Phenomenon in Human Disease Mapping. In Columbus, F. (ed.),
systems approaches to biological sciences, epistasis is thought to be a common phenomenon,
and investigation of these types of models is moving to the forefront. A central assumption
of systems biology is that complicated biological systems work together in a unified manner
and the full complexity cannot be understood by looking at individual components in
isolation. A more holistic approach is necessary because the properties of complex
biological processes cannot be predicted from individual elements, but these properties are
critical to understanding the function of the system as a whole [Phillips 2008].
Biological systems are collections of complex networks and pathways that interact in
complicated ways, and epistasis will be an important component of understanding these
interactions [Moore 2005; Moore and Williams 2005]. In fact it has been hypothesized that
epistasis may be a frequent phenomenon for a number of common disorders [Moore 2003],
and may be an evolutionary result due to canalization as a selective response to stabilize the
phenotype in the presence of mutations [Gibson 1996; Gibson and Wagner 2000]. As
evidence for the plausibility of this hypothesis, a systems-level approach has already proven
successful in discovering interactions in yeast [Segre, et al. 2005]. The success in model
organisms has also begun to expand to humans; for instance, a gene network and pathway
analysis in schizophrenia has identified a series of protein interactions [Sun, et al. 2010]. In
addition, through the rapid improvement of technology, enough genetic data is now available
to make searching for epistasis feasible.
In this new era, in order to appropriately pursue epidemiological studies to identify
susceptibility genes, it is crucial that the concept and consequences of epistasis be
outline the issues involved in finding it. We discuss current definitions of epistasis, as well
as early examples in both model organisms and humans to illustrate these definitions. We
then outline the statistical tools traditionally available to human geneticists to begin to detect
epistasis in epidemiological studies, and more novel data-mining strategies that have been
developed to address some of the problems with these traditional statistical approaches. We
will focus on Multifactor Dimensionality Reduction, highlighting the development and
extension of the method.
The following will assume a working knowledge of basic genetics, and for a more
detailed discussion of these concepts and terminology see Campbell and Reece [2001];
Pierce [2005]. The phenotype refers to the observable characteristic or trait of interest, which
may have an underlying genetic cause. This can be determined by estimating the heritability
of the trait, or the proportion of phenotypic variation that is explained by genetic variation.
An allele is a genetic variant present at a particular location on a single chromosome, called a
locus, whereas a genotype refers to the pair of alleles present at a particular locus on both
chromosomes. The concept of genetic dominance is when one allele (‘A’) masks the effect
of another allele (‘a’); that is, allele ‘A’ is said to be dominant to allele ‘a’ if individuals with
one copy of each allele (genotype ‘Aa’) display the phenotype associated with genotype
‘AA’.
The type of data discussed here will consist of a single response, a disease phenotype,
which will typically be binary. Genetic factors used to predict this response will be
nucleotide polymorphisms (SNP) that may interact. For a biallelic locus, three genotype
categories are possible and can be encoded {0, 1, 2}.
1.2 BIOLOGICAL EPISTASIS
The first use of the word ‘epistatic’ is credited to Bateson [1909]. He coined the term
to describe an effect where a variant at one locus alters the manifestation of the effect of
another variant. This was originally viewed as an extension of the concept of genetic
dominance for variants/alleles at a single locus. Generally, this definition implies the
biological interaction between the protein products of genetic loci, where the qualitative
nature of the mechanism of action of a factor is affected by the presence or absence of the
other [Siemiatycki and Thomas 1981].
This concept is best illustrated by a commonly used example [Strachen and Read
2003]. Two loci, B and G, influence the hair color trait in mice [Strachen and Read 2003].
Both loci are biallelic, such that locus B has two possible alleles, B or b, and locus G has two
possible alleles, G or g. The possible phenotypic outcomes (white, black or gray hair) are
listed in Table 1.1 below according to the genotype combinations that produce them.
Regardless of genotype at locus B, individuals with any copies of the G allele have gray hair;
therefore at locus G, allele G is dominant to allele g, effectively masking any ‘effect’ of allele
g. We also see that if the genotype at locus G is g/g then an individual with any copies of the
B allele has black hair, so that at locus B, allele B is dominant to b. If the genotype at locus G
Table 1.1 Epistatic Interaction in Mouse Hair Color. Table entries are the phenotype
associated with a particular genotype combination.
Genotype at Locus G
Genotype at Locus B GG Gg gg
BB Gray Gray Black
Bb Gray Gray Black
bb Gray Gray White
copies of the G allele have gray hair regardless of genotype at locus B. Locus G is said to be
epistatic to locus B, since the effect of locus B is masked by that of locus G.
This example provides a simple demonstration of the phenomenon of epistasis, but is
often overly simplistic when applied to the study of human genetics [Templeton 2000]. In
this field, the phenotype of interest is often qualitative and usually binary, for example the
presence or absence of disease. Models for the joint action of two or more loci often focus on
the penetrance—the probability of developing disease given a particular genotype [Cordell
2002]. This framework allows flexibility to describe various epistatic disease models, and
many penetrance functions have previously been enumerated and characterized for two-locus
interactions [Li and Reich 2000; Neuman and Rice 1992].
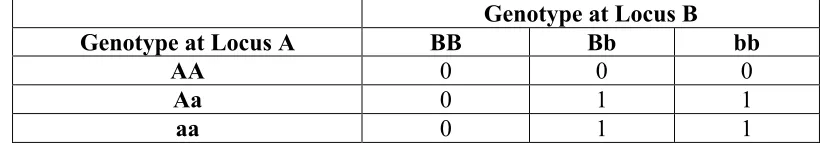
Suppose two biallelic loci, A and B, influence a binary trait. In this example, a
disease-risk allele is required at both loci in order to exhibit the trait (one or more copies of
both allele A and allele B are required). The effect of allele A can only be observed when
Table 1.2 Penetrance function of a general two-locus interaction model. Table entries are
the penetrance, or the probability of disease given the multilocus genotype.
Genotype at Locus B
Genotype at Locus A BB Bb bb
AA 0 0 0
Aa 0 1 1
aa 0 1 1
The effect of locus A is “masked” by the effect of locus B and vice versa. This type
of epistatic model is commonly described in the literature [Cordell 2002] and represents a
more general form of epistasis than Bateson originally described. In the first example, factor
B is epistatic to factor A, but factor A is not expected to also be epistatic to factor B. The
example seen in Table 1.2 demonstrates a situation where both loci are epistatic to each
other.
Additionally, the model demonstrated in Table 1.2 demonstrates epistasis through a
biological definition as well as a statistical definition (discussed below); however, it is
important to keep in mind that this is not always the case. A biologically epistatic interaction
is not always mathematically defined, and a statistical interaction does not always lend itself
to a biologically meaningful interaction [Templeton 2000]. An example of that exact
situation is discussed in [Cordell 2002] and is summarized below.
According to biological definitions of epistasis, a heterogeneity model can also
display biological epistasis, without demonstrating statistical epistasis. Generally, genetic
heterogeneity describes a situation where the production of identical or similar phenotypes
Table 1.3. A heterogeneity model with two loci acting together. Table entries are the
penetrance of each multilocus genotype.
Genotype at Locus B
Genotype at Locus A b/b b/B B/B
a/a 0 0 1
a/A 0 0 1
A/A 1 1 1
which an individual becomes affected through possessing a disease-risk genotype at either
locus A or locus B. This penetrance function corresponds to a mathematical function with
two main effects (of both A and B), but no interactive effect (details discussed in the next
section). However, from a biologist’s perspective, if the ‘effect’ of locus B is defined as a
recessive disease model (so that two copies of allele B are required to cause disease) then
having two copies of allele A at locus A is sufficient to mask this effect, i.e., given genotype
A/A at locus A, the effect at locus B is not observable. Locus B acts differently when the
genotype at locus A is A/A compared with when the genotype at locus A is not A/A.
Therefore a biological definition of epistasis can define an interaction that a mathematical
definition would ignore [Cordell 2002].
This example demonstrates the confusion that can be caused by different definitions
of epistasis. Statistical and biological interpretations of the “effects” and “independence” of
loci can be very different, and can confound the understanding and interpretation of epistatic
1.3 STATISTICAL EPISTASIS
Bateson is credited with pioneering the term “epistasis”, but Fisher [1918] is credited
in defining a separate sense of the term. Fisher defines a mathematical definition of epistasis
as a deviation from additivity in the effect of alleles at different loci with respect to their
contribution to a quantitative phenotype. Epistasis in this sense is closer to the usual concept
of statistical interaction [Norton and Pearson 1976]. Statistical interaction is generally
defined as a departure from an additive model describing the relationship between predictive
factors. This describes a situation where the effect of one variable depends on the values of
one or more other variables.
Generally, for a quantitative phenotype yij, the trait value can be decomposed as
yij = E(yij) + eij, where E(yij) and eij represent the genotypic and environmental components,
respectively. We can then define the following linear model equation
E(yij) = αi + βj (1.1).
Equation 1.1 represents an additive model for the genotypic value, where αi and βj are
parameters that represent the effects of the genotype i at locus 1 and genotype j at locus 2
(where i and j take three possible genotype values for a biallelic locus, encoded {0, 1, 2}).
This simple statistical representation is not only mathematically additive, but it also
assumes an additive genetic model (where risk is dose-dependent on the number of disease
risk alleles carried). This genetic assumption is not always desirable if the mode of
inheritance (dominant, recessive, etc.) is not additive or is unknown. This same model can
be reparameterized to assume alternative genetic models, for instance
Equation 1.2 is equivalent to Equation 1.1, but using dummy variable encoding for the
two loci in order to avoid making an assumption about the genetic model. A dummy variable
takes on the values 1 or 0 in order to indicate the presence or absence of a categorical factor
(such as genotype); dummy encoding is used in Equation 1.2 to construct variables for each
of the distinct genotypes directly, rather than assuming how alleles may work together to
confer genotype effects. Again y represents a quantitative phenotype, and xi and zi are
dummy variables related to the genotype at locus i. The coefficients u, a1, d1, a2 and d2
represent genetic parameters that may be estimated corresponding to the mean effect and
additive and dominance effects at the two loci [Falconer and Mackay 1996].
In contrast, we can extend the model to include epistatic interaction effects (i1-i4),
originally defined by Cockerham [1954]:
E(y) = u + a1x1 + d1z1 + a2x2 + d2z2 + i1x1x2 + i2x1z2 + i3z1x2 + i4z1z2 (1.3).
Equation 1.3 is equivalent to Equation 1.2 if there is no interaction, such that terms i1-i4 are
equal to zero.
These examples are shown for quantitative traits, but as mentioned earlier, in the
study of human disease, the outcome of interest is often binary. In this case, similar models
are applied, with the outcome variable usually defined as probability pij, the penetrance for
genotype i at locus 1 and j at locus 2. Three commonly considered models are as follows.
First, there is an additive model, analogous to Equation 1.1, where pij is defined as
(1.4).
The extension shown in Equations 1.2 and 1.3 to incorporate modeling of epistasis can be
applied to Equation 1.4 as well. For instance, the model described in Table 1.2 can be
described as p = u + a1x1 + d1z1 + a2x2 + d2z2 + i1x1x2 + i2x1z2 + i3z1x2 + i4z1z2, where
{x1,z1,x2,z2} represent genotypes {Aa, aa, Bb, bb} respectively and u=a1=d1=a2=d2=0 and i1=
i2= i3= i4=1. Similarly, we define a multiplicative model such that
(1.5).
The multiplicative model in Equation 1.5 could be extended for a quantitative phenotype as
well. Finally, there is also a heterogeneity model in which pij may be written as
(1.6).
The heterogeneity model in Table 1.3 can be expressed using Equation 1.6 such that
α1=α2=β1=β2=0 and α0=β0=1, where {α0,α1, α2, β0, β1, β2} correspond to genotypes {AA,
Aa, aa, BB, Bb, bb}, respectively.
Mathematically, the multiplicative model in Equation 1.5 is usually considered to be
an epistatic model in which the loci involved in disease are not independent. The additive and
heterogeneity models in Equations 1.4 and 1.6 are usually considered to represent
non-epistatic models [Cordell 2002]. However, mathematical definitions of epistasis are not
always straightforward, and there is disagreement over how to define it mathematically.
It is these interpretations of mathematical models of epistasis that lead to
discrepancies between the biological and statistical terminology. As mentioned earlier, the
heterogeneity model shown in Table 1.3, which by biological definitions could be considered
epistatic, would not be considered epistatic under statistical terminology. !
pij ="i*#j
!
Just as interpretation of biological interactions is difficult, the interpretation of
statistical interactions is also not easy. In fact, additive and heterogeneity models for
penetrance functions are often used interchangeably because it can be shown that these
models give very similar results when used to model familial relative risks of disease
[Cordell, et al. 1995]. However, this is not always the case. (Again, Table 1.3 serves as a
good example – the penetrance function cannot be modeled with an additive function). Also,
heterogeneity and multiplicative models can also both be expressed as additive models when
transformed to different scales, for instance the logarithmic scale for the multiplicative model
[Frankel and Schork 1996; Greenland and Rothman 1998]. In a mathematical sense, all three
types of models can be considered to represent independent additive effects, when
constructed on the proper scale. Although these models can be considered additive (and
therefore expressible without interaction effects on their appropriate scales), they still
correspond to models with interaction effects when transformed to a penetrance scale [Fisher
1930; Pearson 1900; Wright 1934a; Wright 1934b]. This phenomenon illustrates some of the
difficulty in interpreting statistical models of epistasis.
1.4 INTERPRETATION
With such conflicting definitions of epistasis, it is not surprising that interpretation is
a challenge. Epistasis has been interpreted in the literature as both a departure from
additivity on the penetrance scale [Risch 1990; Risch, et al. 1993; Tiwari and Elston 1998]
and as a departure from multiplicativity on the penetrance scale [Dizier and Clerget-Darpoux
discussed only in the context of significance of interactive effects, with no model
assumptions of the main effects of individual loci [Cheverud and Routman 1995], however
this model of epistasis is controversial [Zeng, et al. 2005].
As confusing as the terminology can be, this is not the largest difficulty in the
interpretation of epistasis [Culverhouse, et al. 2002]. Arguably, the biggest challenge is the
potentially faulty assumption that if statistical interactions are detected, a biologically
interesting phenomenon is the cause. In the study of human genetics, the goal of localizing
disease-causing variants is to understand the molecular mechanisms of susceptibility in order
to hopefully better treat and prevent disease. With this intent in mind, the goal is that an
epistatic model may tells us something of interest about the mechanisms and pathways
involved in disease [Witte 1998], and varying definitions of epistasis are now being
incorporated into genetic pathway analysis in model organisms [Aylor and Zeng 2008].
Unfortunately, there is no direct correspondence in human genetics between
biological notions of epistasis and statistically derived models. A biological interpretation of
a statistical test is not always possible in humans. Statistical interaction does not necessarily
imply interaction on a mechanistic level. Any given pattern of data and corresponding
mathematical model could often be generated from a number of completely different
underlying molecular mechanisms [Rothman, et al. 1980; Thompson 1991].
The separate concepts of biological and statistical epistasis must be considered in
tandem when investigating the mechanisms of disease. Biological interactive models usually
give rise to statistical epistasis when properly investigated, but the reverse is not always true
1.5 EPISTASIS IN MODEL ORGANISMS
Model organisms have provided important insights into the study of genetics from the
beginning of the discipline, with Mendel’s studies of pea plants [Bateson 1902]. Studies of
model organisms have also provided crucial evidence for the existence and importance of
epistasis, and have demonstrated the varied types of possible interactions. In the current
section, we discuss classical examples of epistasis in model organisms that demonstrate
different types of interactions.
One of the classical experiments demonstrating the phenomenon of genetic
interaction was a study of comb type in chickens performed by Bateson, et al. [1905]. Table
1.4 lists the breeds of chickens known at the time from regular farmer stocks, and the comb
types that characterized them.
Table 1.4: Chicken Varieties and Comb Type.
Chicken Varieties Comb Phenotype
Wyandotte Rose Comb
Brahma Pea Comb
Leghorn Single Comb
When two parental chickens are crossed, the offspring are referred to as the F1
generation. Crossing a Wyandotte (Rose comb) and a Brahma (Pea comb) chicken resulted
in walnut combs in all progeny of the F1 generation, a new phenotype that was not
previously observed. The offspring of chickens crossed from the F1 generation, the F2
ratio of these phenotypes was the expected Mendelian ratio (9:3:3:1) from a dihybrid cross.
This observation suggested that two genes control the comb phenotype. Bateson and Punnett
determined the gene interactions and genotypes involved in this epistatic interaction with
appropriate test crosses [Bateson, et al. 1905]. Their crosses of both rose and pea to single
chickens demonstrated that both the rose and pea phenotype are dominant to single. Next,
they crossed true-breeding rose and pea strains. This produced exclusively walnut offspring.
When the F1 walnut strain was crossed with itself, the result was a 9:3:3:1 ratio.
Their series of test crosses determined that the genotypes controlling the comb
phenotype are as listed in Table 1.5. Through backcrossing they showed that the genotypes of
the initial parents were Rose = RRpp and Pea = rrPP [Bateson, et al. 1905].
Table 1.5. Genotype Distribution. Frequency of genotypes from an F2 cross.
Phenotypes Genotypes Frequency in F2
Walnut R_P_ 9/16
Rose R_pp 3/16
Pea rrP_ 3/16
Single rrpp 1/16
The results of this study clearly demonstrate biological epistasis in the absence of
statistical epistasis—referred to as dominant epistasis. The phenotype ratios do not vary
from expected Mendelian ratios, but the phenotype is clearly dependent on the genotypes of
two independent loci.
An example of another type of epistasis is demonstrated by Punnett’s classic
experiments to dissect the determination of flower color in sweat peas [Punnet 1920]. In the
breeding white flower line produced all purple offspring. The next cross with those hybrids
produced both purple and white flowering plants. Inspired by these experiments, Punnett
acquired two different pure breeding lines of white flowers [Punnet 1920]. When these lines
were crossed, the F1 generation consisted of entirely purple flowers. When the F1 generation
was crossed, both white and purple flowers resulted, in the proportions listed in Table 1.6.
Appropriate backcrosses of the original parental generation revealed the genotypes of the
parental, F1, and F2 generations as indicated below in Table 1.6.
The results of Punnet’s crosses revealed that two genes are involved in the specific
pathway that determines flower color, and functional products from both are required for
expression. One recessive allelic pair at either locus results in the mutant phenotype [Punnet
1920]. If a pure line pea plant with colored flowers (genotype = CCPP) is crossed to a pure
line, homozygous recessive plant with white flowers, the F1 plant will have colored flowers
and a CcPp genotype. The normal ratio from a selfing dihybrid is 9:3:3:1, but epistatic
interactions of the C and P genes will give a modified 9:7 ratio. Table 1.6 describes the
Table 1.6. Flower Color and Genotype Distribution
Genotype Flower Color Enzymatic Activities
9 C_P_ Flowers colored; anthocyanin produced
Functional enzymes from both genes
3 C_pp Flowers white;
no anthocyanin produced
p enzyme non-functional
3 ccP_ Flowers white;
no anthocyanin produced c enzyme non-functional 1 ccpp Flowers white;
no anthocyanin produced
interactions for each genotype and how the ratio occurs. Again, this is an example of both
statistical and biological epistasis. Because both genes are required for the correct
phenotype, this epistatic interaction is an example of complementary gene action [Punnet
1920].
These classic examples of epistasis demonstrate some the simplest and oldest studies
of the phenomenon. Epistasis is a phenomenon that has already been well documented in a
broad range of model organisms, and its application to the human genome is a natural
extension. Because controlled crosses, knock-out experiments, etc. are possible in model
organisms, epistasis can be much more easily dissected than in human genetics. As the goal
of experimentation in model organisms is to discover aspects of biology that extend to the
human system, examples of epistasis in model organisms have been found to be applicable to
human phenotypes. For instance, the RAD52 epistasis group in Saccharomyces cerevisiae
yeast has been discovered to play an important role in homologous recombination and repair
of DNA double-strand breaks [Game 1993]. Recent studies have suggested that an
analogous group may be associated with cancer in humans [Symington 2002]. Additionally,
in backcross experiments of non-obese and diabetic mice, at least nine loci have been found
to interact to determine susceptibility, which may extend to insulin-dependent diabetes in
humans [Risch, et al. 1993].
1.6 EPISTASIS IN HUMANS
One of the earliest examples of epistasis discovered in humans explains the
The ABO blood type is largely controlled by a single gene with three alleles: i, IA, and IB. The
gene encodes a glycosyltransferase that modifies the carbohydrate content of the red blood
cell antigens. The IA allele gives type A, IB gives type B, and i gives type O. IA and IB are
dominant over i, so ii people have blood type O, IAIA or IAi have blood type A, and IBIB or IBi
have blood type B. Individuals with the genotype IAIB express both A and B antigens
because of the codominance of the A and B alleles. [Bhende, et al. 1952] first demonstrated
that lack of the H antigen, an intermediary point in the production of the corresponding A
and B antigens at the ABO locus, results in the apparent masking of the A and B alleles, due
to epistatic interactions with at least two other genes. Mutations in the H-gene (FUT1) lead
to lack of ABH antigen on red blood cells, whereas mutations in secretor gene (FUT2)
suppress the formation of ABH antigen in saliva and other body fluids. Additional molecular
variants of the classic Bombay phenotype that involve only FUT1 or FUT2 have been
described [Kelly, et al. 1994]. In this example of recessive epistasis, alleles at the ABO locus
are hypostatic to alleles at FUT1 and FUT2, whereas the latter are epistatic to those at the
ABO locus. In this example, the homozygous recessive condition at one locus (the H-gene)
masks the expression of a second (the ABO locus). The hh individual is phenotypically type
O regardless of their genotype at the ABO locus.
This classic example demonstrates that even traits once thought to be simply
Mendelian in etiology are being shown to be much more complex than previously assumed.
This has been seen in humans as well as model organisms. Sickle cell anemia and cystic
fibrosis are classic examples of diseases with a simple, single-gene inheritance pattern. Both
modifier genes have been shown to greatly alter the clinical manifestations of these disorders.
Excellent reviews of modifier genes impacting the clinical manifestation of these disorders
can be found in Steinberg and Adewoye [2006] and Knowles [2006], respectively. The
dissection of the epistatic nature of Hirschsprung’s disease on both a statistical and functional
level [Carrasquillo, et al. 2002] also demonstrates this shift.
1.7 STUDY DESIGNS IN HUMAN GENETICS
The examples of epistasis in model organisms discussed above were discovered using
controlled crosses, where parents of known genotypes can produce multiple offspring so that
phenotypic ratios of subsequent offspring can be empirically evaluated. Of course, such
controlled experiments are not possible with human subjects and observational studies must
be used to dissect the genetic etiology of human phenotypes.
Generally, the first step of any disease mapping study is to establish the heritability of
a given phenotype or disease, where heritability is the proportion of phenotypic variation in a
population that is attributable to the genetic variation among individuals. Details of how to
statistically estimate heritability can be found in [Falconer and Mackay 1996]. After a
disease has been established as heritable, genomic mapping begins to narrow in on the
causative genetic regions/variants by statistically relating genetic variants to the disease
under study.
There are two broad types of study designs used in disease mapping: linkage analysis
from multiple biologically-related family members to determine whether a chromosomal
region is preferentially inherited by affected offspring. Linkage analysis relies on the fact
that genes nearby on the same chromosome are inherited together due to the lack of
recombination in that region, and identifies marker genes in linkage with the causative
gene(s). Alternatively, association analysis uses case-control, cohort, or even family data to
statistically relate genetic variations to a disease phenotype more directly. Because
association analysis examines the effect of a candidate locus using linkage disequilibrium
that degrades over time with recombination, rather than an effect that is diffused across large
regions of chromosomes, its greatest applicability is in fine localization and identification of
causative loci [Daly and Day 2001].
Either analysis strategy can be used to assess interactive effects, and both association
and linkage analyses have been used to investigate complex genetic and environmental
disease etiologies [Andrieu and Goldstein 1998; Goldstein and Andrieu 1999]. Association
analysis is by far the most commonly used approach, because of advantages in statistical
power and ease of sample collection when the phenotype is well-defined [Risch 2000], and
most computational methods have been designed for such studies. Therefore we focus on
statistical methodologies to detect epistasis in association studies, but it is important to
remember that linkage approaches can also be used.
In association analysis, case-control, case-only, prospective cohort, and family-based
studies have all been applied to identify gene-gene interactions. Case-control studies are the
most commonly used, and hence most novel methods development has focused on such a
interactions [Andrieu and Goldstein 1998; Goldstein and Andrieu 1999], but their utility for
gene-gene interactions has been debated in the literature [Vieland and Huang 2003; Cordell
2003]. One commonly accepted approach in a case-only design is to generate
‘pseudo-controls’ from the alleles not present in a case subject at each genetic marker prior to analysis
so that case-control analytical methods can then be applied [Cordell, et al. 2004; Cordell
2004]. Family-based study designs, involving sibling pairs, affected sibling pairs, trios
(parents and affected offspring), or extended family designs, are also very powerful for the
detection of epistasis [Goldstein and Andieu 1999].
Because most studies in human disease focus on a binary outcome variable, we will
focus on methods to analyze “case-control” data. Specifically, the data we will consider
consists of a single binary outcome variable to measure the phenotype (disease response) and
a large number of categorical predictor variables consisting of genotypes (typically SNPs)
and is collected retrospectively. The remainder of this chapter will focus on the statistical
analysis of this type of data.
These types of observational studies are designed with a goal to link genotype to
disease phenotype by identifying genetic factors such as gene-gene interactions that may be
associated with the phenotype. Because phenotypes are generally binary, disease mapping in
human genetics is a classification problem. A primary objective is to construct a statistical
model using genetic information in order to accurately predict or ‘classify’ the disease status
of a particular individual. Additionally, as technology advances, research scientists continue
to collect a larger number of genetic variables because of the vast number of genotypes to
entire genome are expected to be causative, and therefore identifying these factors is
statistically considered a variable selection problem.
Below we outline both traditional and novel methods to identify epistatic interactions
in case-control association studies. As mentioned above in the discussion of biological and
statistical definitions of epistasis, it is important to remember that the methods outlined
below are tools to detect statistical epistasis in observational studies. Evaluation of potential
biological epistasis requires further investigation with mechanistic studies.
1.8 TRADITIONAL STATISTICAL METHODS
A number of single-SNP associations have successfully been identified using
traditional statistical approaches, and these methods have also proven fruitful in detecting
interactions if applied properly. In any genetic analysis plan, both single-SNP and epistatic
models should be considered. Below, we discuss the traditional methods most commonly
used in genetic epidemiology to search for epistatic interactions, as well as some general
concerns with these methods. A more detailed discussion of these methods and their
application to finding epistasis can be found in [Motsinger-Reif and Reif 2008; Cordell
2009].
Contingency tables are a simple, yet effective method to determine interactions.
These methods compare the observed data to what would be expected under various genetic
models. For case-control studies, Pearson’s chi-square and Fisher’s exact test can be used.
observed to expected transmitted alleles [Spielman, et al. 1993; Terwilliger, et al. 1992;
Terwilliger and Ott 1992].
Generalized linear models, an extension of ordinary least squares regression,
encompasses a flexible class of regression methods that describe the relationship between
response (dependent) and predictor (independent) variables. Multiple regression seeks to
quantify the relationship between several independent variables (multiple genotypes) and a
single dependent variable (phenotype), whereas multivariate regression extends to multiple
dependent variables (multiple phenotypes). For continuous or quantitative phenotypes, such
as in population-based studies, linear regression is used. When phenotypes are binary, such
as in case-control studies, logistic regression is often used. Other types of regression are
available depending on particular model assumptions [Fox 1997].
Analysis of variance (ANOVA) is another popular class of methods for association
studies, and is a special case of the general linear model. The purpose of ANOVA is to test
for significant differences between group means, but more complex study designs involving
repeated measures and nesting can be accommodated under the ANOVA framework.
Multivariate ANOVA (MANOVA) extends to the analysis of more than one dependent
variable and known covariates can also be included using analysis of covariance (ANCOVA)
and multivariate analysis of covariance (MANCOVA) [Cobb 1998].
Many of these traditional statistical methods have both parametric and nonparametric
versions. In parametric methods, both genetic and statistical model assumptions are made
and parameters are estimated. Nonparametric methods are free of distributional assumptions,
are not met, both the Kolmogorov-Smirnov two-sample test and the Kruskal-Wallis analysis
of ranks are available.
There are many advantages to these traditional statistical approaches. They can be
computed easily, and they are widely available in a number of common statistical software
packages. They also provide easily interpretable results and are widely accepted by
biologists and statisticians alike. However, the advantages in simplicity and interpretability
are met with a number of stark disadvantages. One of the most notable disadvantages is the
curse of dimensionality, where as the number of genetic and environmental factors increase,
the number of possible interactions increase exponentially, leaving many contingency table
cells with very few, if any, data points [Bellman 1961]. This curse of dimensionality is
associated with low statistical power and requires incredibly large sample sizes.
This concern is exacerbated by the large increase in the amount of available data with
recent advances in genotyping technology. For instance, the Affymetrix Genome-Wide
Human SNP Array 6.0 “features more than 1.8 million markers for genetic variation”
[Affymetrix 2009].While this new, expansive technology may sound exciting, it also poses
many challenges. As the number of genotyped loci increases, the number of possible
interactions grows exponentially to unmanageable amounts and for many studies there are
often more independent variables than observations. In these situations, traditional methods
cannot accommodate all of the genetic variables simultaneously, and require the use of
variable selection techniques or genome scans. With such a large number of loci considered,
variable selection becomes an almost insurmountable problem and power to detect true
best-subset selection rely on hierarchical designs, and may not be suitable for diseases that do
not exhibit marginal main effects [Mantel 1970]. Most methods were designed under a
hypothesis-testing framework, and may not be suitable for identifying the most important
genes for predicting a phenotype, which may be more appropriate for a data-mining context.
As an alternative to variable selection, many traditional approaches are applied using
genome scans, where only a single locus or a small subset of loci will be considered at once.
But as the dimensionality of our studies increase, so does the risk of false positives due to
multiple testing with this type of approach, and statistically significant results are very likely
to be found due to chance alone. There are methods available to correct for multiple testing,
including Bonferroni corrections [Simes 1986] and false discovery rate control [Benjamini
and Hochberg 1995]. This issue can also often be alleviated using permutation testing,
however, it is computationally expensive [Good 2000]. Moreover, many traditional methods
make a number of statistical and genetic assumptions that may be violated. For example,
some methods assume statistical independence of predictor variables, but the genes we are
considering may be in linkage disequilibrium. Additionally, recessive or additive modes of
inheritance may be erroneously assumed.
1.9 NOVEL COMPUTATIONAL METHODS
In order to overcome the limitations of traditional methods, a number of novel
approaches have been developed and reviewed in Cordell [2009]. These methods are often
described as data-mining or machine-learning methods, with a main goal of prediction. The
on their genetic information. Data-mining methods accomplish this by searching through
large amounts of data (such as in large-scale genetic studies) to uncover consistent patterns
between variables, and these patterns are validated in new subsets of data. In contrast to the
traditional statistical approaches designed to test specific a priori hypotheses, data-mining
approaches are exploratory rather than inferential in nature and generate potential patterns
that can be translated into hypotheses to investigate in follow-up studies. In this way we can
“learn” from the data about how to best predict an outcome measure from a set of features.
The learning process can be either supervised or unsupervised, depending on the presence of
the outcome variable. Supervised learning utilizes phenotype information to help
characterize the relationship among the genotypes, where unsupervised learning investigates
the relationship among the genotype variables only.
Because data-mining approaches look for general patterns rather than examine
predefined hypotheses, there are concerns with the potential for model over-fitting and a high
potential for false positive findings [Hastie, et al. 2001]. Specifically, the identified model
may be constructed from a limited amount of available data, and is therefore fitting the data
itself rather than representing an underlying structure. These types of models will not
generalize well to new unseen data, and ultimately won’t provide adequate predictions in the
population. To address this concern, machine-learning techniques use some measure of
internal validation. A common theme of many data-mining procedures is to train or build a
model on a subset of data and then to validate that model on an independent test set using a
order to assess the predictive capacity of the model [Hastie, et al. 2001]; if the model predicts
well on the new, unseen data, then it is likely to reflect a true underlying pattern.
As with many traditional analytical techniques, novel methods have been developed
for both linkage and association studies, but are more commonly designed for association
studies. In the current section, we briefly discuss some data-mining strategies currently
utilized to detect and characterize epistasis in association studies. The most commonly used
methods are covered here, but do not represent a comprehensive list. A more extensive
discussion of these methods can be found in Motsinger-Reif and Reif [2008]; Cordell [2009].
There are many machine learning and data-mining approaches for association studies
that can be separated into two broad categories: pattern recognition [Theodoridis and
Koutroumbas 2006] and data reduction [Bevington and Robinson 1991]. Pattern recognition
methods aim to classify information from patterns extracted from the full data. These
include neural network approaches, clustering algorithms, and tree-based methods.
Clustering algorithms are usually unsupervised and sort objects into groups by maximizing
the degree of association of objects in the same group and minimizing the degree of
association of objects in different groups [Hartington 1975]. The degree of association is
defined by different measures depending on the particular clustering method, but is often
determined through some measure of distance. When applied to genetic data, clusters of
individuals can be constructed using genetic variables.
Tree-based approaches construct easily interpretable tree-like models that represent a
set of decisions, or a set of if-then logical conditions that accurately predict or classify cases
Trees (CART) and Random Forests (RF) are two popular variations, and are both easy to
interpret and implement using available software [Brieman, et al. 1984; Brieman 2001].
CART constructs a regression tree if the response is continuous or a classification tree if the
response is categorical by maximizing purity in the terminal node, which for classification
trees is the number of observations in each terminal node belonging to the same class. RF
builds a series or forest of classification trees that are each constructed from a bootstrap
sample of the data, where each root node is randomly selected from the set of genetic
variables. Classification is achieved by averaging over all the trees in the forest.
Neural Networks (NN) are machine-learning techniques based on the cognitive
system and neurological processing of the brain. The network learns from the existing data
and seeks to generate an output pattern (phenotype) that is used to classify the input pattern
(genotype) [Skapura 1995]. Two types of neural networks, Genetic Programming NN
(GPNN) [Ritchie, et al. 2003] and Grammatical Evolution NN (GENN) [Motsinger-Reif, et
al. 2008a], imitate the genetic processes of natural selection in order to construct the network
model [Koza and Rice 1991; O’Neill and Ryan 2001]. Using these ideas, the network with
the best predictive capability (i.e. highest fitness) will be selected.
Regularization techniques and penalized regression approaches are also becoming
increasingly common data-mining tools for variable selection in genetic association studies.
These approaches are regression based, but incorporate the use of a penalty term in the
objective function to be minimized to attain smooth estimates [Hastie, et al. 2001].
Shrinkage methods comprise of particular types of penalties that allow for sparsity and