DOI: 10.1534/genetics.109.108431
A Hidden Markov Model Combining Linkage and Linkage
Disequilibrium Information for Haplotype Reconstruction
and Quantitative Trait Locus Fine Mapping
Tom Druet
1and Michel Georges
Unit of Animal Genomics, GIGA-Research and Department of Animal Production, Faculty of Veterinary Medicine, University of Lie`ge, B-4000 Lie`ge, Belgium
Manuscript received August 11, 2009 Accepted for publication December 5, 2009
ABSTRACT
Faithful reconstruction of haplotypes from diploid marker data (phasing) is important for many kinds of genetic analyses, including mapping of trait loci, prediction of genomic breeding values, and identification of signatures of selection. In human genetics, phasing most often exploits population information (linkage disequilibrium), while in animal genetics the primary source of information is familial (Mendelian segregation and linkage). We herein develop and evaluate a method that simultaneously exploits both sources of information. It builds on hidden Markov models that were initially developed to exploit population information only. We demonstrate that the approach improves the accuracy of allele phasing as well as imputation of missing genotypes. Reconstructed haplotypes are assigned to hidden states that are shown to correspond to clusters of genealogically related chromosomes. We show that these cluster states can directly be used to fine map QTL. The method is computationally effective at handling large data sets based on high-density SNP panels.
A
RRAY technology now allows genotyping of large cohorts for thousands to millions of single nu-cleotide polymorphisms (SNPs), which are becoming available for a growing list of organisms including human and domestic animals. Among other applications, these advances permit systematic scanning of the genome to map trait loci by association (e.g., WellcomeTrustCaseControlConsortium2007; Charlieret al.2008), to
predict genomic breeding values for complex traits (Meuwissenet al.2001; Goddardand Hayes2009), or
to identify signatures of selection (e.g., Voight et al.
2006).
Present-day genotyping platforms do not directly pro-vide information about linkage phase;i.e., co-inherited alleles at adjacent heterozygous markers (haplotypes) are not identified as such. As haplotype information may considerably empower genetic analyses, indirect phasing strategies have been devised: haplotypes can be recon-structed from unphased genotypes using either familial information (Mendelian segregation and linkage) and/ or population information (linkage disequilibrium, LD, and surrogate parents) (e.g., Windig and Meuwissen
2004; Scheetand Stephens2006; Konget al.2008).
Haplotype-based approaches are routinely applied in animal genetics for combined linkage and LD mapping
of QTL (e.g., Meuwissen and Goddard 2000; Blott
et al.2003). In these studies, phasing has so far relied on familial information provided by the extended pedi-grees typical of livestock (e.g.,Windigand Meuwissen
2004). This approach, however, leaves a nonnegligible proportion of genotypes unphased, especially for the less connected individuals. After phasing, identity-by-descent (IBD) probabilities conditional on haplotype data—needed for QTL mapping—are computed for all chromosome pairs, using familial as well as population information (hence combined linkage and LD map-ping – L1LD) (e.g., Meuwissenand Goddard2001).
However, the use of high-density SNP chips and the analysis of ever larger cohorts render the computation of pairwise IBD probabilities a bottleneck.
We herein propose a more efficient, heuristic ap-proach based on hidden Markov models (HMM). It simultaneously phases and sorts haplotypes in clusters that can be used directly for mapping or other purposes. The proposed method exploits familial as well as pop-ulation information, and imputes missing genotypes. We herein describe the accuracy of the proposed method and its use for L1LD mapping of QTL.
MATERIALS AND METHODS
Haplotype reconstruction and clustering:Due to systematic recording of familial relationship in domestic animals, indi-viduals are usually part of extended pedigrees. For the purpose of haplotype reconstruction we first split the pedigree such as
Supporting information is available online athttp://www.genetics.org/ cgi/content/full/genetics.109.108431/DC1.
1Corresponding author:Unit of Animal Genomics, GIGA-R B34, 1 avenue de l’Hoˆpital, B-4000 Lie`ge, Belgium. E-mail: [email protected]
to consider only relationships between genotyped parents and genotyped offspring. In the ensuing subpedigrees, individuals can be parent only, offspring only, or parent and offspring.
Homozygous SNPs are considered phased de facto. The phasing of heterozygous genotypes proceeds in three steps:
Step I: Mendelian segregation. Marker alleles of heterozygous offspringare assigned to the paternal or maternal homolog following Mendelian segregation rules. In offspring, this leaves only SNPs unphased for which typed parents have the same heterozygous genotype as the offspring.
Step II: Linkage.
a. Parents: Parental phases are completed on the basis of allelic cosegregation in the offspring following Druet et al. (2008). This process requires heterozygous ‘‘an-choring’’ markers whose alternate alleles define the padumnal vs. madumnal homolog of the parent. For individuals that are both parent and offspring, step I will have defined several such anchoring markers. For parents without genotyped parents, it is impossible to determine the parental origin of the homologs. In this situation, we identify the most informative marker on the basis of the number of offspring for which the trans-mitted allele can be determined without ambiguity and design it as the ‘‘primordial anchoring’’ marker: one of its alleles defines the ‘‘left’’ homolog (inherited from parent A) and the other the ‘‘right’’ homolog (inherited from parent B). We then sequentially phase remaining markers with respect to already anchored ones as de-scribed in step 3 in Druet et al.(2008). In brief, the
probability that marker allele 1 belongs to the ‘‘left’’ (L) (respectively ‘‘right,’’ R) homolog is computed as PLðRÞ¼LLðRÞ=ðLL1LRÞ. In this,LLðRÞcorresponds to the likelihood that the marker allele belongs to the L (respectively R) haplotype of the parent, conditional on information from flanking anchoring markers. LLðRÞ is computed asLLUPðRÞ3L
LðRÞ
DN , in whichL LðRÞ
UPðDNÞcorrespond to the likelihood conditional on information from an-choring markers located upstream (UP) (respectively downstream, DN) of the marker to be phased.LLUPðRðÞDNÞ are computed as
Yx
i¼1
ð1riÞ
Yy
j¼1
rj;
wherex(respectivelyy) is the number of offspring with marker phase in agreement (respectively disagreement) with the tested haplotype configuration of the examined parent andri(rj) is the recombination rate between the tested marker and the nearest (respectively upstream or downstream) anchoring marker informative in offspring i(respectivelyj). For subpedigrees spanning more than two generations, parents are treated by increasing generation number,i.e.,starting with the oldest genera-tion. Step IIa is repeated until no new marker is phased. b. Offspring: Heterozygous markers that remain unphased in offspring can be further treated, conditional on the known parental phase (determined in steps I and IIa), according to step 4 in Druet et al. (2008). Using
information from flanking markers phased in both parent and offspring, the probability that a marker allele belongs to the R (respectively L) homolog of the offspring can be computed as a function of intermarker recombination rates. A marker is considered to be phased if one of the two possible configurations has a probability exceeding a chosen threshold (0.999 in this study).
Linkage information was extracted only for parents with six or more offspring (IIa), and offspring with five or more sibs
(IIb), as it was found to inflate error rates for smaller pedigrees.
Steps I and II yield partially phased genotypes:These can be subdivided into ‘‘base’’ or ‘‘founder’’ haplotypes inherited from ungenotyped parents (assigned ‘‘left’’vs.‘‘right’’ status), and ‘‘descendent’’ haplotypes inherited from genotyped parents (assigned ‘‘padumnal’’vs.‘‘madumnal’’ status).
Step III: Linkage disequilibrium: To complete haplotype reconstruction, we exploit LD information using algorithms developed either infastPHASE(Scheetand Stephens2006)
or inBeagle(S. R. Browningand B. L. Browning2007), with
some modifications. Both approaches rely on HMM (Rabiner
1989).
In thefastPHASEprobability model (FPM), observed haplo-types are modeled as mosaics of K hidden states (HS) (or ancestral haplotypes), with K held constant throughout the genome. Parameters of the HMM are (i) population frequencies of each HS, which may differ between marker positions, (ii) HS-specific allele frequencies at each marker position, and (iii) ‘‘recombination rates’’ for each marker interval. The population frequencies of the HS at the first marker position define the initial-state probabilities. Transition probabilities are computed as a function (see below) of the recombination rate and the population frequencies of the different HS at the next marker position. The HS-specific allele frequencies define the observa-tion (or emission) probabilities. As more than one allele may have nonzero frequency at a given marker position, HS in effect define clusters of related haplotypes.
The probability of a given Markov chain can be computed as
p1 ku1kl
YM
m¼2
akkm9umk9l; ð1Þ
in whichp1
kis the initial-state probability (i.e.,the probability that the Markov chain starts in HS k), um
kl is the emission probability (the probability to observe allele l at marker position m in HS k), am
kk9 is the transition probability (the
probability to move from HSkat markermto HSk9at marker m11).am
kk9equalsJmpmk911whenk6¼k9andð1JmÞ1Jmpmk911
when k ¼ k9, where Jm is the probability to have a jump (recombination) between markers m and m 1 1 (i.e., the probability to change HS between markersmandm11) and pm11
k9 is the probability that the Markov chain moves to HSk9
when a recombination occurred between markersmandm11 (corresponding to the population frequency of HS k9 at markerm11). BothJmandpmk911are independent of HS at
markerm.
Different values ofK(from 5 to 30 with steps of five) were tested (data not shown). Models performed better in terms of haplotyping or imputation with increasing K, albeit with diminishing returns. Since computing time was also increasing with largerK, a compromise value of 20 was used in the present study.
The Beagle probability model uses a localized haplotype clustering model (LHCM), which can be interpreted as a special class of HMM (S. R. Browningand B. L. Browning
2007). In this, the numberKof HS is allowed to vary across the genome and is determined by the number of edges (at the corresponding marker position) of a directed acyclic graph (DAG) summarizing all haplotypes encountered in the pop-ulation (S. R. Browningand B. L. Browning2007). The DAG
defines (i) the population frequencies of each HS at each marker position (obtained from edge counts), (ii) allelic frequencies for each HS at each marker position, and (iii) nonzero transition probabilities coinciding with sites of bi-furcation in the DAG. Generating the DAG requires specifi-cation of node-joining criteria (Browning 2006) including
and 0.0 in Browning (2006) and to 4.0 and 0.2 in B. L.
Browningand S. R. Browning(2007). We tested (data not
shown) both set of parameters plus an intermediate solution (2.0 and 0.1). As the latter performed best, it was selected for further analysis.
With the LHCM model, the probability of a given Markov chain is also computed according to Equation 1 with, however, some important differences: (i)Jmand pmk911are no longer
independent of HS at markerm, and values ofam
kk9are directly
estimated from edge counts; and (ii) while the DAG imposes um
klvalues of either 1 or 0 (according to the allele labeling the corresponding edge), these were set at 0.999 or 0.001 to accommodate genotyping errors.
Both HMM were applied in two stages. In the first stage, the models were trained on a haploid training set consisting of the partially phased base haplotypes obtained after steps I and II. In thefastPHASEoption this step generated EM parameter estimators. In theBeagleoption it generated an optimal DAG. The latter was obtained iteratively: missing alleles in the base haplotypes were initially imputed randomly (i.e.,equal prob-ability for the two alleles), and the resulting augmented haplotypes were used to build the first DAG. In subsequent iterations, missing alleles were updated by sampling from the probability distribution of HS. In the second stage, we completed the actual haplotype reconstruction and clustering by running a diploid HMM on the complete data set. The diploid HMM simultaneously models two independent chains, corresponding respectively to the ‘‘left’’ and ‘‘right’’ homolog of the individual.KL3KRHS combinations are considered at
each marker position, whereKLandKRare the number of HS
states characterizing the ‘‘left’’ and ‘‘right’’ HMM, respectively. Assume that an individual has genotype 12 at marker position m. If the phase is known to be ‘‘1left2right’’ from steps I and/or
II, the joint emission probability at that position equals um
kL1u
m
kR2. If the phase remains unknown after steps I and II,
the joint emission probability equalsum kL1u
m kR21u
m kL2u
m kR1.
The diploid HMM was first applied on the base individuals, i.e., genotyped individuals without genotyped parents. The same HMM (KL¼KR¼K) was used to model left and right
homolog with EM parameters (FPM) or optimal DAG (LHCM) as estimated on the haploid training set. For each base individual, we determined the most likely HS composi-tion of its constituent haplotypes using the Viterbi algorithm. We subsequently treated the descendent individuals using a modified diploid HMM. In this, haplotypes derived from genotyped parents were modeled as a mosaic of the two previously established (steps I and II) haplotypes of the parent (K¼2) (Guo1994), while residual base haplotypes (if any)
were modeled using the full HMM. Thus, the number of HS combinations to consider at a given marker position is 232 for individuals with two descendent haplotypes, and 23Kfor individuals with one descendent and one base haplotype. The latter ‘‘hybrid’’ situation is typical of paternal half-sib pedigrees with ungenotyped dams. The Markov chain for a descendent haplotype can still be written as
p1 ku1kl
Y
M1
m¼1
amkk9umk9l
with, however, the following changes: only two HS were allowed corresponding to the left and right homolog of the parent,p1
kwas set at 0.50 for both homologs,u m
klwas set at 0.999 for the allele present in parental haplotypekand 0.001 for the other allele (to accommodate genotyping errors), andam
kk9was
set at (1rm) andrmwhenk¼k9ork6¼k9, respectively, where rmis the recombination rate between markersmandm11. The modified diploid HMM applied on descendent individ-uals in effect extracts linkage information only (offspring with
two genotyped parents) or linkage and LD information jointly (offspring with one genotyped parent). Finally, the ‘‘popula-tion-wide’’ HS status of the base haplotypes was projected on their descendent haplotypes.
Knowledge of HS status in base and descendent individuals allows (i) phasing of the markers that remained unresolved after I and II and (ii) imputation of genotypes at missing marker positions. The corresponding data augmentation was achieved by sampling unresolved phases and missing geno-types according to their respective probabilities computed from the allele-specific emission probabilities of the constitu-ent HS.
The FPM was run with a home-made program (DualPHASE). Two programs were used to implement the LHCM. First, Beagle 2.1.3 (S. R. Browningand B. L. Browning2007) was
used to construct the optimal DAG from a set of base hap-lotypes. Then, DAGPHASE (developed as part of this work) reads the DAG and uses the derived HMM to sample hap-lotypes with a haploid model or to apply the Viterbi algorithm with the diploid model.
QTL mapping:Testing for the presence of a QTL at a given map position was performed using the following mixed model
y¼Xb1Zhh1Zuu1e;
in whichbis a vector of fixed effects, which in this study reduces to the overall mean, his the vector of random QTL effects corresponding to theKdefined HS,uis the vector of random individual polygenic effects (Henderson1984), andeis the
vector of individual error terms. HS effects with correspond-ing variance,s2
H, individual polygenic effects with
correspond-ing variance,s2
A, and individual error terms with corresponding
variance,s2
E, were estimated by restricted maximum likelihood
(REML) analysis ( Johnson and Thompson 1995). The
co-variance between individual polygenic effects corresponded to twice the coefficient of coancestry (A-matrix computed from available genealogical information) times the additive genetic variance (s2
A). The covariance between the different HS effects
was assumed to be zero, hence modeling QTL with a finite number of alleles. The presence of a QTL at a given map position was tested by a likelihood ratio test (LRT)(Georgeet al.
2000).
This novel approach was compared with the standard L1 LD QTL mapping approach relying on the computation of pairwise IBD probabilities according to Meuwissen and
Goddard(2001), followed by the clustering of chromosomes
with IBD probabilities exceeding 0.90 according to Druet et al.(2008). The haplotypes used in this analysis were the ones generated with DualPHASE.
Simulated pedigrees:We simulated SNP genotype data in a population structure typical of dairy cattle as follows. We first simulated 1000 haplotypes of length 100 Mb using the ms software (Hudson 2002). In this, we assumed an effective
population size of 5000, a mutation rate of 108per base and
generation, and a recombination rate of 1cM/Mb. We randomly selected 4% or 20% of the SNPs with minor allele frequency (MAF) higher than 0.05, yielding respectively
2300 (23 SNPs/Mb) and12,000 (120 SNPs/Mb) markers closely mimicking genome-wide densities of 70,000 and
Real pedigree: Real data consisted of a Dutch Holstein– Friesian pedigree composed of 199 sires and their 1502 sons, for a total of 1702 bulls (160/199 sires also appeared as sons). The number of sons per sires ranged from 1 to 32 (average 8.4). There were 80, 59, and 35 half-sib families with more than 5, 10, or 20 sons, respectively. All animals were genotyped for 2130 BTA14 SNP markers covering81 Mb. Haplotyping was performed with the complete data set, yet results summarized for two subregions with high and low marker density, re-spectively. The high-density subregion consisted of the first 500 markers (84 SNP/Mb) while the low-density subregion corresponded to the last 256 markers (12 SNP/Mb). Pheno-types were daughter yield deviations (DYD) for milk fat content (VanRadenand Wiggans1991). The residual
vari-ance of each DYD was weighted by the corresponding number of daughter equivalents (VanRadenand Wiggans1991).
RESULTS
Haplotyping: Haplotyping accuracy was evaluated by the number of ‘‘switches’’ per individual,i.e.,the num-ber of erroneous inferences of linkage phase between successive heterozygous markers. It was estimated both for the simulated and real data, which were very similar in terms of MAF and level of LD as a function of distance (measured asr2) (supporting information,Figure S1).
For the simulated data, the inferred phase was simply compared with the true phase and the number of switches counted. Numbers of SNPs phased, with cor-responding numbers of switches, were compiled (a) after extraction of the familial information, (b) after addition of the population information, and (c) for the complete process. Figures were collated for individuals sorted according to the richness of the familial in-formation (none, Mendelian I, linkage IIa, I1IIa, I1
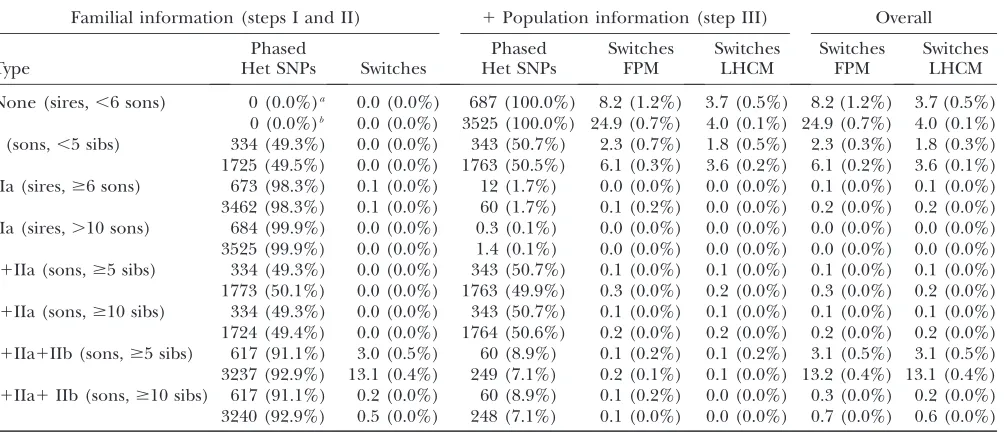
IIa1IIb). The results obtained can be summarized as follows (Table 1):
i. DualPHASE and DAGPHASE performed remark-ably well, even for individuals for whom no familial information was available or utilized (i.e.,sires with less than six offspring). For such individuals, switches affected approximately 1/900 (high-density map) and 1/200 (low-density map) intervals when using the LHCM model, or 1/150 and 1/100 intervals when using FPM, corresponding respectively to 4.0, 3.7, 24.9, and 8.2 switches for a 100-Mb-long chromosome.
ii. These results can be improved even more by judi-ciously exploiting familial information when avail-able. Extracting Mendelian information (step I) to phase offspring was always advantageous. It allows error-free phasing (assuming error-free genotyp-ing) of half of the offsprings’ heterozygous markers. Subsequent phasing of the remaining heterozygous markers using population information was ame-liorated, leading to overall switch rates of 1/1000 (high density) and 1/400 (low density) or 1/600 and 1/300 for LHCM and FPM, respectively.
iii. Extracting type IIa linkage information to phase parental genotypes proved very valuable as long as the number of available offspring was sufficient. In the specific case of paternal half-sib pedigrees with ungenotyped dams, type IIa information extracted from less than six offspring led to a marked infla-tion in switch rate (data not shown). Above this threshold, however, more than 98% of the parent’s markers (irrespective of map density) could be phased with switch rates around 1/6000 (low density) and 1/35000 (high density). Importantly, improving the phase of a parent by exploiting type IIa information had a positive effect on the quality of phase reconstruction of its offspring when using that information in step III. Indeed, the switch rate in the offspring was thereby reduced to less than 1/6000 (low density) and 1/10000 (high density). iv. Extracting type IIb linkage information to phase
offspring prior to the application of step III never proved beneficial. It always introduced more switches in the offspring than limiting familial information to steps I and IIa and then applying step III. This is due to the fact that the diploid FPM/LCHM applied to descendent individuals extracts linkage information to reconstruct the descendent padumnal haplotypes, yet performs better as it simultaneously accounts for the madumnal haplotype structure using population information.
and dense map segments, respectively. Thus, switch rates observed with the real dense map (80 markers/ Mb) were similar to those observed with the simulated sparse map (23 markers/Mb). These results point toward some decrease in haplotyping reliability when working with real data. The number of switches, how-ever, remained very acceptable, especially given the fact that in reality familial information will be available and utilized for most individuals. As for the simulated data, the LHCM model outperformed the FPM model to some extent.
Genotype imputation: An important feature of the proposed model is that it allows imputation of missing genotypes (e.g.,Marchiniet al.2007). Indeed, once the
most likely HS of a given haplotype has been deter-mined, missing marker information can be projected from the HS on the haplotype using the corresponding emission probabilities. To evaluate our imputation accuracy, we analyzed the real data set as follows. Hap-lotypes of the 1183 sons with .10 sibs were recon-structed on the sole basis of familial information (see above). Of the markers 1, 10, or 50% were randomly selected and the corresponding genotypes erased from the maternal haplotypes for a subset corresponding to 1183/2060 sons. The FPM and LHCM models were
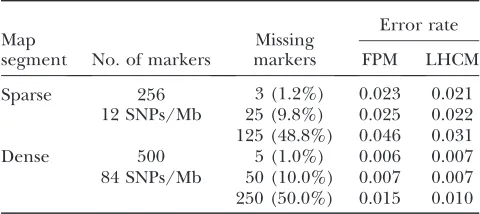
trained on the base haplotypes of the rest of the animals (i.e.,total data set minus the subset of sons that were singled out) and subsequently used to impute the missing genotypes of the 60 trimmed maternal hap-lotypes (imputation was done on the basis of LD only). Imputed genotypes were then compared with the actual ones and errors counted. The process was repeated for 19 such subsets until all sons would have been evaluated as 1 of 20 test sets and overall error rates compiled. Table 3 summarizes the results for the BTA14 segments with sparse and dense marker coverage. For the sparse map, with marker density slightly inferior to presently avail-able 50Kgenome-wide SNP panels (Charlieret al.
2008;VanTassellet al.2008), imputation errors were
2% when 1% of genotypes were missing,i.e., compa-rable to the genotyping failure rate under routine conditions. Remarkably, imputation errors remained
,5% even when imputing half the genotypes purely from LD information. For the dense part of the map, with coverage corresponding to a genome-wide panel of 250,000 SNP, imputation error remained less than 1% even with 50% missing genotypes. As for haplotyping, LHCM slightly outperformed FPM.
Haplotype clustering: Using FPM and LHCM, and
assuming a specific map position, every haplotype in the
TABLE 1
Phasing accuracy—simulated data
Familial information (steps I and II) 1Population information (step III) Overall
Type
Phased
Het SNPs Switches
Phased Het SNPs
Switches FPM
Switches LHCM
Switches FPM
Switches LHCM
None (sires,,6 sons) 0 (0.0%)a 0.0 (0.0%) 687 (100.0%) 8.2 (1.2%) 3.7 (0.5%) 8.2 (1.2%) 3.7 (0.5%) 0 (0.0%)b 0.0 (0.0%) 3525 (100.0%) 24.9 (0.7%) 4.0 (0.1%) 24.9 (0.7%) 4.0 (0.1%) I (sons,,5 sibs) 334 (49.3%) 0.0 (0.0%) 343 (50.7%) 2.3 (0.7%) 1.8 (0.5%) 2.3 (0.3%) 1.8 (0.3%) 1725 (49.5%) 0.0 (0.0%) 1763 (50.5%) 6.1 (0.3%) 3.6 (0.2%) 6.1 (0.2%) 3.6 (0.1%) IIa (sires,$6 sons) 673 (98.3%) 0.1 (0.0%) 12 (1.7%) 0.0 (0.0%) 0.0 (0.0%) 0.1 (0.0%) 0.1 (0.0%) 3462 (98.3%) 0.1 (0.0%) 60 (1.7%) 0.1 (0.2%) 0.0 (0.0%) 0.2 (0.0%) 0.2 (0.0%) IIa (sires,.10 sons) 684 (99.9%) 0.0 (0.0%) 0.3 (0.1%) 0.0 (0.0%) 0.0 (0.0%) 0.0 (0.0%) 0.0 (0.0%) 3525 (99.9%) 0.0 (0.0%) 1.4 (0.1%) 0.0 (0.0%) 0.0 (0.0%) 0.0 (0.0%) 0.0 (0.0%) I1IIa (sons,$5 sibs) 334 (49.3%) 0.0 (0.0%) 343 (50.7%) 0.1 (0.0%) 0.1 (0.0%) 0.1 (0.0%) 0.1 (0.0%) 1773 (50.1%) 0.0 (0.0%) 1763 (49.9%) 0.3 (0.0%) 0.2 (0.0%) 0.3 (0.0%) 0.2 (0.0%) I1IIa (sons,$10 sibs) 334 (49.3%) 0.0 (0.0%) 343 (50.7%) 0.1 (0.0%) 0.1 (0.0%) 0.1 (0.0%) 0.1 (0.0%) 1724 (49.4%) 0.0 (0.0%) 1764 (50.6%) 0.2 (0.0%) 0.2 (0.0%) 0.2 (0.0%) 0.2 (0.0%) I1IIa1IIb (sons,$5 sibs) 617 (91.1%) 3.0 (0.5%) 60 (8.9%) 0.1 (0.2%) 0.1 (0.2%) 3.1 (0.5%) 3.1 (0.5%) 3237 (92.9%) 13.1 (0.4%) 249 (7.1%) 0.2 (0.1%) 0.1 (0.0%) 13.2 (0.4%) 13.1 (0.4%) I1IIa1IIb (sons,$10 sibs) 617 (91.1%) 0.2 (0.0%) 60 (8.9%) 0.1 (0.2%) 0.0 (0.0%) 0.3 (0.0%) 0.2 (0.0%) 3240 (92.9%) 0.5 (0.0%) 248 (7.1%) 0.1 (0.0%) 0.0 (0.0%) 0.7 (0.0%) 0.6 (0.0%)
Information used for phasing: I, use of Mendelian segregation rules to reconstruct the offspring’s phase; IIa, use of linkage information to reconstruct the parental phase (marker alleles that tend to be cotransmitted reside on the same homolog); IIb, use of linkage information to reconstruct the offspring’s phase (a chromosome segment flanked by two alleles originating from the same parental homolog is assumed to completely derive from that homolog unless the probability of double cross-over is.0.999; III, use of population-wide linkage disequilibrium information.
a
Low-density map (2364 markers). b
population can be assigned to the ‘‘most likely’’ out ofK hidden states. Hence, haplotypes are sorted in clusters of what are assumed to be genealogically related haplo-types. We verified this assertion on both simulated and real data.
We first used the ms software (Hudson 2002) to
simulate 1000 10-Mb haplotypes originating from a population with effective size of 100. As before, muta-tion rate was set at 108per base and per generation,
while the recombination rate was set at 1 cM/Mb. All polymorphisms with MAF .5% were retained for analysis, corresponding to 119 polymorphisms on aver-age (or 12 SNPs/Mb). For each pair of haplotypes, we retrieved the time of coalescence at position 5 Mb,i.e., in the middle of the chromosome (using the –T option of ms to obtain gene trees, Newick format, and branch lengths). We consider that the time of coalescence is the best measure of relatedness between two chromosomes. We then applied the FPM and LHCM on the collection of 1000 haplotypes and determined for each of them the most likely HS at position 5 Mb. Two haplotypes were grouped in the same cluster at position 5 Mb only if they were assigned to identical HS at the two flanking markers. For comparison we computed all pairwise probabilities of IBD conditional on flanking marker data at the same position using the widely used deter-ministic approach of Meuwissenand Goddard(2001),
followed by the clustering of chromosomes with pairwise IBD probabilities .0.9 following Druet et al. (2008),
jointly referred to as ‘‘IBD approach.’’ To compute IBD probabilities, the effective population size was set at 100, the number of generations to the base population at 100, and information was considered for 5 markers on the left and right of the analyzed map position.
Table 4 summarizes the results. The probability for two randomly selected chromosomes to be part of the same cluster was higher for the IBD approach (0.2) than for FPM (0.12) and LHCM (0.08), suggesting that a larger proportion of chromosomes is included in a
smaller number of clusters with the IBD approach. The average IBD probability between chromosomes of the same cluster was higher for the IBD approach (0.97) than for the FPM (0.91) and LHCM (0.93) approaches, suggesting superior performances of the former. However, when using time of coalescence as measure of relatedness, the average time of coalescence (expressed in 4N gen-erations) for pairs of clustered chromosomes proved to be lowest for LHCM (0.10¼40 generations), intermediate for FPM (0.14 ¼56 generations), and highest for IBD (0.21¼84 generations). The figures in Table 4 suggest that the IBD approach tends to underestimate the within-LHCM/FPM cluster IBD probabilities. This may be due to the reduced ability of the IBD approach to deal with mutational events, which were not modeled by Meuwissenand Goddard(2001). Thus, a mutation
(or a genotyping error) in one of the two confronted haplotypes will heavily penalize the IBD probability irrespective of their resemblance on either side of the mutated site, while the LHCM/FPM models will be much more forgiving in such situation. Alternatively, the IBD approach may overestimate the within-IBD cluster IBD probabilities: the coalescence of haplotypes that are IBS over long segments may nevertheless be remote.
TABLE 2
Phasing accuracy—real data
Familial information (steps I) 1Population information (step III) Overall
Type Phased Het SNPs Switches Phased Het SNPs Switches FPM Switches LHCM Switches FPM Switches LHCM
None 0 (0.0%)a 0.0 (0.0%) 65.22 (100.0%) 1.71 (2.6%) 0.98 (1.5%) 1.71 (2.6%) 0.98 (1.5%) 0 (0.0%)b 0.0 (0.0%) 116.87 (100.0%) 1.52 (1.3%) 0.86 (0.7%) 1.52 (1.3%) 0.86 (0.7%) I 35.80 (54,9%) 0.0 (0.0%) 29.42 (45.1%) 0.55 (1.9%) 0.45 (1.5%) 0.55 (0.8%) 0.45 (0.7%) 64.21 (54.9%) 0.0 (0.0%) 52.66 (45.1%) 0.49 (0.9%) 0.48 (0.9%) 0.49 (0.4%) 0.48 (0.4%)
Information used for phasing: I, use of Mendelian segregation rules to reconstruct the offspring’s phase; III, use of population-wide linkage disequilibrium information.
a
Low-density segment (256 markers).
bHigh-density map (500 markers). Approximately 67 and 69% of the markers, corresponding to 171.08 and 343.46 markers for the low- and high-density maps, respectively, were homozygous and considered phased de facto. Approximately 8% of the markers, corresponding to 19.71 and 39.66 markers for the low- and high-density maps, respectively, remained unphased after step IIb and were not used for comparison.
TABLE 3
Imputation accuracy—real data
Error rate Map
segment No. of markers
Missing
markers FPM LHCM
Sparse 256 12 SNPs/Mb
3 (1.2%) 0.023 0.021 25 (9.8%) 0.025 0.022 125 (48.8%) 0.046 0.031
Dense 500
84 SNPs/Mb
We then compared the clustering of the 1183 real BTA14 haplotypes obtained with the IBD, LHCM, or FPM approach. Dense and sparse map segments were considered separately. As for the simulated data, the IBD approach clustered more pairs of haplotypes (20 and 12% for the dense and sparse maps, respectively) than FPM (15 and 9%) and LHCM (11 and 7%) and the mean IBD probability between grouped haplotypes was higher (0.98 and 0.98) than with FPM (0.92 and 0.84) and LHCM (0.91 and 0.76). Figure 1 shows the cumu-lative distributions (in percentage) of grouped (or non-grouped) haplotype pairs with increasing IBD probability for the three methods. For the dense map (Figure 1A), 87.4% (FPM), 86.5% (LHCM), and 100.0% (IBD ap-proach) of grouped haplotypes have IBD probability higher than 0.90. With all methods, more than 50% of grouped haplotypes have IBD probability exceeding 0.99. However, the figure indicates that a nonnegligible proportion of haplotype pairs grouped by FPM or LHCM have low IBD probability. This is due to the higher tolerance of FPM/LHCM to punctual differ-ences (genotyping errors and mutations) and to ‘‘edge effects’’; i.e., transitions between hidden states occur abruptly at specific marker positions with FPM/LHCM while IBD probabilities evolve gradually. Figure 1A also shows that for a majority (70%) of nongrouped haplotypes, the estimated IBD probability is zero irre-spective of the method. However, although the IBD ap-proach by definition groups all pairs with IBD probability exceeding 0.90, with FPM and LHCM approximately 10% of nongrouped haplotype pairs have IBD proba-bility.0.90. Indeed, with FPM/LHCM haplotypes that are identical-by-state over10 markers may sometimes be assigned to distinct clusters differing further down the map. Finally, Figure 1B shows that for the lower density map, more haplotype pairs have intermediate IBD probabilities resulting in more grouped haplotypes with IBD probability lower than 0.90 and fewer non-grouped pairs with IBD probability of either 0 or.0.90.
QTL mapping: Having demonstrated that the FPM
and LHCM cluster genealogically related haplotypes as expected, we evaluated the utility of this information to map and fine map QTL. To that end, we analyzed the real pedigree, phenotype, and BTA14 genotype data, knowing that BTA14 harbors theDGAT1gene at map
position 445 kb and that the examined population segregates for the previously described Lys232Ala mu-tation that has a major effect on milk fat composition (Grisartet al. 2002, 2004). The frequency of the fat
increasing allele (¼Lys) in the maternal chromosomes of the sons was 0.46. QTL mapping was performed after exclusion ofDGAT1polymorphisms from the SNP data. The closest SNPs were respectively at map posi-tion 291 Kb (SNP 20) and 560 Kb (SNP 21). Haplotype clusters defined by either of the three approaches (FPM, LHCM, IBD) were included as additive random effects in a mixed model as detailed inmaterials and methods.
Overall the three methods yielded very similar loca-tion score profiles (Figure 2). The curves obtained with FPM and LHCM were, in general, smoother than with the IBD approach. As expected the three curves maxi-mized in the vicinity of theDGAT1gene. Note that the IBD approach computes location scores in marker in-tervals, while the FPM and LHCM approaches compute location scores at marker positions. The IBD curve correctly maximized in the interval containingDGAT1. Likewise, with the FPM approach the two most signifi-cant markers (SNP 20 and 21) were adjacent and immediately flanking DGAT1. With the LHCM ap-proach, however, the two most significant markers were 22 and 23 when analyzing the chromosome from left to right and were 19 and 20 when analyzing from right to left. The corresponding intervals are respectively 135 and 139 kb away from DGAT1. We attribute this lesser precision of LHCM to the inherent difficulties in re-liably reconstructing the extremities of the DAG. The maximum LRT was highest for the IBD approach, followed by the LHCM and FPM approaches. However, differences were modest.
QTL mapping power and accuracy should be de-termined by the ability to segregate the causative QTN variants in distinct haplotype clusters, i.e.,the level of LD between haplotype clusters and QTN as measured by r2. Knowledge of the causativeLys232Ala DGAT1
muta-tion in the case of the BTA14 QTL on milk fat content allowed us to compare the discriminating performances of the three approaches. Following Hayeset al. (2006),
the proportion of the QTN variance explained by the haplotype clusters was computed as
TABLE 4
Genetic relatedness of clustered haplotypes measured by coalescence time or probability of identity-by-descent: simulations
Time of coalescence (4Ngenerations) Probability of identity-by-descent (IBD) Clustering
algorithm
% clustered
chrom. pairs Within clusters Between clusters Within clusters Between clusters
LHCM 8.2 0.10 1.11 0.93 0.27
FPM 12.1 0.14 1.15 0.91 0.24
r2¼ 1
qð1qÞ
XK
i¼1 Di2
pi
;
where q is the population frequency of the QTN (assuming a biallelic QTL), pi is the population
fre-quency of haplotype clusteri (ofK), andDiis the LD
between haplotype clusteri, and the QTN computed as piðqjpiÞ piq. Values ofr2, computed at the maximum
LRT position for each method, were 0.62, 0.62, and 0.68 for FPM, LHCM, and IBD, respectively, hence suggesting a slight superiority of the IBD approach in agreement with the location scores. This higherr2was,
however, obtained with twice as many clusters or more. Figure 3 shows for the 20, 16, and 40 haplotype clusters defined respectively by the FPM, LHCM, and IBD approaches at their respective maximum LRT location (i) population frequency, (ii) composition with
respect to the DGAT1 Lys232Ala mutation, and (iii) effect on fat content. The three methods yielded con-gruent haplotype patterns confirming (i) the major effect of theLys232Alamutation and (ii) the previously described paradoxical haplotype homogeneity of the ancestral Lys232allele [79% (FPM), 78% (LHCM) and 76% (IBD) of the Lys232 alleles are confined to one haplotype cluster] vs. haplotype heterogeneity of the derived 232Alaallele [7(HMM), 7 (LHCM), and 9 (IBD) haplotype clusters are required to account for 80% of the232Alaalleles] (Grisartet al.2002).
DISCUSSION
We herein describe a method and accompanying soft-ware that efficiently phases high-density SNP genotype data. The proposed method builds on either of two pre-viously described hidden Markov models (FastPHASE/ FPM, Scheetand Stephens2006;Beagle/LHCM, S. R.
Browning and B. L. Browning 2007) implemented
to phase genotypes from human populations. An impor-tant advance of our approach is that it simultaneously extracts population (LD) and familial information (Mendelian segregation and linkage), whereas previous methods used either one of these but not both (note that the latest Beagle version handles trios; Browningand
Browning2009). This feature improves the accuracy
of the phase reconstruction (see Tables 1 and 2). It particularly affects the integrity of long-range haplo-types. This knowledge may be useful for the detection of founder mutations on the basis of shared extended haplotypes.
Being based on hidden Markov models, the devel-oped methods assign reconstructed haplotypes to a limited number of hidden clusters. We propose direct use of the ensuing information for QTL mapping in a mixed model/REML setting. We demonstrate that both Figure1.—Percentage (y-axis) of grouped (open symbols)
or nongrouped (solid symbols) haplotype pairs with IBD probability below a certain probability (x-axis). FPM (squares), LHCM (triangles), or IBD approach (circles). It can, for in-stance, be seen that 100% of haplotype pairs that are not grouped with the IBD approach have IBD probability ,0.9 (solid circle) and that 0% of haplotype pairs that are grouped with the IBD approach have IBD probability,0.9 (open cir-cle). (A) dense part of BTA14, (B) sparse part of BTA14.
Figure2.—LRT profiles in the first 5 Mb of BTA14 for fat
FPM and LHCM clusters generate mapping results that are comparable to those obtained with the standard ap-proach based on pairwise IBD probabilities (Meuwissen
and Goddard2001), yet with substantial computational
gain. On a dual-core computer (running at 2.13 GHz and with 2 GB RAM), DAGPHASE (LHCM) would phase and cluster the haplotypes corresponding to the real BTA14 data in 47 min and DualPHASE (FPM) in 966 min, while the IBD approach implemented with our own program would require 9133 min to compute all pairwise IBD probabilities using already phased geno-types. The corresponding output files were 28 Mb for DAGPHASE, 21 Mb for DualPHASE, and 74 Gb for the IBD approach. We used IBD probabilities as in Meuwissenand Goddard(2001) although Meuwissen
and Goddard(2007) added mutation to their model. In
addition we limited the computation of IBD probabilities to windows of 10 markers although the method could be applied to longer markers windows, at the expense of increased computating time.
In this study, we applied only single QTL models. How-ever, it is straightforward to extend the approach to multiple QTL, including fitting as many effects as available SNPs as done in genomic selection (Meuwissen et al.
2001). Analyses to evaluate the benefit of haplotype rather than single marker information in genomic selection are ongoing (A. P. W.de Roos and T. Druet, unpublished
results).
One advantage of clustering haplotypes on the basis of their relatedness followed by the estimation of the phenotypic effect of individual clusters is the ensuing possibility of identifying clusters that are most likely to be functionally different and on which to focus molec-ular studies to identify the causative QTL.
The proposed approach allows accurate genotype imputation (see Table 3). For missing data points, the most likely genotypes can be inferred from the emission probabilities of the clusters to which an individual’s haplotypes are assigned. The ability to reliably fill in missing genotypes facilitates the computation of pair-wise IBD probabilities using standard methods (e.g., Meuwissenet al.2001; Druetet al.2008). It also allows
merging of data sets generated with distinct SNP panels (e.g., Marchini et al. 2007; T. Druet, unpublished
results). This application is relevant when part of the population is genotyped using high-density arrays yet the majority is genotyped with a low-density panel. Such schemes have been proposed for the fine mapping of QTL using nested association mapping in experimental crosses of plants (Yuet al.2008), as well as for expanding
genomic selection to the general dairy cattle population (Habieret al.2009). Moreover, the ability to predict the
most likely genotype from hidden state information can easily be exploited for the detection of likely genotyping errors.
The LinkPHASE (steps I and II), HiddenPHASE (step III with FPM), DualPHASE (steps I, II, and III with FPM) Figure3.—Frequency and composition with respect to the
and DAGPHASE (step III with LHCM) programs form the PHASEBOOK programs suite and are available from the authors upon request.
The authors thank Paul Scheet and Sharon Browning for answering our questions on fastPHASE and Beagle and Wouter Coppieters, Fre´de´ric Farnir and Mathieu Gautier, for their comments and suggestions on this work. Tom Druet is Research Associate from the Fonds National de la Recherche Scientifique (FNRS). This work was funded by grants from the Service Public de Wallonie and from the Communaute´ Francxaise de Belgique (Biomod ARC). CRV (http:// www.crv4all.com/) provided the real data set.
LITERATURE CITED
Blott, S., J. J. Kim, S. Moisio, A. Schmidt-Kuntzel, A. Cornetet al.
2003 Molecular dissection of a quantitative trait locus: a phenyl-alanine-to-tyrosine substitution in the transmembrane domain of the bovine growth hormone receptor is associated with a major effect on milk yield and composition. Genetics163:253–266.
Browning, B. L., and S. R. Browning, 2007 Efficient multilocus
association testing for whole genome association studies using localized haplotype clustering. Genet. Epidemiol.31:365–375.
Browning, B. L., and S. R. Browning, 2009 A unified approach to
genotype imputation and haplotype-phase inference for large data sets of trios and unrelated individuals. Am. J. Hum. Genet.
84:210–223.
Browning, S. R., 2006 Multilocus association mapping using
vari-able-length Markov chains. Am. J. Hum. Genet.78:903–913.
Browning, S. R., and B. L. Browning, 2007 Rapid and accurate
haplotype phasing and missing-data inference for whole-genome association studies by use of localized haplotype clustering. Am. J. Hum. Genet.81:1084–1097.
Charlier, C., W. Coppieters, F. Rollin, D. Desmecht, J. S.
Agerholmet al.2008 Highly effective SNP-based association
mapping and management of recessive defects in livestock. Nat. Genet.40:449–454.
Druet, T., S. Fritz, M. Boussaha, S. Ben-Jemaa, F. Guillaumeet al.
2008 Fine mapping of quantitative trait loci affecting female fertility in dairy cattle on BTA03 using a dense single-nucleotide polymorphism map. Genetics178:2227–2235.
George, A. W., P. M. Visscherand C. S. Haley, 2000 Mapping
quantitative trait loci in complex pedigrees: a two-step variance component approach. Genetics156:2081–2092.
Goddard, M.E., and B.J. Hayes, 2009 Mapping genes for complex
traits in domestic animals and their use in breeding programmes. Nat. Rev. Genet.10(6): 381–391.
Grisart, B., W. Coppieters, F. Farnir, L. Karim, C. Ford et al.
2002 Positional candidate cloning of a QTL in dairy cattle: identi-fication of a missense mutation in the bovine DGAT1 gene with ma-jor effect on milk yield and composition. Genome Res.12:222–231.
Grisart, B., F. Farnir, L. Karim, N. Cambisano, J. J. Kimet al.
2004 Genetic and functional confirmation of the causality of the DGAT1 K232A quantitative trait nucleotide in affecting milk yield and composition. Proc. Natl. Acad. Sci. USA101:2398–2403. Guo, S. W., 1994 Computation of identity-by-descent proportions
shared by two siblings. Am. J. Hum. Genet.54:1104–1109.
Habier, D., R. L. Fernandoand J. C. Dekkers, 2009 Genomic
se-lection using low-density marker panels. Genetics182: 343–353.
Hayes, B. J., A. J. Chamberlainand M. E. Goddard, 2006 Use of
markers in linkage disequilibrium with QTL in breeding programs. Proceeding from the 8th World Congress of Genetics Applied to Livestock Production, Belo Horizonte, Brazil, August 13–18.
Henderson, C. R., 1984 Estimation of variances and covariances
un-der multiple traits models. J. Dairy Sci.67:1581–1589.
Hudson, R. R., 2002 Generating samples under a Wright–Fisher
neutral model of genetic variation. Bioinformatics18:337– 338.
Johnson, D. L., and R. Thompson, 1995 Restricted maximum
likeli-hood estimation of variance components for univariate animal models using sparse matrix techniques and average information. J. Dairy Sci.78:449–456.
Kong, A., G. Masson, M. L. Frigge, A. Gylfason, P. Zusmanovich
et al.2008 Detection of sharing by descent, long-range phasing and haplotype imputation. Nat. Genet.40:1068–1075.
Marchini, J., B. Howie, S. Myers, G. McVeanand P. Donnelly,
2007 A new multipoint method for genome-wide association studies by imputation of genotypes. Nat. Genet.39:906–913.
Meuwissen, T. H., and M. E. Goddard, 2000 Fine mapping of
quantitative trait loci using linkage disequilibria with closely linked marker loci. Genetics155:421–430.
Meuwissen, T. H., and M. E. Goddard, 2001 Prediction of identity
by descent probabilities from marker-haplotypes. Genet. Sel. Evol.33:605–634.
Meuwissen, T. H., and M. E. Goddard, 2007 Multipoint
identity-by-descent prediction using dense markers to map quantitative trait loci and estimate effective population size. Genetics176:2551– 2560.
Meuwissen, T. H., B. J. Hayesand M. E. Goddard, 2001 Prediction
of total genetic value using genome-wide dense marker maps. Genetics157:1819–1829.
Rabiner, L. R., 1989 A tutorial on Hidden Markov Chains and
se-lected applications in speech recognition. Proc. IEEE77:257–286.
Scheet, P., and M. Stephens, 2006 A fast and flexible statistical
model for large-scale population genotype data: applications to inferring missing genotypes and haplotypic phase. Am. J. Hum. Genet.78:629–644.
VanRaden, P. M., and G. R. Wiggans, 1991 Derivation, calculation,
and use of national animal model information. J. Dairy Sci.74:
2737–2746.
VanTassell, C. P., T. P. Smith, L. K. Matukumalli, J. F. Taylor, R.
D. Schnabelet al.2008 SNP discovery and allele frequency
es-timation by deep sequencing of reduced representation libraries. Nat. Methods5:247–252.
Voight, B.G., S. Kudaravalli, X. Wenand J.K. Pritchard, 2006 A
map of recent positive selection in the human genome. PloS Biol.
4(3): e72.
Wellcome Trust Case Control Consortium, 2007 Genome wide asso-ciation study of 14,000 cases of seven common diseases and 3,000 shared controls. Nature447:645–646.
Windig, J. J., and T. H. E. Meuwissen, 2004 Rapid haplotype
recon-struction in pedigrees with dense marker maps. J. Anim. Breed. Genet.121:26–39.
Yu, J., J. B. Holland, M. D. McMullen and E. S. Buckler,
2008 Genetic design and statistical power of nested association mapping in maize. Genetics178:539–551.
Supporting Information
http://www.genetics.org/cgi/content/full/genetics.109.108431/DC1
A Hidden Markov Model Combining Linkage and Linkage
Disequilibrium Information for Haplotype Reconstruction
and Quantitative Trait Locus Fine Mapping
Tom Druet and Michel Georges
Copyright © 2010 by the Genetics Society of America
T. Druet and M. Georges 2 SI
A
B
FIGURE S1.—(A) Frequency (in percent) of classes of minor allelic frequencies, (B) mean r between markers (results