Structures, Systems and Components
ON SASSI-POINT3 GREEN’S FUNCTION EVALUATION
JiunnMing Jim Lee
1and Wen S. Tseng
21Managing Principal, Paul C. Rizzo Associates, Inc., Oakland, CA ([email protected]) 2Senior Principal, Paul C. Rizzo Associates, Inc., Oakland, CA ([email protected])
ABSTRACT
This paper presents an evaluation of SASSI-POINT3 Green’s function computation for prediction of seismic waves generated by an earth crust dislocation model. In this evaluation, transverse surface response (SH-wave) time histories generated by a vertical strike-slip dislocation at a depth of 8 km are computed by using the SASSI program (2007), at several different epicentral distances. The earth crust model studied consists of a uniform crust of 32-km thickness overlying an elastic half-space. The vertical strike-slip dislocation is represented by a double couple, which produces an equivalent stress field in the earth crust. The derivative of the source time history is represented by a 0.6-sec quadratic-ramp double-sided function. The results obtained from the SASSI analysis of the problem are compared with the Apsel and Luco’s Wave-Number Integration solution (1983) and Helmberger’s Generalized Ray solution (1974) for the same problem. Good agreements are obtained in these comparisons.
INTRODUCTION
Seismic waves generated from an earthquake source propagate radially from the epicenter through free field of earth crust to some distant locations. In the past, seismologists have studied such seismic wave propagation problems using various methods. Most of them used theoretical formulations to obtain closed-form solutions for idealized boundary-value problems. Some have used the finite element method to analyze the wave propagation problems. Among previous researchers, C. L. Pekeris, and H. Lifson (1957) studied motion on the surface of uniform elastic half-space produced by a buried pulse. R. J. Apsel (1979) used dynamic Green’s function generated for layered media and applied them to solve boundary-value problems. Later, J. E. Luco and R. J. Apsel (1983) also studied the dynamic Green’s function for a layered half-space. S. M. Day (1977) performed finite element analysis to study seismic scattering problems.
Recently, engineers have applied the SASSI computer program extensively for solving various soil-structure interaction problems. These applications play an important role in design of safety critical facilities such nuclear power plants. The SASSI computer program employs numerically computed dynamic Green functions for solving seismic wave propagation in —horizontally layered soil media. The numerical computation of the SASSI Green’s function is done in the POINT3 Module for a 3-dimensional point load problem. This calculation is essential for forming soil compliance (dynamic flexibility) matrix for the free-field soil medium studied.
Thus, it is interesting to investigate how well can SASSI generate the numerical Green’s function for a long distance seismic wave propagation problem. In this paper, a 32-km-thick earth crust overlaying an elastic half-space as shown in Figure 1 is considered for the evaluation of the validity and accuracy of the SASSI-POINT3 Green’s function computation.
ANALYTICAL MODEL
system as shown in Figure 3. The shear wave velocity (Vs) for the crust is 3,500 m/sec (mps) and the
compression wave velocity (Vp) is 6200 mps. The mass density of the crust is 2.7 gm/cm3 corresponding
to a unit weight of 2.7(9.807)=26.5 kN/m3. The material attenuation coefficients of crust for shear wave
is Q=300 and for compression wave is Q=600. The damping ratio of crust for shear wave is thus
approximately 1/(2Q) = 0.00167, and for compression wave, 1/(2Q) = 0.00083. The maximum
frequency that this model can transmit is 3500/(5
320) = 2.19 cps.The half-space has a shear wave velocity of 4,500 mps and a compression wave velocity of 8,200 mps. The mass density is 3.4 gm/cm3 corresponding to a unit weight of 3.4(9.807) = 33.4 kN/m3. The
material attenuation coefficients are the same as those of the crust.
SOURCE TIME HISTORY OF A VERTICAL STRIKE-SLIP DISLOCATION
The vertical strike-slip earth crust dislocation at the depth of 8 km is simulated by a double couple occurring at a depth of 8 km as shown in Figures 1 and 2. The double couple is formed by forces of 100,000 kN
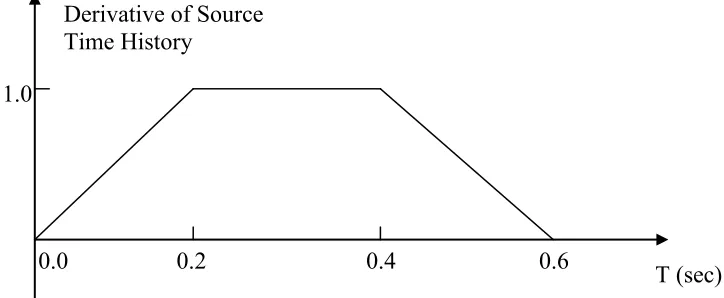
1.0 m at a angle of 45o from the X-axis (radial direction). The time history of thisdouble-couple source is prescribed as a double-sided time function of a duration of 100 sec as shown in Figure 4. The time history input to SASSI is augmented with trailing zeroes of duration of 63.84 seconds giving a total of 16,384 points digitized at a time interval of 0.01 seconds. The derivative of the 0.6-sec quadratic ramp is shown in Figure 5.
SASSI TRANSFER FUNCTION ANALYSIS
With a total number of Fourier points of 16,384 at the interval of 0.01 sec giving a frequency interval of 0.00610 Hz, SASSI transfer function analysis is performed with SITE, POINT, HOUSE, and ANLYS modules. A central-zone radius of 0.4 m for the SASSI-POINT load calculation is used. The SASSI solutions for a total of 400 frequencies up to the maximum of 2.4 Hz are computed. For long-distance wave-propagation analysis such as that performed herein, the accuracy of the complex frequency response function depends significantly on the imaginary part (phase angle) of the calculated complex frequency response transfer function.
RESULTS AND COMPARISONS
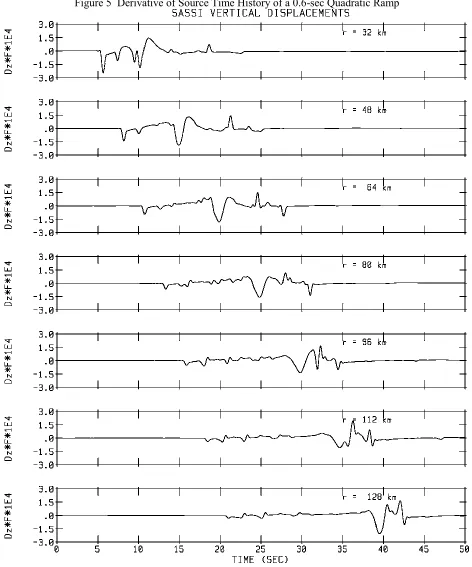
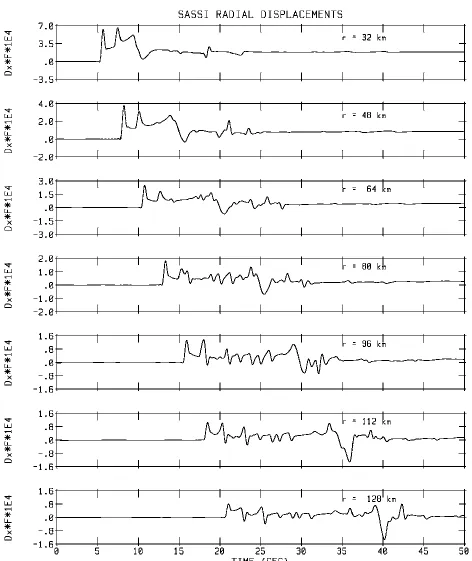
Transverse (SH-wave) displacement response time histories computed by the SASSI program are normalized. The computed displacements are multiplied by a factor of F = (G*106m2/M
o) where G is the
shear modulus of crust and Mo is the source moment. The normalized displacements become
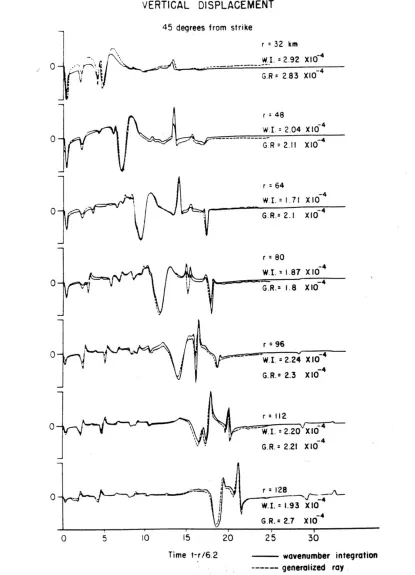
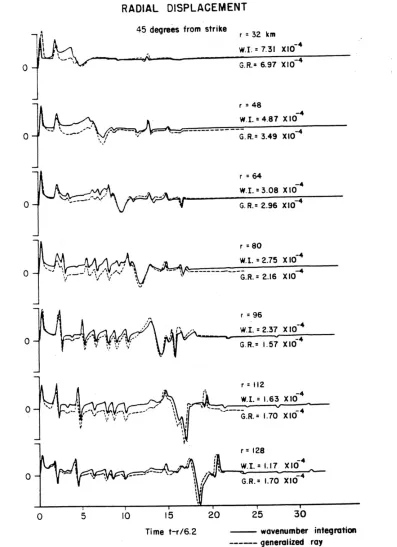
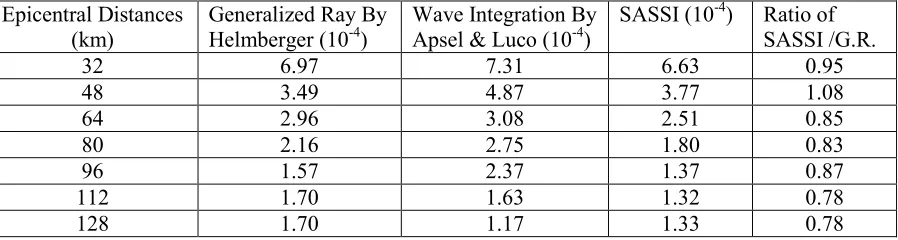
dimensionless. The vertical and radial component dimensionless transverse response displacement time histories generated at various epicentral distances, r = 32 km to 128 km, are shown in Figures 6A and 6B, respectively. The corresponding solutions obtained by Apsel and Luco and by Helmburger are shown in Figures 7A and 7B, in which the initial arrival time of compression wave is eliminated with a shift of r (km)/6.2. Maximum response displacement amplitudes among the different solutions are listed in Tables 1 and 2, respectively for the vertical and the radial components.
Comparisons between the SASSI computed site response displacement time histories and the corresponding solutions by Apsel and Luco and by Helmburger show that they are in general in good agreement.
CONCLUSIONS
Helmberger’s Generalized Ray solution (1974). Based on the comparison of results as presented in this paper, it can be concluded that the SASSI-POINT3 numerical Green’s function computation is validated for the long distance wave propagation problem analyzed in this paper. Comparisons of SASSI analysis results with the corresponding previous published results show good agreement.
REFERENCES
Apsel, R.J. (1979), “Dynamic Green’s Functions for a Layered Media and Application to Boundary-Value Problems,” Ph.D. Thesis, University of California, San Diego, La Jolla, California.
Day, S. M. (1977), “Finite Element Analysis of Seismic Scattering Problems,” Ph.D. Thesis, University of California, San Diego, La Jolla, California.
Pekeris, C.L. and Lifson, H. (1957), “Motion on the Surface of a Uniform Elastic Half-Space Produced by a Buried Pulse,” Journal of American Acoustic Society, Vol. 29, pp. 1233-1238.
Apsel, Randy and Luco, Enrique (1983). “On the Green’s Functions for a Layered Half-Space, Part II,”
Bulletin of the Seismological Society of America, Vol. 73, No. 4, pp. 931-951
Helmburger, D.V. (1974). “Generalized Ray Theory for Shear Dislocations,” Bulletin of the Seismological Society of America, Vol. 64, pp. 45-64.
Harkrider, D. G. (1964). “Surface Waves in Multilayered Elastic Media. Part I. Rayleigh and Love Waves from Buried Sources in Multilayered Elastic Half-Space,” Bulletin of the Seismological Society of America, Vol. 54, pp.627-680.
Harkrider, D. G. (1970). “Surface Waves in Multilayered Elastic Media. Part II. Higher Mode Spectra and Spectral Ratio from Point Sources in Plane Layered Earth Models,” Bulletin of the Seismological Society of America, Vol. 60, pp.377-393.
Figure 1 Configuration of Earth Crust
Figure 2 Top View of Source of Dislocation and Epicentral Distances
32-km-Thick Earth Crust
Elastic Half-Space
Source of earth
crust dislocation
8-km
X
(radial)
Z
32
48
64
80
96
Epicenter, Source of Vertical
Strike-Slip Dislocation
X (km)
Y
112
(Radial)
128
Plane of earth
crust dislocation
45
ofrom the
Strike
Figure 3 Site Model of Earth Crust
Figure 4 Double-Sided Quadratic Ramped Source Time History for a duration of 100 sec
Weight density=26.5 kN/m
3V
s= 3500 mps V
p= 6200 mps
Poisson’s Ratio=0.267
Q
=600 Q
=300
Weight density=33.4 kN/m
3V
s= 4500 mps V
p= 8200 mps
Poisson’s Ratio=0.285
Q =600 Q =300
10
Unequal-Thickness Layers
of Half-Space
(mantle)
100 Equal-Thickness
Layers of 320m
(earth crust)
32 km
T (sec)
Derivative of Source
Time History
0.2
0.4
0.6
Figure 5 Derivative of Source Time History of a 0.6-sec Quadratic Ramp
Figure 6B Normalized Dimensionless Radial Displacements of SASSI Results at Various Epicentral
Figure 7A Normalized Dimensionless Vertical Displacements Computed by Apsel and Luco (1983) and Helmburger (1974) for Epicentral Distances of 32 km to 128 km
Figure 7B Normalized Dimensionless Radial Displacements Computed by Apsel and Luco (1983) and Helmburger (1974) for Epicentral Distances of 32 km to 128 km
Table 1 Maximum Normalized Vertical Amplitudes of Displacements Among Different Solutions
Epicentral Distances
(km) Generalized Ray By Helmberger (10-4) Wave Integration By Apsel & Luco (10-4) SASSI (10
-4) Ratio of
SASSI /G.R.
32 2.83 2.92 2.45 0.87
48 2.11 2.04 1.88 0.89
64 2.10 1.71 1.79 0.85
80 1.80 1.87 1.58 0.88
96 2.30 2.24 1.65 0.72
112 2.21 2.20 1.96 0.89
128 2.70 1.93 2.05 0.76
Table 2 Maximum Normalized Radial Amplitudes of Displacements Among Different Solutions
Epicentral Distances
(km) Generalized Ray By Helmberger (10-4) Wave Integration By Apsel & Luco (10-4) SASSI (10
-4) Ratio of
SASSI /G.R.
32 6.97 7.31 6.63 0.95
48 3.49 4.87 3.77 1.08
64 2.96 3.08 2.51 0.85
80 2.16 2.75 1.80 0.83
96 1.57 2.37 1.37 0.87
112 1.70 1.63 1.32 0.78