DOI: 10.1534/genetics.105.046599
Why Are Phenotypic Mutation Rates Much Higher Than Genotypic
Mutation Rates?
Reinhard Bu
¨rger,*
,†,1Martin Willensdorfer
†and Martin A. Nowak
†*Department of Mathematics, University of Vienna, 1090 Vienna, Austria and†Program for Evolutionary Dynamics, Department of Mathematics and Department of Organismic and Evolutionary Biology, Harvard University, Cambridge, Massachusetts 02138
Manuscript received June 8, 2005 Accepted for publication August 16, 2005
ABSTRACT
The evolution of genotypic mutation rates has been investigated in numerous theoretical and experi-mental studies. Mutations, however, occur not only when copying DNA, but also when building the pheno-type, especially when translating and transcribing DNA to RNA and protein. Here we study the effect of such phenotypic mutations. We find a maximum phenotypic mutation rate,umax, that is compatible with
main-taining a certain function of the organism. This may be called a phenotypic error threshold. In particular, we find a minimum phenotypic mutation rate,umin, with the property that there is (nearly) no selection
pressure to reduce the rate of phenotypic mutations below this value. If there is a cost for lowering the phenotypic mutation rate, thenuminis close to the optimum phenotypic mutation rate that maximizes the
fitness of the organism. In our model, there is selective pressure to decrease the rate of genotypic mutations to zero, but to decrease the rate of phenotypic mutations only to a positive value. Despite its simplicity, our model can explain part of the huge difference between genotypic and phenotypic mutation rates that is observed in nature. The relevant data are summarized.
T
HE evolution of mutation rates by natural selection has attracted the attention of evolutionary biol-ogists for many decades (Sturtevant1937), and a largenumber of models have been developed to understand various aspects of the evolution of mutation rates (Sniegowskiet al.2000). In contrast to the 1930s, a
sub-stantial body of empirical data about mutation rates at many levels (per base pair, per gene, or genomic) and for many different organisms is now available (Drakeet al.
1998). For instance, mutation rates per base pair per replication in microbes with DNA chromosomes range from73107down to731011. There is a strong
neg-ative correlation with the genome size, so that the mu-tation rates per genome differ only by about a factor of two for the organisms cited in Drakeet al.’s (1998)
Table 4. Mutation rates per base pair estimated from specific loci in higher eukaryotes are in the range 23 1010to 531011(Drakeet al.’s 1998 Table 5). Per locus
mutation rates also vary widely, even within an organism, with an approximate range from 104to 106.
In addition to these ‘‘genotypic’’ mutations, organ-isms are also confronted with what we call ‘‘phenotypic’’ mutations. These are the errors that occur when a DNA-coded gene is transcribed to mRNA and subsequently translated to protein. First measurements of phenotypic mutation rates, in particular,Escherichia coliRNA poly-merase error rates, were obtained by Springgate and
Loeb(1975). Soon afterward, Edelmannand Gallant
(1977) measured the cysteine misincorporation rate for theE. coliprotein flagellin. These early studies indicated that phenotypic mutation rates are by orders of magni-tude larger than genotypic mutation rates. Later studies ofE. coli(Ellisand Gallant1982) estimated a global
phenotypic error rate of 4.53104per codon and
con-firmed the difference between phenotypic and geno-typic mutation rates. Studies in yeast yield similar results (Shawet al. 2002). In contrast to genotypic mutation
rates, there does not seem to be a significant difference between eukaryotic and prokaryotic phenotypic mu-tation rates. Several proofreading and quality control mechanisms exist that increase the accuracy of tran-scription and translation (Thomaset al.1998; Ibbaand
So¨ ll 1999; Withey and Friedman 2002). But
appar-ently there is not enough evolutionary pressure to in-crease the accuracy of the transcription and translation apparatus to DNA replication standards.
Apart from the fact that the huge differences between genotypic and phenotypic mutation rates are puzzling, such high phenotypic mutation rates conceivably could pose a problem because the production of functional protein requires the absence of a deleterious mutation event during transcription and translation. Therefore, cells with a higher phenotypic mutation rate must produce more molecules of this protein than cells with a lower rate. If the production of protein is associated with costs, a selective pressure to reduce the phenotypic mutation rate might be expected. The problem may be exacerbated when more genes have to be transcribed
1Corresponding author: Department of Mathematics, University of
Vienna, Nordbergstrasse 15, A-1090 Vienna, Austria. E-mail: [email protected]
and expressed to increase the ‘‘fitness’’ of a cell, or rather of a single-cell organism, above its current value. In modification of Sturtevant(1937), who asked ‘‘Why
does the mutation rate not evolve to zero?’’ we ask ‘‘Why does the phenotypic mutation rate not evolve to lower levels, whereas the genotypic mutation rate has evolved?’’ To address this question, we develop a mathematical model of a large population of single-cell organisms with a DNA chromosome, in which genotypic and phe-notypic mutations occur. All mutations are assumed to be deleterious. For motivation, let us start by inves-tigating the following simple case. Suppose that a cer-tain gene can perform a phenotypic function if at least
kerror-free proteins (actually, molecules of the same protein) have been produced. The function leads to a fitness advantages. If the gene is not transcribed and translated, hence the function not performed, the fit-ness isf0. Each protein molecule that is produced causes
costs c. The probability that a protein is error free is given by 1u. Thus,uis the phenotypic mutation rate. Then, the expected fitness of an organism that produces
mcopies of the protein is given by
f ¼ ðf01sÞP1f0ð1PÞ cm¼f0cm1sP; ð1Þ where
P ¼X
m
i¼k
m
i
ð1uÞiumi
is the probability that generation ofmproteins produces at leastkerror-free proteins.
Taking genotypic mutations of ratemper gene into account and assuming that only genes without a muta-tion can produce funcmuta-tional protein (thus, all mutamuta-tions considered are detrimental), we need
fð1mÞ.f0 ð2Þ
for the gene to be maintained in the population. This is analogous to the classical error threshold that sets an upper limit on the evolutionary acceptable mutation rate (Eigenand Schuster1977; Schusterand Fontana
1999). BecauseP#1, inequality (2) holds if
s.cm1 f0m 1mcm;
where the approximation assumes thatmis small. We note thats, c, m,u, k, and m are parameters that are constant in the cell population but may depend on the given gene. What varies among cells is the actual num-ber of error-free protein molecules produced.
The mean number of error-free molecules produced ism(1u), which needs to be$k. Therefore, we have
s. c0
1u; ð3Þ
wherec0¼ckis the minimum cost in terms of protein
production that is necessary for performing this phe-notypic function. We can rewrite inequality (3) as
u,1c0
s: ð4Þ
This condition specifies a (rough estimate for the) phenotypic error threshold. If the phenotypic mutation rate, u, exceeds this critical value, then the gene that performs this phenotypic function cannot be main-tained in the population by selection alone.
In the following sections, we make this argument more precise by elaborating on a more detailed model that includes an arbitrary number of genes. We show in particular that natural selection leads to phenotypic mutation rates that are much higher than genotypic mutation rates. Specifically, we address (and partially solve) the following questions:
When is it beneficial to transcribe and express a new set of genes that bring about a selective advantage, but production of protein is costly?
What is the optimum number of protein molecules to be produced ifkand the other parameters (genotypic and phenotypic mutation rates, fitness advantage, and costs) are given?
Is there an evolutionary explanation for why phenotypic mutation rates are so much higher than genotypic mutation rates?
What are the consequences of costs associated with higher fidelity of protein production?
THE MODEL
We consider a large population of single-cell organ-isms (cells, for short) with DNA chromosomes. At each locusn(1#n#L) under consideration a numbermn of protein molecules is produced. There is no recom-bination between loci. Errors occur both during DNA replication (i.e., cell division) and during transcription of DNA to RNA and subsequent translation into protein. We call errors of the first kind genotypic mutations and those of the second kind phenotypic mutations. If
mnandundenote the genotypic and phenotypic muta-tion rates at locusn, respectively, thenQ ¼QLn¼1ð1mnÞ is the probability that DNA is produced without error, and
pn;i ¼
m
n i
ð1unÞiumnni ð5Þ
is the probability thatiof themnmolecules produced by genenare error free.
We assume that a certain number of mutation-free protein molecules can increase the fitness of a cell because then a beneficial phenotypic function can be performed, but production of protein has costs. The costs per protein molecule produced by genenarecn. 0. They reduce the fitness of the cell. More precisely, we
assume that every gene, n, must produce at least kn mutation-free copies of the protein so that the fitness of the cell is increased by an amounts.0. If only one of the genes produces less mutation-free protein than required, no such fitness increase occurs. To formalize these assumptions, let i ¼ (i1,. . . ,iL) and denote by fi the fitness of a cell that has in error-free andmn
in erroneous (protein) molecules produced by gene
n (n ¼1,. . .,L) as well as an error-free DNA (at all loci). If we denote the total costs of protein production byctot¼
PL
n¼1cnmn and assume that the costs reduce the fitness of a cell by an additive amount, we obtain for the (Malthusian) fitnesses
fi¼
f01sctot ifkn#in#mn ðn¼1; . . .LÞ f0ctot otherwise:
ð6Þ
Sometimes, it is convenient to writef0¼f0ctot. This
kind of selection involves strong epistasis and is similar to what is called truncation selection in population genetics. Because mutated DNA will always produce mutated RNA, the fitness of cells with mutated DNA is
f0. Throughout, we require thatf0$ 0. Cells that do not express these genes, because they do not exist or are not activated, have fitnessf0.
Letxidenote the relative frequency of cells that have error-free DNA andindenote error-free protein mole-cules from locusn. Further, letybe the frequency of cells whose DNA carries at least one mutation at one of theL
loci. The probability that a cell produces in error-free molecules from each locus n is Ri¼QnL¼1pn;in. We
emphasize that the numbersiof functional molecules produced by an offspring are independent of the numbersjproduced by its parent. Because we assume that the population size is large enough to ignore stochastic fluctuations, it follows that the dynamics of cell frequencies are given by the system of n¼ QL
n¼1mn11 differential equations
_
xi¼QRi
X
j
fjxjfxi; ð7aÞ
_
y¼ ð1QÞX
j
fjxj1f0yfy; ð7bÞ
wheref ¼Pjfjxj1f0yis the mean fitness. We note that
the system of differential equations given by (7a) and (7b) can be written as the replicator equation z_¼ ðAfÞz, wherez¼(x,y) andxhas the componentsxi, and then3nmatrixAhas entriesAij¼QRifj,Ain¼0, Anj¼(1Q)fj, andAnn¼f0.
Let f¼PifiRi. Then, the matrix A has the
eigenvalues
^
f ¼Qf; ð8Þ
f0, and 0, which has multiplicity QL
n¼1mn1. The equilibrium solution corresponding to ^f, the equilib-rium mean fitness, is uniquely determined and locally
stable if and only if^f .f0 or, equivalently, iff.f0=Q. In this case, it attracts all solutions with initial valuey.0 because (7a) and (7b) are equivalent to the linear systemz_¼Az(Thompsonand McBride1974; Bu¨ rger
2000). The equilibrium frequencies of cell types are readily shown to be
^
xi¼Ri
Qff0
f f0 ; ^y¼
ð1QÞf
f f0 : ð9Þ
If f# f0, then all solutions converge to y ¼ 1. This occurs, for instance, ifs¼0.
Let Pnð¼Pnðmn;kn;unÞÞ ¼Pminn¼knpn;in denote the
probability that in a cell at leastknmolecules produced by genenare error free. Because these are precisely the cells with fitnessf01sand
P
i$kRi¼
QL
n¼1Pn, where i$kmeansin$knfor alln, we obtain
f ¼ ðf01sÞY
L
n¼1
Pn1f0 1
YL
n¼1
Pn !
¼f01sY L
n¼1
Pn:
ð10Þ
Formula (10) forf, hence an explicit expression for the mean fitness ^f, could have been derived without resorting to the full dynamics (7). However, uniqueness and global stability of the corresponding solution can be inferred only from the complete evolutionary dynamics.
RESULTS
Our first aim is to determine conditions under which a set of genes, with the properties set out above, increases the fitness of a cell relative to one in which this set of genes does not exist or is not transcribed. Such a cell is assumed to have fitnessf0because no costs
from protein production occur. A population of such cells sets the standard,f0, to which^f has to be compared.
For an analytical treatment we assume that all loci are equivalent;i.e.,cn[c,mn[m,kn[k,un[u, for alln. Therefore, we have ctot ¼ cLm and f0 ¼ f0 cLm.
Furthermore, if we denote byP[Pnthe probability that at least k error-free protein molecules per gene are produced, we have
P ¼X
m
i¼k
pi; ð11Þ
where
pi¼
m
i
ð1uÞiumi: ð12Þ
It follows from (10) that
f ¼f0cLm1sPL; ð13Þ
which generalizes (1), and from (8) that
^
f ¼ ð1mÞL½f
A population of single-cell organisms that transcribe and translate the set of genes under consideration has an increased equilibrium mean fitness relative to one that does not produce this protein if and only if
^
f .f0: ð15Þ
This generalizes (2). Condition (15) imposes a number of restrictions on the parameters of our model, which we explore next. Figures 1 and 2 show how the equilibrium mean fitness^f depends on various parameters.
Figure 1 displaysf^as a bivariate function ofmandu. More precisely, it shows maxð^f;1Þto clearly display the parameter combinations that confer a fitness advan-tage to the population (in the figures, f0 ¼ 1). Most
distinctive is the steep ‘‘wall’’ surrounding the ‘‘mesa-like mountain.’’ It signifies a threshold-‘‘mesa-like increase of^f
asmincreases above a critical value orudecreases below a critical value. For each givenu, there is a valuemthat maximizes^f (seeThe optimum number of protein molecules). The linear decrease of ^f in m is caused by the costs, which are proportional tocm. Ifmis too large [in this case m $ 1996, cf. (16)], then ^f ,f0¼1. Moreover,
there is a maximum value ofu, above which^f ,1 for everym. Its value is0.73; see (20).
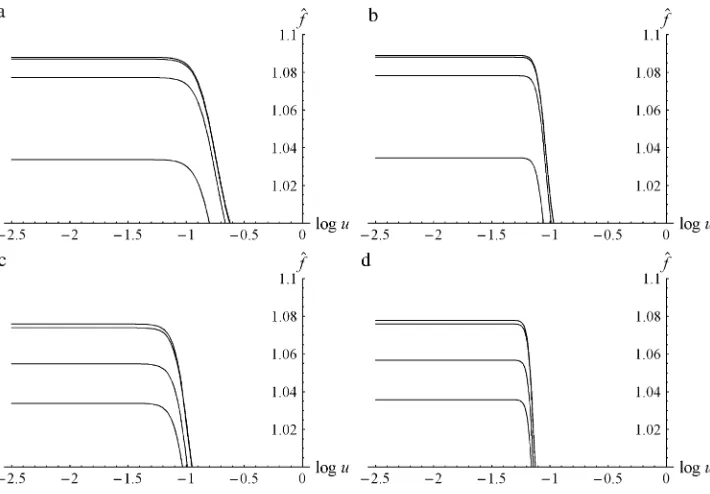
Figure 2 displays^f as a function of log10ufor several
different parameter combinations. The threshold-like dependence on u is distinctive, as is the fact that ^f is effectively constant for values ofubelow the threshold. This is investigated and explained inSelection on mutation rates.
Error thresholds and other necessary conditions for performing an advantageous function:From inequality (15), simple conditions for some of the parameters can be derived that must be satisfied so that incorporating or maintaining a set of genes may confer a fitness advan-tage to the population. Because we always haveP #1, the following simple upper bound for m is easily deduced from (15) and (14) by settingP¼1:
m#sf0½ð1mÞ
L1
cL : ð16Þ
For givenk, the inequality
s$f0½ð1mÞL11cLkf0ðemL1Þ1cLk ð17Þ must be satisfied independently ofubecausem$k. The approximation is valid ifLm2>1. For smaller values ofs,
there is no parameter combination that provides a selective advantage to a single-cell population with these
Figure1.—Equilibrium mean fitness,^f, as a bivariate func-tion ofm(400#m#2000) andu(0#u#1). The other parameters have the following values:f0¼ 1,m ¼104, s¼
0.5,k¼500,c¼0.000025,L¼10. The largesis chosen to obtain a distinctive display of the features of this function.
Figure 2.—Equilibrium mean
fitness, ^f, as a function of the (decadic) logarithm of the phe-notypic mutation rate, log10u. (a) L¼ 1,k¼ 50, m¼ 60,c ¼23 104; (b) L ¼ 1, k ¼ 500, m ¼ 550, c ¼ 2 3 105; (c) L ¼ 20, k ¼ 50, m ¼ 60, c ¼ 2 3 104; and (d)L ¼ 20, k ¼ 500, m ¼
550, c ¼ 2 3 105. (a and b) The curves (from top to bottom) are form¼ 104, m¼ 103, m¼ 102, and m¼ 53 102. (c and d) The curves are form ¼ 105, m¼104,m¼103, andm¼23 103. (a–d)f
0¼1 ands¼0.1.
genes activated. A simpler, but less accurate, estimate than (17) for the necessary selective advantage is
s$Lðf0m1ckÞ: ð18Þ
This complements (3), which has been derived under different assumptions. Condition (17) can be easily re-formulated to obtain an upper bound on the tolerable costs of producing a protein molecule.
By simple rearrangement of (14), we obtain from (15) the following upper bound on the genotypic mutation rate per gene:
m # mET¼1 f0
f0cLm1sPL
1=L
: ð19Þ
This may be called a genotypic error threshold. We note thatmET#1(11s/f0)1/Land the right-hand side is
attained ifu¼0 (henceP¼1) andc¼0.
No such simple and precise formula exists for the phenotypic error threshold becausePis a complicated function ofuandm(but seeSelection on mutation rates). However, an upper bound on the phenotypic mutation rateuper gene can be derived, above which the mean fitness of a cell population is less thanf0for everym. It is
given by
umax 1
cL sf0m
ðk1212pffiffiffiffiffiffiffiffiffiffiffik11Þ ð20Þ
(seeappendix a) and is more precise than the simple
estimate (4) for the phenotypic error threshold derived in the Introduction. Obviously, a set of genes that con-fers a higher selective advantage can be incorporated and maintained under much higher phenotypic muta-tion rates and costs than a set of genes conferring a lower advantage. The approximation (20) is very accu-rate for a single gene (L¼1) and is a slight overestimate, on the order of a few percent, if L . 1 (results not shown). We remark that our usage of the term ‘‘pheno-typic error threshold’’ deviates from that of Schuster
and Fontana(1999).
The optimum number of protein molecules:Figure 1 shows that for a given phenotypic mutation rateu, there is an optimum number,mopt, of molecules to be
pro-duced. Indeed, this is intuitive because in the absence of phenotypic mutation,m¼kmolecules should be pro-duced to minimize the costs. With phenotypic mutation,
k or more molecules have to produced to obtain a correctly expressed gene. We can restrict attention to phenotypic mutation ratesu,umax. Since we have^f ¼ Qfby (8), and because Q is independent of m, it is sufficient to find themthat maximizesf.
Let us first assumeuk>1. Then the binomial distri-bution (12) can be approximated by a Poisson distribu-tion with meanm(1u), and we obtain from (13)
f ¼ f0cLk1sð1LkuÞ1Oðk2u2Þ; ifm¼k;
f0cLðk11Þ1s1Oðk2u2Þ; ifm¼k11:
ð21Þ
By comparing these two cases, it follows immediately thatfassumes its maximum atm¼kifuk,c/s. [Note that (17) implies thatc=s>1 ifk?1, so the assumption
uk>1 is automatically satisfied if a set of genes can be added at all andk?1.] Thus, for very small phenotypic mutation rates the fitness is maximized atm¼k.
Ifuis sufficiently large, the binomial distribution (12) can be approximated by a normal distribution. [This is accurate for all possiblemifku(1u)$5.] Then the very accurate approximation
mopt ¼k1
uk1pffiffiffiffiffiffiukpffiffiffiffiffiffiffiffiffiffiffiffiffiffiffi2 lna
1u ð22Þ
for the optimum mis found, where a¼2ðc=sÞ=pffiffiffiffiffiffiffiffiffipuk
(appendix b). In particular, the truemoptis always.k/
(1u). Figure 3 displays mopt/kas a function ofkfor
various parameter combinations. Figure 3 and (22) demonstrate that the optimum number of protein molecules to be produced is only slightly larger thank, unless u is very high ork very small. In fact, we have limk/‘mopt=k¼1=ð1uÞ;cf.the Introduction, before
Equation 3. The convergence, however, is slow so thatk
must be on the order of a few hundred that 1/(1u) becomes an accurate approximation formopt. It is also
important to note that mopt is independent of L and
depends only very weakly oncands; largerc/sslightly decreases mopt. The mean fitness ^f at mopt, however,
depends strongly on L, s, and c. Even though the derivation of (22) assumesku(1u)$5, (22) remains accurate ifuk,1 and correctly predicts thatmopt/k
asu/0. Additional numerical results (not presented) show that the relative error of the approximation (22) rarely exceeds 5% and often is much lower. Finally, we point out that the minimum possible mis only slightly smaller than the optimummgiven by (22); this is best seen from Figure 1.
Selection on mutation rates: Here, we explore how the equilibrium mean fitness^f depends on the genotypic
Figure 3.—Ratio of optimum number to minimum
re-quired number of protein molecules,mopt/k(22), as a
func-tion of k. Dashed curves, c/s ¼ 0.0005; solid curves, c/s ¼
and phenotypic mutation rates. The dependence of^f
on the genotypic mutation rate is very simple because it is proportional to (1m)L. Therefore, the larger the
number of genes involved, the more advantageous is a low genotypic mutation rate. Even for a single gene, there is significant selection for reducing the genotypic mutation rate well below 102in any cell population of
size 103or higher because selection dominates random
genetic drift if population size times selective advantage exceeds10. WithL¼20 genes, we have (1m)20#
0.99 ifm $53104. Thus, in cell populations of size as
small as 103there is already significant selection
pres-sure for reducing the mutation rate below 53104.
In contrast, for the phenotypic mutation rate, there is hardly any selection pressure to reduce it to such low levels (even in extremely large populations). Indeed, Figure 2 shows that the equilibrium mean fitness be-comes nearly independent ofuasu gets smaller than
101. There are two reasons for this. First, a reduction
in genotypic mutation rate affects fitness in a structur-ally different way than a reduction in phenotypic mu-tation rate. In general, the fitness increase caused by a reduction in m is only weakly dependent on s be-cause it is proportional to the (typically) much larger term f0. However, fitness changes induced by u are
always proportional tosbecause they enter ^f through changes in P, the probability that at least kerror-free proteins are produced; see Equation 14. The second reason is thatPLhas a sigmoid, often nearly
threshold-like, shape. The cumulative binomial density P is extremely close to its maximum value 1 if the mean number of correctly produced molecules, m(1 u), exceedskby only a few standard deviations. Hence, ifm
is sufficiently large so that the binomial distribution can be approximated by a Gaussian, then^f approaches its maximum value asu/0 approximately as fast asex2
approaches zero asx/‘.
A simple explicit, but approximate, expression for the minimal mutation rate below which ^f is nearly independent ofucan be obtained by approximating the binomial cumulative probabilityPby a Gaussian. To this aim, letqbe a small positive number and letddenote the (1q)1/L
quantile of the standard normal distribu-tion. Then, we have 1 q # PL # 1 if
mð1uÞ$ k1dpffiffiffiffiffiffiffiffiffiffiffiffiffiffiffiffiffiffiffiffiffiffimuð1uÞ. Solving foruyields
umin¼
d212ðmkÞ dpdffiffiffiffiffiffiffiffiffiffiffiffiffiffiffiffiffiffiffiffiffiffiffiffiffiffiffiffiffiffiffiffiffiffiffiffi214kð1k=mÞ
2ðd21mÞ : ð23Þ
We call this the minimum phenotypic mutation rate, because selection will be unable to reduceubelowumin,
unless the population size is much larger than (sq)1.
Notably,uminis independent ofsandc, except indirectly
if the choice ofqis made conditional ons. [The reader should not be worried by the fact that the derivation of (23) does not assume^f .f0. If^f ,f0 for all u, for
in-stance, becausesis too small orctoo large, then there
will be no selection pressure at all to reduceubecause activating the set of genes automatically leads to a fitness disadvantage.]
Figure 4 displaysuminfor a single gene as a function of kfor several parameter combinations. It shows thatumin
is very small only if either kis very small or mis only slightly larger thank. The lattera priorirequires small phenotypic mutation rates. It is also of interest to note that if we assume thatmis a fixed multiple ofk,i.e.,m¼ ak, and letktend to infinity, then limk/‘umin¼11=a
andumin# 11/a. Thus, if many more proteins are
produced than required (a large), then umin will be
close to 1 if kis large. If, on the other hand,mis not much larger thank[as suggested by expression (22) for the optimal m], thenumin will be relatively small. For
example, ifa¼1.2 as in some of the graphs in Figures 4 and 5, then 11=a¼1
6. These considerations strongly suggest that, on the basis of our model, smaller pheno-typic mutation rates are not likely to evolve. It is also notable, although obvious from the derivation, how weaklyumindepends onqand how much larger thansq
it is under most conditions. The latter is important because for a single gene the correspondingmminwould
besq. Hence,mmin>umin. ForLgenes,mminwould be
correspondingly lower,i.e.,mmin¼1(1sq)1/L
. The above argument, that the selective pressure to reduce the phenotypic mutation rate belowuminis less
thansq, depends on the assumption thatmis given and constant. It does not, however, involve any costs for re-ducing the mutation rate. Such costs are investigated below. Theoretically, the phenotypic mutation rate could evolve to zero, or at least to much lower levels than given byumin, ifmandu could be optimized simultaneously.
This can be seen from Figure 1 and would correspond to evolution along the top of the (curved) ridge. Substantial bivariate optimization, and evolution to very low values of
u, does not appear to be a very likely scenario because it would require extreme fine tuning ofmandu. If, for given
u,mis only slightly larger thanmopt¼mopt(u) (2% is
sufficient), then the selective advantage to reduceu is
Figure4.—Minimum phenotypic mutation rate,umin, as a
function ofkfor a single locus (L¼1). Solid lines,q¼103; dashed lines,q¼106. The three pairs of lines differ inm;i.e., from top to bottom,m¼2k,m¼1.5k, andm¼1.2k. The three short lines on the right-hand side indicate limk/‘umin.
already vanishingly small (the population is on the gentle slope, which is completely flat in the direction of in-creasingu). If, in contrast, only a few protein molecules less thanmopt are produced, then the fitness decrease
is substantial (the population ‘‘drops off the steep wall’’). It seems questionable if mechanisms for the required simultaneous fine tuning of bothmanduexist, in par-ticular, becausemoptis a population property, not a
prop-erty of the cell. It would require that a cell knows exactly quite how many error-free molecules it produces.
The critical mutation rate: We have already derived an approximation for the phenotypic error threshold,
i.e., the maximum mutation rateumaxabove which the
set of genes cannot be maintained. Here we take a closer look at the distinctive threshold-like dependence of^f on
u(Figure 2) and investigate how it depends onmand the other parameters. This threshold-like dependence is a characteristic feature of our model and has a simple explanation. Let us approximate P by the Gaussian cumulative distribution function with meanm(1 u) and variancemu(1u). Then,Pswitches from a value close to 0 to a value close to 1 near the meanm(1u). This transition occurs within about two standard devia-tions of the mean. For a single gene, this implies that the transition occurs ifm(1u)k, whenceu1k/m
follows. For the parameter values of Figure 2, a and b, this yieldsu0.17, or log10u 0.78, a reasonably good
approximation to the critical valueucritdefined as the
solution of^f ¼f0. If there is more than one gene, then
the transition occurs near P 1 2
1=L
and becomes sharper asLincreases. ApproximatingP by the corre-sponding Gaussian cumulative distribution, i.e., P FG ðmð1uÞ kÞ=
ffiffiffiffiffiffiffiffiffiffiffiffiffiffiffiffiffiffiffiffiffiffiffiffi
2muð1uÞ p
, where FGðxÞ ¼
1
2ðerfðxÞ11Þ, we obtain the critical valueucritby solving
erf mðffiffiffiffiffiffiffiffiffiffiffiffiffiffiffiffiffiffiffiffiffiffiffiffi1uÞ k
2muð1uÞ p
!
¼2 1
2
1=L
1: ð24Þ
For the parameters of Figure 2c, this yields log10u ¼ 0.94; for Figure 2d, it yields log10u ¼ 1.01.
Appar-ently, both values are a reasonably good approximations for the trueucrit.
Figure 5 displays the critical phenotypic mutation rate
ucrit (solid lines), calculated numerically by solving
^
f ¼f0, for four selective coefficients as a function ofk,
and compares it with the minimum phenotypic muta-tion rateumin(dashed lines), calculated for two choices
ofq. For the two smaller values ofs, the curves forucrit
end when^f ,f0¼1,i.e., when expression of the set of
genes causes a fitness reduction for allu.
The role of costs for reducing the phenotypic mu-tation rate:So far, all arguments have assumed that no costs are associated with lower mutation rates. Here, we briefly explore the consequences of such costs. To illus-trate the (quite obvious) effects, let us assume that the cost of producing a single protein molecule isc(11g/u), whereg $0.
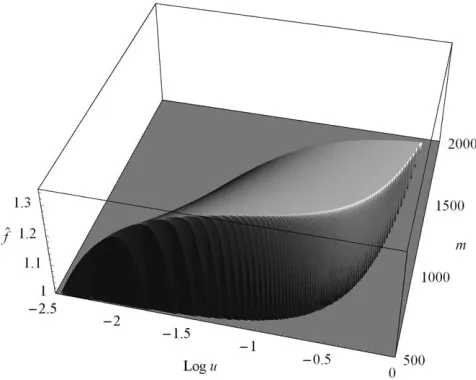
Figure 6 displays the mean equilibrium fitness ^f as function of log10uandmwithg¼0.01. Thus, the costs
Figure 5.—Critical
pheno-typic mutation rate,ucrit(solid
lines), and minimum pheno-typic mutation rate, umin
(dashed lines), as a function of k. (a)L¼1; (b)L¼10. The pa-rametersm¼104,L¼1,c¼ 104, andm¼1.2kare the same for all curves. Forucrit(from top
to bottom),s¼0.5,s¼0.1,s¼
0.02, ands¼0.01.uminis
inde-pendent of s, m, and c. Top dashed line,q¼ 103; bottom dashed line,q¼105. Note that for the corresponding parame-ter combinations,ucritbecomes
negative where the lines end.
Figure6.—Equilibrium mean fitness,^f, as a bivariate func-tion ofm(500#m#2000) and log10u(2.5#log10u#0)
for costly small phenotypic mutation rates. The costs arec¼
are slowly increasing with decreasingu. Withg¼0 there are no costs for reducing the phenotypic mutation rate and Figure 1 would be obtained (except for the dif-ferent scaling of theu-axis). The fitness optimum is near (m,u)¼(571, 0.0805) with^f ¼1:338 (log100.0805 ¼ 1.094). We note that 0.0805 is close toumin(m¼571, k¼500,q¼104)¼0.0817.
If the costs increase is even slower, for instance logarithmic, then the optimal u is somewhat smaller (results not shown). In the presence of costs, most of the quantities derived above are much more difficult to compute, and we have not developed an analytical theory that takes into account costs for fidelity.
DISCUSSION
In this work we argue that there is very little selective pressure to reduce the phenotypic mutation rate u
below a minimum mutation rateumin. Usually,
transcrip-tional and translatranscrip-tional error rates are measured in number of amino acid substitutions per synthesized amino acid and were estimated to be 4.53104(Ellis
and Gallant1982). For this theory, however, we want to
know the number of nonfunctional proteins per syn-thesized protein. This is our unit for the phenotypic mutation rateu. For a proper unit conversion we need to know how many amino acid substitutions per protein occur and how many of these substitutions lead to non-functional proteins.
The average protein lengths forE. coli,Saccharomyces cerevisiae, andHomo sapiensare 317, 496, and 499 amino acids, respectively. Let us be conservative and use 500 for the average protein length. For a 500-amino-acid long protein and a phenotypic mutation rate of 4.53 104
mistranslations per amino acid, we will have0.23 in-correctly synthesized proteins per synthesized protein. However, only a fraction of these 23% will carry amino acid substitutions that render them nonfunctional.
Exhaustive amino acid substitution assays on HIV-1 protease (Loebet al.1989), T4 lysozyme (Rennellet al.
1991), and Lac repressors (Markiewicz et al. 1994)
showed that 59, 12, and 34% of the examined amino acid substitutions were deleterious (summarized in Saunders and Baker’s 2002 Table 1). If we choose
35%, the average of these three values, as the fraction of amino acid substitutions that are deleterious, we have a phenotypic mutation rate of 0.08 deleterious mutations per synthesized protein.
Because a substantial fraction, if not the vast majority, of genotypic mutations are detrimental (Keightley
and Eyre-Walker1999; Keightleyand Lynch2003),
deleterious per-locus mutation rates can be expected to be between 104and 107(see Introduction), where the
upper bound is likely to be an overestimate. In any case, deleterious genotypic mutation rates are several orders of magnitude smaller than phenotypic ones.
In addition to the (deleterious) phenotypic mutation rate we also have to consider the number of protein molecules produced per cell. Early studies showed that only a few hundred proteins account for most of the protein content of a cell and that most of the proteins are present in low copy numbers (O’Farrell 1975).
Low copy numbers range from a few proteins per cell to several hundred. For instance, the Lac repressor, a regulatory protein, is thought to be ‘‘occurring in about ten copies per gene’’ (Gilbertand Muller-Hill1966). E. coliDNA photolyase, a DNA repair enzyme, has a copy number of10–20 molecules per protein (Harmet al.
1968). High copy number proteins can have abundances of many thousand molecules per cell (Gygiet al.1999).
A recent study shows that the costs associated with the production of protein may be substantial, and that they increase faster than linear with the amount of protein produced (Dekeland Alon2005).
Our main results are, first, that there is basically no selective pressure to reduce the phenotypic mutation rate per gene below a minimum value, umin, which is
rarely ,0.05, and often near 0.1. This compares sur-prisingly well with the 8% deleterious mutations per synthesized protein calculated above.
In contrast, and despite the simplicity of the model, there is selective pressure to reduce the genotypic mu-tation rate to much lower levels, one order of magnitude at least. If several genes have to be expressed to increase fitness, the difference becomes larger. Second, for given parameters, there is a critical phenotypic mutation rate,
ucrit, above which the fitness of the population is actually
reduced if the set of genes is expressed. Unless the potential fitness increase,s, is very high relative to the costs,c, andkvery small,uminis not much smaller than ucrit, in particular, if several genes are involved. Both uminanducritdepend only very weakly on cand s. No
simple formulas for ucrit and umin are available. Their
(approximate) calculation involves computation of quan-tiles of the normal distribution. However, and this is the third result, there is a simple formula for the maximum phenotypic mutation rate, umax, above which there is
a fitness disadvantage for expressing the genes under consideration for any number m of actually produced protein molecules. This can be interpreted as a pheno-typic error threshold. Unlesskc/sis very small ormis only slightly larger thank,umaxdiffers fromuminby less than a
factor of 10. Fourth, we show that for all other parameters given there exists an optimum number of protein mole-cules to be produced,mopt, in the sense that the mean
fitness of the population is maximized. We derive a simple and very accurate approximation for mopt. Unless the
phenotypic mutation rate is very high orkis small,moptis
not much larger thankand nearly independent of the selective advantage and the costs. It is independent of the number of loci and of the genotypic mutation rate.
The formal reason for the absence of a selective pressure to reduce the phenotypic mutation rate to such
low levels as that of the genotypic mutation rate is that the two types of mutation rates enter mean fitness,^f in (14), in qualitatively different ways; this is discussed in
Selection on mutation rates. A more intuitive reason is that as soon as only a few more than the optimum number,
mopt, of protein molecules are produced, the selective
pressure to reduce the phenotypic mutation rate van-ishes because the function can be fulfilled anyway. In such a situation, there is, however, weak selective pres-sure to reduce the number of actually produced mole-culesmtomopt. In principle, simultaneous evolution of manducould lead to much lower phenotypic mutation rates. However, as argued inSelection on mutation rates
this would require extreme fine tuning of these pro-cesses (in particular, m has to be adjusted extremely closely tomopt) and, thus, seems unlikely. This, together
with the role of genetic drift, will be the topic of future investigation.
The above results do not involve any costs for re-ducing the phenotypic or genotypic mutation rate. If there are costs for reducing the phenotypic mutation rate, the parameter range in which a fitness advantage can be realized by incorporating the set of genes is substantially reduced (or even annihilated if the costs are too high), and fitness is maximized at an interme-diate phenotypic mutation rate. Unless the costs are high, this maximum is close toumin, as given by (23).
Our model, hence the conclusions, rests on a number of assumptions. We assumed that, if there is more than one locus, all loci are completely equivalent. In reality, this will not be the case because loci can differ in any of the parameters. It appears to be of most interest to study cases in which the number of required error-free protein molecules,k, and the actually produced number,m, vary among loci. We have not yet studied such a scenario.
Our most critical assumption concerns the depen-dence of fitness on the number of protein molecules produced. Many fitness functions other than our step-like function (6) are conceivable. For instance, fitness could increase smoothly as the number of error-free proteins increases. We have not studied such a scenario. However, it appears quite reasonable to assume that the performance of a, at least moderately complex, function requires many genes to interact in an appropriate man-ner. There may be many possibilities of modeling such gene interaction, but none has been studied in the pres-ent context.
The following example shows that there are fitness functions that can induce strong selection toward low phenotypic mutation rates. Assume that k error-free proteins are needed to increase fitness bys, but that cells that produce one or more erroneous molecules do not have this fitness advantage. Also assume, as in our model, costscfor producing a protein molecule. Then using the previous notation, we have
f ¼ ðf01sÞð1uÞk1f0½1 ð1uÞk ck; ð25Þ
and a (mean) fitness advantage results if f.f0. It is
trivial to show that this yields the condition
u,1 ck
s 1=k
1
kln s
ck; ð26Þ
where the approximation requires sufficiently large k. Obviously, this is very different fromumax;cf.(20) and
(4). If, with this type of fitness function, there are costs associated with the reduction of the phenotypic muta-tion rate, the incorporamuta-tion or maintenance of a set of genes that confers a fitness advantage becomes very difficult because the admissible parameter range shrinks dramatically. We do not argue that such a fitness func-tion is realistic in any sense; by contrast, fitness funcfunc-tions like this would make any functional improvement dif-ficult or impossible. Of course, there are many other reasonable fitness functions that could and should be studied; for instance, fitness could be reduced steadily if too many erroneous proteins are produced. Such studies have to be postponed to the future.
The Program of Evolutionary Dynamics is supported by Jeffrey Epstein.
LITERATURE CITED
Bu¨ rger, R., 2000 The Mathematical Theory of Selection, Recombination,
and Mutation.Wiley, Chichester, UK.
Dekel, E., and U. Alon, 2005 Optimality and evolutionary tuning of
the expression level in protein. Nature436:588–592.
Drake, J. W., B. Charlesworth, D. Charlesworthand J. F. Crow,
1998 Rates of spontaneous mutation. Genetics148:1667–1686. Edelmann, P., and J. Gallant, 1977 Mistranslation inE. coli.Cell
10:131–137.
Eigen, M., and P. Schuster, 1977 The hypercycle: a principle of
natural self-organization. A. emergence of the hypercycle. Natur-wissenschaften64:541–565.
Ellis, N., and J. Gallant, 1982 An estimate of the global error
fre-quency in translation. Mol. Gen. Genet.188:169–172. Gilbert, W., and B. Muller-Hill, 1966 Isolation of the Lac
repres-sor. Proc. Natl. Acad. Sci. USA56:1891–1898.
Gygi, S. P., Y. Rochon, B. R. Franzaand R. Aebersold, 1999
Cor-relation between protein and mRNA abundance in yeast. Mol. Cell. Biol.19:1720–1730.
Harm, W., H. Harmand C. S. Rupert, 1968 Analysis of
photoenzy-matic repair of UV lesions in DNA by single light flashes. II. In vivo studies withEscherichia colicells and bacteriophage. Mutat. Res.6:371–385.
Ibba, M., and D. So¨ ll, 1999 Quality control mechanisms during
translation. Science286:1893–1897.
Keightley, P. D., and A. Eyre-Walker, 1999 Terumi Mukai and the
riddle of deleterious mutation rates. Genetics153:515–523. Keightley, P. D., and M. Lynch, 2003 Toward a realistic model of
mutations affecting fitness. Evolution57:683–685.
Loeb, D. D., R. Swanstrom, L. Everitt, M. Manchester, S. E.
Stamperet al., 1989 Complete mutagenesis of the HIV-1
prote-ase. Nature340:397–400.
Markiewicz, P., L. G. Kleina, C. Cruz, S. Ehretand J. H. Miller,
1994 Genetic studies of the lac repressor. XIV. Analysis of 4000 altered Escherichia coli lac repressors reveals essential and non-essential residues, as well as ‘‘spacers’’ which do not require a spe-cific sequence. J. Mol. Biol.240:421–433.
O’Farrell, P. H., 1975 High resolution two-dimensional
electro-phoresis of proteins. J. Biol. Chem.250:4007–4021.
Rennell, D., S. E. Bouvier, L. W. Hardyand A. R. Poteete, 1991
Saunders, C. T., and D. Baker, 2002 Evaluation of structural and
evolutionary contributions to deleterious mutation prediction. J. Mol. Biol.322:891–901.
Schuster, P., and W. Fontana, 1999 Chance and necessity in
evo-lution: lessons from RNA. Physica D133:427–452.
Shaw, R. J., N. D. Bonawitzand D. Reines, 2002 Use of an in vivo
reporter assay to test for transcriptional and translational fidelity in yeast. J. Biol. Chem.277:24420–24426.
Sniegowski, P. D., P. J. Gerrish, T. Johnson and A. Shaver,
2000 The evolution of mutation rates: separating causes from consequences. BioEssays22:1057–1066.
Springgate, C. F., and L. A. Loeb, 1975 On the fidelity of
transcrip-tion by Escherichia coli ribonucleic acid polymerase. J. Mol. Biol. 97:577–591.
Sturtevant, A. H., 1937 Essays on evolution. I. On the effects of
selection on mutation rate. Q. Rev. Biol.12:467–477.
Thomas, M. J., A. A. Platas and D. K. Hawley, 1998
Tran-scriptional fidelity and proofreading by RNA polymerase II. Cell 93:627–637.
Thompson, C. J., and J. L. McBride, 1974 On Eigen’s theory of the
self-organization of matter and the evolution of biological macro-molecules. Math. Biosci.21:127–142.
Withey, J. H., and D. I. Friedman, 2002 The biological roles of
trans-translation. Curr. Opin. Microbiol.5:154–159.
Communicating editor: M. K. Uyenoyama
APPENDIX A
Here, we derive an upper bound on the phenotypic mutation rate above which (15) cannot be satisfied. Let us assumeL¼1. Then a simple calculation reveals that (15) is equivalent to
P.f0m1ð1mÞcm
sð1mÞ : ðA1Þ
No general explicit approximation for P is available. However, P can be approximated by the cumulative density function of the normal distribution with mean
m(1u) and variancemu(1u). Therefore,P¼P(m,k,
u) is close to 1 ($0.97) ifmð1uÞ$k12pffiffiffiffiffiffiffiffiffiffiffiffiffiffiffiffiffiffiffiffiffiffimuð1uÞ
and starts to decline rapidly asmbecomes smaller. The inequality mð1uÞ$k12pffiffiffiffiffiffiffiffiffiffiffiffiffiffiffiffiffiffiffiffiffiffimuð1uÞ is satisfied if and only if
m$m*¼
k12u12pffiffiffiffiffiffiffiffiffiffiffiffiffiffiffiffiffiffiuðk1uÞ
1u : ðA2Þ
If we approximate the left-hand side of (A1) byP¼1 and the right-hand side by (cm* 1 f0m)/s [which is
accurate to orderO(m)], we obtain the desired (approx-imate) upper bound by solving
1¼cm*1f0m
s ðA3Þ
foru. This yields
umax
sf0mcðk2Þ 2c
ffiffiffiffiffiffiffiffiffiffiffiffiffiffiffiffiffiffiffiffiffiffiffiffiffiffiffiffiffiffiffiffiffiffiffiffiffiffiffiffiffiffiffi k11ck2=ðsf0mÞ
p
sf0m14c
:
ðA4Þ
Numerical evaluation of the true upper bound shows that this provides an excellent approximation ifk$10. By ignoring terms of orderc2and higher, we obtain (20).
In general, (20) is nearly as good as (A4), but slightly smaller. A similar procedure yields (20) ifL.1.
APPENDIX B
Here, we derive the approximation (22) for the optimum number m of protein molecules to be pro-duced. Ifuis sufficiently large,i.e., ifmu(1u)$5, then the binomial distribution (12) can be accurately ap-proximated by a normal distribution. By partial differ-entiation off(13) with respect tomwe obtain that the fitness is maximized at the largest solutionmof
k1mð1uÞ
mpffiffiffiffiffiffiffiffiffiffiffiffiffiffiffiffiffiffiffiffiffiffiffiffi2muð1uÞexpðA
2Þ½1erfðAÞL1¼2Lc
ffiffiffiffi p p
s ;
ðB1Þ
where
A¼ kffiffiffiffiffiffiffiffiffiffiffiffiffiffiffiffiffiffiffiffiffiffiffiffimð1uÞ
2muð1uÞ
p : ðB2Þ
If A # 2, which is satisfied if (approximately) m$ ðk12pffiffiffiffiffikuÞ=ð1uÞ, we have erf(A)#0.995, and the terms [1erf(A)]L1and 2L1cancel.
Because of the rapid decline of exp(A2) form.k,
we can approximateðk1mð1uÞÞ=mpffiffiffiffiffiffiffiffiffiffiffiffiffiffiffiffiffiffiffiffiffiffiffiffi2muð1uÞby (ku)1/2and obtain an excellent approximation for the
solution of (B1) by solving exp(A2)¼aform, where a¼2cpffiffiffiffiffiffiffiffiffipuk=s. Ignoring terms of order u/k and smaller, we arrive at (22).