DOI: 10.1534/genetics.105.049353
Genomic Survey of Gene Expression Diversity in
Arabidopsis thaliana
Daniel J. Kliebenstein,*
,1Marilyn A. L. West,*
,1Hans van Leeuwen,* Kyunga Kim,
†R. W. Doerge,
†Richard W. Michelmore*
,‡and Dina A. St. Clair*
,2*Department of Plant Sciences, University of California, Davis, California 95616-8780,†Department of Statistics, Purdue University, West Lafayette, Indiana 47907-2067 and‡The Genome Center, University of California, Davis, California 95616
Manuscript received August 12, 2005 Accepted for publication September 27, 2005
ABSTRACT
Differential gene expression controls variation in numerous plant traits, such as flowering time and plant/ pest interactions, but little is known about the genomic distribution of the determinants of transcript levels and their associated variation. Affymetrix ATH1 GeneChip microarrays representing 22,810 genes were used to survey the transcriptome of seven Arabidopsis thaliana accessions in the presence and absence of exogenously applied salicylic acid (SA). These accessions encompassed80% of the moderate- to high-frequency nucleotide polymorphisms in Arabidopsis. A factorial design, consisting of three biological replicates per accession for the two treatments at three time points (4, 28, and 52 hr post-treatment), and a total of 126 microarrays were used. Between any pair of Arabidopsis accessions, we detected on average 2234 genes (ranging from 1428 to 3334) that were significantly differentially expressed under the conditions of this experiment, using a split-plot analysis of variance. Upward of 6433 genes were differentially expressed between at least one pair of accessions. These results suggest that analysis of additional genetic, developmental, and environmental conditions may show that a significant fraction of the Arabidopsis genome is differentially expressed. Examination of sequence diversity demonstrated a significant positive association with diversity in gene expression.
N
ATURAL phenotypic variation is often quantita-tively distributed and occurs in both simple and complex traits. DNA sequence polymorphisms can be a primary genetic cause of phenotypic variation in popula-tions. Some recent studies have assessed genomewide DNA sequence variation within and between different species (Gibbset al.2003; Schmidet al.2003, 2005; Steinet al.2003; Bentleyand Parkhill2004; Nordborget al.,
2005). These studies identified variation throughout the genome, including single-nucleotide and INDEL polymor-phisms in all gene components: promoter, UTRs, ORFs, and introns. However, cataloging of sequence variation is only the first step in understanding how DNA variation contributes to phenotypic variation. Recent advances in technology have enabled comparative studies that focus on the variation present in the transcriptome, metab-olome, and proteome. Recent work comparing sequence divergence to expression divergence between two Dro-sophila species found little evidence for a correlation between the two measures of divergence (Nuzhdinet al.
2004). Understanding how variation in these intermediate processes is correlated will aid in linking DNA sequence polymorphism to its phenotypic consequences.
Differences in gene expression, termed expression level polymorphisms (ELPs) (Doerge2002), have been
shown to control inter- and intraspecific phenotypic var-iation in various organisms (Wanget al.1999; Carrol
2000; Brem et al.2002). In plants, naturally occurring
ELPs have been associated with changes during maize domestication (Wanget al.1999), flowering-time
con-trol in Arabidopsis (Johansonet al.2000; Caicedoet al.
2004; Lempeet al.2005; Werneret al.2005), pathogen
resistance (Grant et al.1995; Gassmann et al.1999),
and Arabidopsis insect resistance and secondary metab-olism (Kliebenstein et al. 2001, 2002; Lambrixet al.
2001). ELPs can be caused by various types of DNA se-quence polymorphisms, including trans-acting factors (Caicedo et al. 2004), cis-acting promoter
polymor-phisms (Fraryet al.2000; Conget al.2002),cis-acting
processing variants, such as splice-site polymorphisms (Lambrixet al.2001), and whole or partial gene
dele-tions that functionally act to nullify the gene’s expres-sion (Kliebensteinet al.2001; Lambrixet al.2001). In
contrast, the more drastic mRNA processing and INDEL polymorphisms may be overlooked even though they can be the basis of variation in plant/environment interactions (Lambrix et al. 2001; Kliebenstein et al.
2002). To fully study the sequence level polymorphisms that alter gene expression patterns, we include the full range of polymorphism types in our definition of ELPs. In spite of the potential importance of ELPs in controlling phenotypic variation, little is known about
1These authors contributed equally to this work.
2Corresponding author: Department of Plant Sciences, University of
California, Mail Stop 3, 1 Shields Ave., Davis, CA 95616-8780. E-mail: dastclair@ucdavis.edu
the extent of ELPs within a species or the distribution of ELPs within the genome. ELP variation within a species should be described at several levels. First, which genes are differentially expressed among accessions or geno-types? Such genes may be under selective pressure for altered expression patterns or the expression difference may be the result of neutral sequence variation. Second, how does variation in gene expression relate to the un-derlying nucleotide polymorphism level? Comparing the nucleotide polymorphism level between individuals to their ELP divergence can help assess if these two types of genetic diversity are related. By comparing the pattern of nucleotide polymorphism to ELP variation, it may be possible to determine if nucleotide polymor-phisms and expression level polymorphism show similar variation patterns, suggesting comparable levels of neu-trality. Third, how does gene expression variation differ in response to changes in the environment and/or treat-ments? These questions, as well as many others, can be addressed by quantitative analyses of natural variation in gene expression within a species.
In this study, we assay natural variation in Arabidopsis gene expression on a genome-wide basis in terms of which genes exhibit ELPs, how frequently these genes vary in their expression patterns between pairs of acces-sions, and the consequences of varying a treatment on ELP detection. The Affymetrix ATH1 GeneChip micro-array representing 22,810 genes was employed to query gene expression in seven Arabidopsis thaliana acces-sions. These accessions represent80% of the moderate-to high-frequency polymorphisms within Arabidopsis (Nordborget al.2005). All statistically significant ELPs
in 5-week-old foliar tissue were used to obtain an overview of species-wide variation. Our analysis revealed between 1428 and 3344 differentially expressed genes for any pair of the Arabidopsis accessions surveyed. The genes exhibiting differential expression between at least one pair of these seven accessions composed more than one-third of the Arabidopsis genome. The frequency of differential gene expression between accessions was significantly positively correlated with the genomewide sequence divergence among the same accessions. Further-more, this sequence/expression divergence correlation was also evident in terms of chromosome organization/ physical localization. This study provides a first de-scription of a species-level sampling of gene expression variation within Arabidopsis, as well as an assessment of how ELP variation relates to nucleotide polymorphism levels.
MATERIALS AND METHODS
Plant material and experimental conditions:Seeds of seven
Arabidopsis thalianaaccessions (Col-0, Cvi-1, Est, Kin-0, Mt-0, Tsu-1, and Van-0) were provided by J. Chory, Salk Institute, San Diego. These accessions can be obtained from The European Arabidopsis Stock Centre (http://arabidopsis.info) and The Arabidopsis Information Resource (TAIR) (www.arabidopsis.org).
To identify a level of exogenous salicylic acid (SA) application that caused gene induction without phytotoxicity in all ac-cessions, a preliminary experiment was conducted. Multiple plants of each accession were grown in a growth chamber under short-day conditions (8 hr light at 100–120 mEi, 20°
day/20°night) to maintain plants in the vegetative phase for 5–6 weeks. The accessions were treated with SA at approxi-mately the same developmental stage (as defined by rosette diameter and leaf number). Plants were selected for treatment when they either reached a rosette diameter of 50–60 mm or had15–20 leaves. Subsequently, the plants were sprayed with a series of SA (Sigma-Aldrich, St. Louis) concentrations [0, 0.1, 0.2, 0.3, and 1 mm, all in 0.02% Silwet L77, a surfactant (Lehle Seeds, Round Rock, TX)] to runoff and then harvested at four time points (4, 28, 52, and 76 hr) post-SA treatment and quick-frozen in liquid nitrogen. Three plants per accession were bulked for each concentration/time point to generate suffi-cient quantities of RNA. RNA was extracted from the bulked plants using TRIzol as per the manufacturer’s protocol (Invitrogen, Carlsbad, CA) and applied to slot blots as de-scribed (Ausubelet al.2004). Genes that had been reported previously as responsive to SA induction were used as probes on the slot blots (PR1,PR2,PR5,NPR1,EDS1,EDS5, andPAD4) (Glazebrook2001), andb-tubulin served as a negative con-trol. DNA sequences were obtained from GenBank (www. ncbi.nlm.nih.gov) and TAIR (www.arabidopsis.org) to design primers for PCR amplification and cloning. PR1, the most informative marker gene, indicated that across the seven acces-sions, plants responded to 0.30 mmSA during the first three time points (4, 28, and 52 hr) without exhibiting phytotoxicity (data not shown). Therefore, two treatments, 0.30 mmSA plus a zero SA control, and sampling at three time points, 4, 28, and 52 hr post-SA application, were chosen to conduct global assays for ELPs among these seven accessions.
A factorial experiment was conducted with the seven acces-sions, using three biological replications for each of the two treatments and the three time points. Due to space limitations in the growth chambers, these replications were performed on different dates. The accessions were seeded out on four dates (10/8/02, 10/29/02, 12/19/02, and 2/6/03). If plants of an accession did not grow properly in one of the first three planting dates, all samples from that accession for the affected date were discarded. Subsequently, plants from the fourth planting date for that accession were used as a replacement third replicate to maintain a balanced factorial consisting of three biological replications per accession. For each biological replicate, multiple plants (30) per accession were grown in a growth chamber under short-day conditions (8 hr light at 100– 120mEi, 20°day/20°night) to maintain plants in the vegetative phase for 6–7 weeks. Plants with 25–30 rosette leaves (rosette diameter 60–70 mm) were selected and sprayed with 0.30 mm SA in 0.02% Silwet L77 to runoff, and control plants were sprayed with 0.02% Silwet L77 alone. Plants from each com-bination of accession and treatment were harvested at 4, 28, and 52 hr post-treatment and quick-frozen in liquid nitrogen for subsequent RNA extractions. Each plant was harvested only once. To avoid diurnal variation in gene expression, the time points were 24 hr apart and harvesting was always performed over a 30-min period at the same time of day (1:00pm).
RNA isolation and microarray analysis of transcriptome:
Suite software MAS 5.0. The MAS 5.0 algorithm with default scaling was used to obtain gene expression levels for analysis.
Quality control:A preliminary analysis was conducted with
GeneSpring v. 4.2 software (Agilent Technologies, Palo Alto, CA) for the purpose of selecting diagnostic genes that could be used to identify the accession hybridized to each GeneChip. Thirty-one genes were chosen whose expression level allowed each accession to be uniquely identified, regardless of treat-ment or time point. Using these 31 diagnostic genes, we finger-printed all the chips. This procedure detected 11 GeneChips that did not fit the expected expression profile for a given accession, but matched the profile of a different accession, suggesting that an error had occurred during sample process-ing. These chips had all been run on the same 2 days, suggesting a single procedural error. When the 11 original RNA samples were reanalyzed on replacement GeneChips, the expression profiles fit their expected accession profile. This confirmed that a sample switch had occurred during initial chip processing, so the data from the incorrect GeneChip were removed and replaced with the correct replacement GeneChip.
Statistical analysis: We next proceeded to conduct a
sta-tistical analysis with the following goals: to detect differential gene expression among accessions, which may represent po-tential ELPs; to identify accessions with gene expression changes resulting from SA application; and to account for array (chip-to-chip) variation. A mixed linear model analysis of variance (ANOVA) was used to analyze the GeneChip data. This approach is more powerful than nonparametric methods to detect differentially expressed genes and allows partitioning of the sources of variation in gene expression (e.g., accession, treatment, time points, array, gene, and their various in-teraction terms) that in turn improves accuracy and enables experimental interpretation (Craiget al. 2003). The mixed linear model also takes into account the array (chip-to-chip) variation, which enables better estimation of the ‘‘true’’ un-derlying gene effects, especially when the array variation is large. The mixed model, as employed here, does not require data ‘‘normalization’’ procedures since the components of variation are incorporated in the model. Furthermore, this model permits analysis of expression level data from all genes represented on the GeneChip without relying on Affymetrix software to call the presence or absence of expression.
For each pair of accessions (21 in total), an ANOVA was per-formed using a split-plot mixed linear model with a random array effect. In this modelyijkgrdenotes the expression level of geneg, measured from the accessioniunder SA treatmentjat the time pointkfor the chip replicationr. The ANOVA model for the log-transformed expression levels is
logðyijkgrÞ ¼m1Pi1Sj1Tk1ðPSÞij1ðPTÞik1ðSTÞjk
1ðPSTÞijk1AðijkÞr1Gg1ðPGÞig1ðSGÞjg
1ðTGÞkg1ðPSGÞijg1ðPTGÞikg1ðSTGÞjkg
1ðPSTGÞijkg1eijkgr;
wherei¼1, 2;j¼1, 2;k¼1, 2, 3;g¼1,. . ., 22,810; andr¼1, 2, 3. The main effects are denoted asP,S,T, andGand represent accession, SA treatment, time point, and gene, respectively. The array effect (A) is assumed to be distributed as a normal random variable with mean 0 and variances2
A;eijkgrrepresents the subplot error and is assumed to be normally distributed with mean 0 and variances2
e.
Two null hypotheses were employed to test for gene ex-pression differences both within and between accessions. The first null hypothesis was used to statistically identify genes whose expression level significantly changed between treat-ments within an accession. For each gene of each accession at each time point, H01:Sj1(SG)jg¼Sj91(SG)j9gwas tested.
A second hypothesis was tested to detect potential ELPs. Specifically, for each gene under each treatment condition at each time point, there is no difference in expression levels between two accessions: H02:Pi1(PG)ig¼Pi91(PG)i9g. For
each of 21 accession pairs,t-tests were used with the type I error adjusted for multiple comparisons, Holm’s correction (Holm 1979), and false discovery rate (Holm1979; Benjaminiand Hochberg 1995). The accession analysis was based on the total number of genes identified as statistically significant by at least one of the two hypotheses H01and H02, the number of potential ELPs detected byt-tests for H02, and the number of genes with possible ELPs related to SA induction as identified byt-tests for both H01and H02. The numbers of such genes for all 21 parental pairs were compared to determine the maximum and minimum number of differences.
Quantitative RT–PCR: To validate gene expression data
obtained from the GeneChips, we chose 15 single-copy genes for quantitative RT–PCR analysis (QRT–PCR). These genes were scattered throughout the genome and represented the range of ELP frequencies: 5 genes polymorphic in.50% of pairwise comparisons, 5 genes polymorphic in50% of pair-wise comparisons, and 5 genes polymorphic in,50% of pair-wise comparisons. Total RNA from the same samples used for hybridization to the GeneChips was treated with deoxyribo-nuclease I (Sigma, St. Louis) according to the manufacturer’s instructions. The DNAse-treated RNA was then used for first-strand cDNA synthesis with the Advantage RT-for-PCR kit (Clontech, Mountain View, CA), according to the manufac-turer’s instructions. The PCR primers were designed with Primer3 software (Rozenand Skaletsky2000) to amplify frag-ments of140 bp (supplemental Table 1 at http://www.genetics. org/supplemental/). TheActin7gene, At5g09810, was used as a control gene for QRT–PCR since it exhibited invariant expression among all seven accessions. The optimal annealing temperature was determined with gradient PCR using the Robocycler Gradient 96 (Stratagene, La Jolla, CA). Real-time quantitative PCR was performed with the AB7300 Real Time PCR system, using the SYBR Green PCR Master Mix, the RT– PCR kit, and 96-well optical reaction plates [Applied Biosys-tems (Foster City, CA) 7300 Real Time PCR system]. PCR cycling conditions were 10 min at 95°, 40 cycles of 15 sec at 95°, and 1 min at 57°. Forward and reverse primer concen-trations of 50, 300, and 900 nmwere used to determine optimal conditions for each gene. The quality of the amplification was determined using the dissociation curve analysis of the AB7300 Real Time PCR system. Next, real-time PCR was per-formed with the control gene plus two of our chosen genes per plate, with seven cDNA samples and two no-template controls, each with two biological replicates and two technical repli-cates. For genes without an intron in the genomic DNA cor-responding to the amplicon, control cDNA samples were used for which the reverse transcriptase had been omitted during cDNA synthesis. Threshold cycle (CT) values reported by the AB7300 Real Time PCR system were used for data analysis. Three genes did not amplify under any condition utilized and were not considered in the analysis.
Single-feature polymorphism analysis: The Affymetrix
perceived expression differences, we utilized the individual probe data from the ATH1 GeneChips to identify SFPs be-tween Col-0 and Cvi-1. These two accessions were used as they showed the largest number of potential ELPs. Every probe from 2000 genes was tested for an SFP using the following algorithm: (probeCvi-1/probeset averageCvi-1)/(probeCol-0
/probe-set averageCol-0). A value of 0.40 was used as the cutoff for
declaring a significant SFP as this was the empirically de-termined 0.05 threshold derived from a histogram of all 22,000 tests: 5% of the tests were between the values of 0.1 and 0.4, and 95% of the tests were between 0.4 and 1. The genes were classified by the number of SFPs that were iden-tified and whether the gene showed differential expression in our specific pairwise comparisons of accessions. We randomly selected 400 genes that had one or more SFPs per gene and calculated the average expression level for each gene from each GeneChip in two ways: using all 11 perfect-match (PM) probes that included one or more with an SFP and using only the probes lacking any SFPs. An ANOVA was performed for each gene, using a split-split-plot mixed linear model with a random array effect, identical to the previous model above except that the sub-subplot was defined as the probes within a gene and the subplot was the gene. By comparing the per-gene expression values with and without SFP-containing probes, we could test whether SFPs were a significant source of variation in a gene’s overall expression value.
ELP sliding-window analysis:All 22,810 genes represented
on the ATH1 GeneChip and all of the 875 sequenced loci (Nordborget al. 2005) (walnut.usc.edu/2010/) were posi-tioned on the Arabidopsis physical map (TAIR website; www. arabidopsis.org), using the ATG start codon as the start of each gene or the first base pair as the start of each sequenced locus. Each gene was classified according to whether it showed differential expression between any of our six accessions that were also a part of the published sequence diversity study (Col-0, Cvi-1, Kin-0, Mt-0, Tsu-1, and Van-0) (Nordborget al.2005). Microsoft Excel was used to determine the frequency of gene expression divergence along each chromosome, in a 500-gene sliding window. The values were expressed as the ELP/ gene ratio by dividing the number of ELPs per 500-gene slid-ing window by 500 to place these values on a similar scale as the nucleotide polymorphism values for ease of comparison. This measure of divergence was plotted at the physical position for the median of the 500 genes within the window. The window was moved to the next adjacent gene, and the process was repeated until the end of the chromosome was reached. We utilized a fixed 500-gene window to minimize the effects of variation in gene density upon the estimate. Windows of 100 and 250 genes provided similar results, although the traces were less smooth (data not shown).
To estimate the threshold limit at a significance level of 0.05 for the frequency of differential gene expression, the positions of the differentially expressed genes were randomly permuted across the genome 500 times. The sliding-window analysis was repeated for each permutation, and the maximal and minimal values of differentially expressed genes per window per ran-domly permuted genome were obtained. The upper and lower P¼ 0.05 limits were then empirically set, using these dis-tributions from the permutations (0.056 ELP/gene for the lower bound and 0.132 ELP/gene for the upper bound). The extreme lower and upper values identified in the permuta-tion analysis were 0.048 ELP/gene and 0.150 ELP/gene, respectively.
Sequence divergence analysis:Sequence alignments for 96
A. thalianaaccessions at 875 loci were downloaded from the public website (Nordborget al.2005) (walnut.usc.edu/2010/). Six of the seven accessions (Col-0, Cvi-1, Kin-0, Mt-0, Tsu-1, and Van-0) in our study (Est was not included) were represented in
this sequence collection. Alignments were then filtered to identify and count the polymorphisms across all 96 accessions, across the 6 accessions in common between the two studies, as well as for each possible pairwise combination among our 6 accessions. This information was utilized to measure the fre-quency of each polymorphism across all 96 accessions and to classify whether it was polymorphic in our 6 accessions. The polymorphism information from all possible pairwise align-ments of the 6 accessions was used to calculate the per-locus nucleotide diversity (p) for each pairwise alignment (Tajima 1983; Nei1987). A linear regression analysis was utilized to determine the relationship between sequence polymorphism and level of ELPs. The number of ELPs per accession pair was regressed upon the averagep-measure for the same accession pair. Each accession pair was given a categorical variable indicating whether that pair contained the Col-0 accession or not. This variable was included in the analysis to test if the linear relationship was dependent upon the presence of Col-0; the presence of Col-0 did affect the ELP estimate, but it did not alter the positive association between ELP number and the average p-measure. A 5-Mbp sliding window of the average
p-measure for the same 6 accessions using all available 875 sequenced loci was generated in Excel as described previously. The average value was plotted at the median physical position. A 5-Mbp window size was selected to allow for sufficient averaging across the sequenced loci.
GO annotation analysis:The complete genome gene
ontol-ogy (GO) biological classification list was obtained and used to classify each gene (www.arabidopsis.org). The frequency of each first-level classification was obtained for the complete genome as well as for each list of ELPs from the pairwise accession ANOVAs. Each ELP list was tested for significant deviations from the expected frequencies for the complete genome using
x2-analysis (Chenet al.2005).
RESULTS
Diversity sampling: Six of our 7 accessions are
in-cluded in a set of 96 Arabidopsis accessions from which 875 loci have been sequenced (Nordborg et al.2005)
(walnut.usc.edu/2010/), allowing us to estimate the amount of species-wide DNA polymorphism contained in our sample of accessions. We identified the poly-morphisms present in 875 loci distributed across the ge-nome and scored the frequency of each polymorphism among the 96 accessions and if that polymorphism was variable in our 6 accessions. Our 6 accessions contained
80% of the species-wide medium- to high-frequency polymorphisms (minor allele frequency.10%) (Figure 1). In the rare- to low-frequency class, our accessions con-tained only 20–30% of the species diversity (Figure 1). Therefore, our accessions were representative of most of the medium- to high-frequency sequence variation in Arabidopsis.
ANOVA of microarray data for differentially
ex-pressed genes:The split-plot ANOVA revealed that four
gene3accession interaction effect indicates that gene expression behaved differently in the various acces-sions. Since these differences may be due to potential ELPs or sequence polymorphisms, the statistical analysis cannot distinguish between these two alternatives. A significant gene 3 time point interaction effect indi-cates that different genes exhibit distinct expression patterns over time. The significant array effect shows that there is chip-to-chip variation, but the split-plot model properly accounted for this source of variation. Over the 21 pairs of accessions, there were no significant effects for SA treatment, interaction of accession 3
treatment, and accession 3treatment3 gene (three-way interaction), suggesting that the SA treatment did not strongly affect the overall expression levels across all 22,810 genes, which is expected given that only a subset of genes is induced by SA. However, the regulation of expression over time was definitely affected by SA treatment, as evidenced by significant effects for time points and all time-related interactions.
The pairwise ANOVA identified on average 2234 genes showing differential expression signal (potential ELPs) between any two accessions across treatments, using false discovery rate (FDR) multiple-testing correc-tion (Benjaminiand Hochberg1995), and 331 genes
when using Holm’s multiple testing correction (Holm
1979) (Figure 2). Accession Cvi-1 had more potential ELPs in all of its pairwise comparisons than did any of the other accessions (Figure 2). To assess the variability of potential ELPs, we added the number of pairwise comparisons for which any given gene showed a differential expression signal. The resulting distribution was heavy tailed and skewed toward low- to moderate-frequency ELPs and was similar for gene lists obtained
using either the FDR or Holm’s procedure (Figure 3). Interestingly, several hundred genes showed differential expression signals in over half of the pairwise tests, suggesting that these genes have multiple alleles that can confer distinct expression levels.
We included a SA treatment as we are interested in the natural variation in responses to SA application. The use of two treatments (SA and control) provided an op-portunity to examine the consequences of experimental treatment variation on the set of genes showing differ-ential expression. SA is a major signaling molecule in-volved in plant defense responses (Gaffneyet al.1993;
Delaney et al. 1995). We utilized a 0.30-mmSA
treat-ment, as higher SA levels caused phytotoxicity in some accessions (data not shown). Statistical analysis identi-fied an average of 660 genes with FDR and 25 genes with Holm’s procedure showing differential SA response between at least one pair of accessions. These numbers represent 10–20% of the genes showing a difference in expression among accessions that did not exhibit a treatment interaction. This suggests there is consider-able variation in responses to this key signaling mol-ecule, but how this relates to variation in disease resistance is currently unknown.
Control genes:To test the ability of our ANOVA to
de-tect genes that had previously been reported as varying
Figure1.—Sampling of species variation. The percentage of polymorphisms in 96 Arabidopsis accessions that are poly-morphic in the six accessions in common with this data set (Col-0, Cvi-1, Kin-0, Mt-0, Tsu-1, and Van-0) are shown (Nordborget al.2005). The alleles are binned on the basis of the minor allele percentage in the 96-accession data set (shown on thex-axis). The smooth line represents the ex-pected random-sampling distribution for 6 accessions for each allele percentage class.
TABLE 1
ANOVA of pairwise expression differences
Effecta d.f. SS MS F-value P-value
P 1 1,843.1 1,843.139 7.118 0.0135
S 1 328.6 328.687 1.269 0.2710
T 2 1,361.9 680.990 2.630 0.0928
PS 1 4.0 4.036 0.016 0.9017
PT 2 227.1 113.554 0.439 0.6501
ST 2 518.9 259.460 1.002 0.3820
PST 2 1,408.7 704.392 2.720 0.0861
Array 24 6,215.0 258.960 5,232.731 ,0.0001
G 22,809 564,328.8 24.742 499.944 ,0.0001
PG 22,809 7,418.9 0.325 6.573 ,0.0001
SG 22,809 1,149.2 0.050 1.018 0.0294
TG 45,618 6,144.5 0.135 2.722 ,0.0001
PSG 22,809 991.3 0.044 0.878 .0.9999
PTG 45,618 2,426.3 0.053 1.075 ,0.0000
STG 45,618 3,218.0 0.071 1.426 ,0.0000
PSTG 45,618 2,264.6 0.050 1.003 0.3243
Error 547,416 27,090.8 0.050 Corrected
total
821,159 626,940.5
Pairwise ANOVA comparing accessions Col-0 and Van-0 as an example of results from a split-plot analysis of variance is shown. A similar analysis was performed for all 21 pairwise combinations of the seven accessions in our study.
a
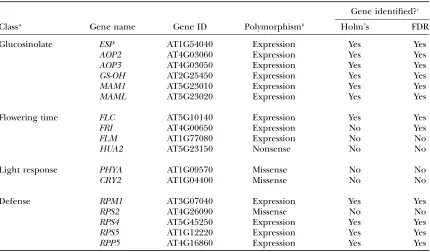
between accessions, we studied a set of genes that were known to display natural variation in DNA sequence, mRNA accumulation, and phenotype. This compari-son included genes involved in the production of the plant-defense-related glucosinolates (ESP, AOP2, AOP3, GS-OH,Mam1, and MamL) (Kliebenstein et al. 2001;
Lambrix et al. 2001; Kroymann et al. 2003),
flower-ing time (FLC,FRI,FLM, andHUA2) ( Johansonet al.
2000; Caicedoet al.2004; Doyleet al.2005; Lempeet al.
2005; Werner et al. 2005), hypocotyl light responses
(PHYAandCRY2) (El-Assalet al.2001; Maloofet al.
2001), and elicitation of resistance (RPM1,RPS2,RPS4, RPS5, andRPP5) (Grantet al.1995; Parkeret al.1997;
Gassmannet al.1999; Henket al.1999; Mauricioet al.
2003). These genes were classified on the basis of the nature of the molecular polymorphisms (Table 2). Any polymorphism (INDEL, splice site polymorphism, or observed mRNA difference) that might cause a change in observed gene expression was listed as a potential ELP. Our statistical analysis identified 12 of the 13 genes previously known or predicted as being differentially expressed (Table 2). One gene (FLM) that we did not identify as polymorphic has an INDEL in an accession that was not included in our study (Werneret al.2005).
Genes with nonsense or missense polymorphisms served as controls and, as expected, were not detected as differentially expressed. These results suggest that our experiment has a low false negative rate for detecting ELPs.
To check if the above analysis was biased by using genes known to cause phenotypic polymorphisms, we used the 12 genes showing differential expression in the seven accessions for QRT–PCR analysis for differential gene expression. The average correlation for the expres-sion values of these 12 genes between QRT–PCR and ATH1 GeneChip values was 0.69, indicating that the microarray analysis accurately detects genes with ELPs.
SFPs and differential expression: To test if the
pres-ence of SFPs significantly alters estimates of gene expres-sion, we calculated the apparent expression levels for 400 genes that contained SFPs between Col-0 and Cvi-1 with and without signal from the SFP-containing probes and employed a split-split-plot ANOVA. Of the 400 SFP-containing genes, the SFP was responsible for0.13% of the variance in signal among these genes. Further-more, inclusion of the probes with SFPs in the estima-tion of a gene’s expression value led to only a 7% decrease in the estimate. Therefore, SFPs are not a significant
Figure 3.—Frequency of pairwise accession gene expres-sion differences. The horizontal axis indicates the number of accession pairs (n¼21 pairs) for which the genes are de-tected as differentially expressed. Solid bars denote the num-ber of genes identified with Holm’s procedure; open bars denote the number of genes identified with the FDR procedure.
source of variation in gene expression estimates and the differences among accessions were predominantly due to actual ELPs.
Gene function bias: Previous work had suggested a
bias in the functional classification of genes that show differential expression among Arabidopsis accessions (Chenet al.2005). When the GO biological annotations
were used to classify the genes, the differentially ex-pressed genes were significantly enriched for genes clas-sified as controlling biotic and abiotic responses, stress responses, and signal transduction (Figure 4). These differences in classification frequencies were significant byx2-tests in all pairwise comparisons per category as well as for the average of the pairwise comparisons after adjusting for multiple comparisons with Bonferroni correction (data not shown). In addition, there was a significant decrease in genes classified as being involved in transport (Figure 4). This result was similar to those previously reported by Chen et al. (2005). A similar
comparison using the GO molecular annotations iden-tified a significant difference from the whole-genome expectation (in over half of the pairwise comparisons) only for genes classified as receptor binding or activity. No classes in GO cellular annotations were significant in the pairwise comparisons (data not shown).
Relationship of pairwise expression differences to
sequence divergence:If there is no major filtering
mech-anism, such as differential selection pressures upon sequence and expression polymorphisms or massive trans-acting effects, to bias the impact of DNA sequence variation on gene expression variation, a genome-wide relationship between DNA sequence variation and ELP variation is expected. To assess this relationship, we determined the pairwisep, average pairwise nucleotide divergence (Tajima1983; Nei1987) between the six
ac-cessions for which there were sequence data, and then compared pwith the number of genes we detected as differentially expressed between the same accession pair (as determined by FDR). There was a significant positive relationship between these values (Figure 5). This linear regression analysis accounted for whether the pair included Col-0, from which the oligomer probes on the ATH1 GeneChip were designed (N ¼
15,P,0.0001,r¼0.83; Col-0 presence in accession pair, d.f.¼1,P¼0.0483) (Figure 5). The estimates of gene expression divergence provided by Holm’s multiple testing correction generated a nearly identical relation-ship between sequence and gene expression divergence (N ¼ 15, P , 0.0001, r ¼0.86; Col-0 presence in ac-cession pair, d.f.¼1,P¼0.0097). This association was
TABLE 2
Identification of known genes with expected variation in expression among accessions
Gene identified?c
Classa Gene name Gene ID Polymorphismb Holm’s FDR
Glucosinolate ESP AT1G54040 Expression Yes Yes
AOP2 AT4G03060 Expression Yes Yes
AOP3 AT4G03050 Expression Yes Yes
GS-OH AT2G25450 Expression Yes Yes
MAM1 AT5G23010 Expression Yes Yes
MAML AT5G23020 Expression Yes Yes
Flowering time FLC AT5G10140 Expression Yes Yes
FRI AT4G00650 Expression No Yes
FLM AT1G77080 Expression No No
HUA2 AT5G23150 Nonsense No No
Light response PHYA AT1G09570 Missense No No
CRY2 AT1G04400 Missense No No
Defense RPM1 AT3G07040 Expression Yes Yes
RPS2 AT4G26090 Missense No No
RPS4 AT5G45250 Expression Yes Yes
RPS5 AT1G12220 Expression Yes Yes
RPP5 AT4G16860 Expression Yes Yes
Shown are genes previously reported to be naturally variable among Arabidopsis accessions in foliar tissue and that generate a known phenotype.
aDenotes the phenotype altered by the variation.
bLists whether the variation is expression based or not, as described in the literature (see text for references).
Polymorphisms labeled as nonsense or missense have the corresponding sequence polymorphism and are not known to alter expression in plants.
cIndicates if the gene was identified as being naturally variable (satisfying H02) by either Holm’s procedure or
also significant when comparingpagainst the number of genes showing an expression difference dependent upon an accession 3 treatment interaction (N ¼ 15, P,0.0001,r¼0.95; Col-0 presence in accession pair, d.f.¼1,P¼0.001). These genes were not likely to have been affected by hybridization differences, such as those caused by INDEL polymorphisms, since these genes ex-hibited nonvariable gene expression in one treatment across two accessions but showed differential gene ex-pression under the other treatment. This relationship between p and the genes significant for accession 3
treatment interactions further supports the hypothesis that SFPs did not significantly influence estimates of
gene expression variation and that we indeed measured ELPs among accessions.
Genomic distribution of expression differences
and sequence divergence:The relationship betweenp
and gene expression variation (previous section) is a genome-wide average comparison. To assess if there was a relationship between local DNA sequence variation and gene expression variation, we conducted a sliding-window analysis along the Arabidopsis chromosomes (Figure 6). A distinct relationship in local sequence variation and gene expression variation was detected, as the two traces were very similar across the chromosomes (Figure 6). Local peaks of DNA sequence divergence among the accessions typically colocated with local en-richments in the number of genes showing polymorphic gene expression. In particular, there is a region near the middle of chromosome III that has a significant eleva-tion in gene expression polymorphism and is also en-riched in DNA sequence variation (Figure 6). Two regions with a lack of local correlation between sequence diver-sity and polymorphic gene expression can be explained by technical or biological reasons. The flat region for differential gene expression at the top of chromosome IV is an area of low gene density due to the presence of the nucleolar organizing region. The10-Mbp region on chromosome V that had low estimates ofpalso has a paucity of sequenced loci and may represent a local sampling bias.
DISCUSSION
We identified a total of 2066 genes in the seven ac-cessions (Col-0, Cvi-1, Est, Kin-0, Mt-0, Tsu-1, and Van-0)
Figure 4.—GO biological annotation comparison for dif-ferentially expressed genes. Solid bars show the percentage of total annotations in each GO biological annotation classifica-tion using the completely se-quenced Arabidopsis genome from Col-0. Shaded bars (with standard errors) show the aver-age percentaver-age of total annota-tions for each of the above GO biological classifications using all 21 comparisons between pairs of accessions. Asterisks in-dicate those classifications that are significantly different from the whole-genome analysis as determined by x2-tests, with
Bonferroni correction. GO bio-logical classifications that de-scribe unknown proteins were not included (i.e., other physio-logical processes, other meta-bolic processes, other cellular processes, and biological pro-cesses unknown) since they were uninformative.
Figure5.—Sequence divergence and gene expression dif-ferences are associated. The relationship betweenpand num-ber of ELPs between pairs of six accessions (Col-0, Cvi-1, Kin-0, Mt-0, Tsu-1, and Van-0), as determined by linear regression and FDR gene list (n¼15,P,0.001,r2¼0.83), is shown.
as differentially expressed under Holm’s multiple test-ing procedure and 6433 genes with FDR, suggesttest-ing that 10–30% of the transcriptome showed natural variation
in expression in foliar tissue. Considering that the limited number of accessions used here efficiently sampled only moderate- to high-frequency DNA poly-morphisms, it is highly probable that these are lower bounds on the frequencies of ELPs. There are likely many rare ELPs that were not represented in our ac-cessions. Furthermore, we sampled only one tissue, at one developmental stage, for one set of environmental conditions, and in the absence of biotic pests. There-fore, even the conservative estimate of differentially expressed genes from Holm’s multiple testing proce-dure suggests that a significant fraction of the Arabi-dopsis genome shows differential expression under one circumstance or another. This will be particularly the case if genotype3environment or genotype3 develop-ment interactions play a significant role in differential gene expression. The frequency distribution of ELPs in our accessions also suggests that our estimate of ELPs is conservative. Over 70% of the differentially expressed genes were present in ,3 of the 21 pairwise compar-isons of seven accessions. Thus, like DNA sequence polymorphisms in Arabidopsis, most gene expression polymorphisms appear to be rare- to low-frequency events. An analysis of a much larger collection of acces-sions and more extensive variation in experimental conditions would be required to generate an estimate of the higher bounds of gene expression variation even for a single tissue at a single developmental age.
The ELPs detected in our study showed a bias in their categorization by the GO biological annotations, with an overrepresentation of genes involved in signaling and plant/stress responses compared to the base dis-tribution from the Col-0 sequence annotation (Figure 4). These biases were the same as those found by Chenet al.
(2005) in their analysis of variable gene expression among accessions sampled at different developmental stages. As suggested by these categorical differences, the greatest opportunities for the evolution of differences in gene expression levels in Arabidopsis are in responses to the environment. This idea is consistent with the number of flowering-time and light-response quantita-tive trait loci (QTL) that have been mapped to known signaling loci (Johansonet al.2000; El-Assalet al.2001;
Maloofet al. 2001; Caicedo et al. 2004; Doyle et al.
2005; Werneret al.2005). However, it is also possible
that even though the plants were grown under carefully controlled conditions, there were physiological differ-ences between the accessions that led to differential stress responses.
We identified a positive relationship between ELPs and DNA sequence divergence at both the whole-genome and local subchromosomal levels (Figures 5 and 6). This relationship implies that there is a direct association between DNA sequence polymorphism and ELP. Such a relationship at the local level suggests that there is a significant impact ofcis- (or linkedtrans-) DNA sequence polymorphism on gene expression. If the majority of expression differences were due to unlinked trans-polymorphisms, the global estimates of sequence and expression polymorphism would still be correlated but at the local level there would not be a relationship between ELP and DNA sequence polymorphism. How-ever, there was heterogeneity in the local relationship between sequence and gene expression variation. For example, chromosome I appeared to be split, with the top half of the chromosome showing an association while the bottom half of chromosome I showed a de-crease in p in relation to gene expression variation (Figure 6). Thus, there seemed to be an enhanced fre-quency of ELPs at the distal end of chromosome I. It will require genetic analysis of a segregating population to provide more definitive data on the relative importance ofcis-vs. trans-acting DNA polymorphisms in regulating ELPs in Arabidopsis.
This work provides a baseline description of the level and patterns of ELP polymorphism within Arabidopsis. As a number of Arabidopsis QTL have been shown to be controlled by an ELP within a causative gene, our data may enhance QTL cloning by providing rapid candidate gene identification. Furthermore, these data provide a foundation from which to explore the impacts of dif-ferent environmental conditions and developmental stages upon ELPs. Additionally, ELPs can be mapped in a segregating population as expression QTL to char-acterize how cis- and trans-acting loci coordinate to generate ELP patterns within the species (Brem et al.
2002; Schadtet al.2003; Yvertet al. 2003; Brem and
Kruglyak2005).
Technical assistance was provided by Carol Lam and Rebecca Walker. This research was supported by the National Science Founda-tion (NSF) 2010 Project grant MCB-0115109 to D.A.S., R.W.M., and R.W.D. and by NSF grant MCB-0323759 to D.J.K.
LITERATURE CITED
Ausubel, F. M., R. Brent, R. E. Kingston, D. D. Moore, J. G. Seidman et al., 2004 Current Protocols in Molecular Biology.John Wiley & Sons, New York.
Benjamini, Y., and Y. Hochberg, 1995 Controlling the false
discov-ery rate—a practical and powerful approach to multiple testing.
J. R. Stat. Soc. Ser. B Methodol.57:289–300.
Bentley, S. D., and J. Parkhill, 2004 Comparative genomic
struc-ture of prokaryotes. Annu. Rev. Genet.38:771–792.
Borevitz, J. O., D. Liang, D. Plouffe, H. S. Chang, T. Zhuet al.,
2003 Large-scale identification of single-feature
polymor-phisms in complex genomes. Genome Res.13:513–523.
Brem, R. B., and L. Kruglyak, 2005 The landscape of genetic
com-plexity across 5,700 gene expression traits in yeast. Proc. Natl.
Acad. Sci. USA102:1572–1577.
Brem, R. B., G. Yvert, R. Clintonand L. Kruglyak, 2002 Genetic
dissection of transcriptional regulation in budding yeast. Science
296:752–755.
Caicedo, A. L., J. R. Stinchcombe, K. M. Olsen, J. Schmittand
M. D. Purugganan, 2004 Epistatic interaction between
Arabi-dopsisFRIandFLCflowering time genes generates a latitudinal
cline in a life history trait. Proc. Natl. Acad. Sci. USA101:15670– 15675.
Carrol, S. B., 2000 Endless forms: the evolution of gene regulation
and morphological diversity. Cell101:577–580.
Chen, W. J., S. H. Chang, M. E. Hudson, W.-K. Kwan, J. Liet al.,
2005 Contribution of transcriptional regulation to natural
var-iations in Arabidopsis. Genome Biol.6:R32.
Cong, B., J. P. Liuand S. D. Tanksley, 2002 Natural alleles at a
to-mato fruit size quantitative trait locus differ by heterochronic
reg-ulatory mutations. Proc. Natl. Acad. Sci. USA99:13606–13611.
Craig, B. A., M. A. Blackand R. W. Doerge, 2003 Gene expression
data: the technology and statistical analysis. J. Agric. Biol. Envi-ron. Stat.8:1–28.
Delaney, T. P., L. Friedrichand J. A. Ryals, 1995 Arabidopsis
sig-nal transduction mutant defective in chemically and biologically
induced disease resistance. Proc. Natl. Acad. Sci. USA92:6602–
6606.
Doerge, R. W., 2002 Mapping and analysis of quantitative trait loci
in experimental populations. Nat. Rev. Genet.3:43–52.
Doyle, M. R., C. M. Bizzell, M. R. Keller, S. D. Michaels, J. D.
Songet al., 2005 HUA2 is required for the expression of floral
repressors inArabidopsis thaliana.Plant J.41:376–385. El-Assal, S. E. D., C. Alonso-Blanco, A. J. M. Peeters, V. Razand
M. Koornneef, 2001 A QTL for flowering time in Arabidopsis
reveals a novel allele ofCRY2.Nat. Genet.29:435–440.
Frary, A., T. C. Nesbitt, A. Frary, S. Grandillo, E.van derKnaap et al., 2000 fw2.2: a quantitative trait locus key to the evolution of tomato fruit size. Science289:85–88.
Gaffney, T., L. Friedrich, B. Vernooij, D. Negrotto, G. Nyeet al.,
1993 Requirement of salicylic acid for the induction of systemic
acquired-resistance. Science261:754–756.
Gassmann, W., M. E. Hinschand B. J. Staskawicz, 1999 The
Ara-bidopsisRPS4bacterial-resistance gene is a member of the
TIR-NBS-LRR family of disease-resistance genes. Plant J.20:265–277. Gibbs, R. A., J. W. Belmont, P. Hardenbol, T. D. Willis, F. L. Yuet al.,
2003 The International HapMap Project. Nature426:789–796.
Glazebrook, J., 2001 Genes controlling expression of defense
responses in Arabidopsis—2001 status. Curr. Opin. Plant Biol.
4:301–308.
Grant, M. R., L. Godiard, E. Straube, T. Ashfield, J. Lewaldet al.,
1995 Structure of the ArabidopsisRpm1 gene enabling
dual-specificity disease resistance. Science269:843–846.
Henk, A. D., R. F. Warrenand R. W. Innes, 1999 A newAc-like
trans-poson of Arabidopsis is associated with a deletion of theRPS5
disease resistance gene. Genetics151:1581–1589.
Holm, S., 1979 A simple sequentially rejective multiple test
proce-dure. Scand. J. Stat.6:65–70.
Johanson, U., J. West, C. Lister, S. Michaels, R. Amasinoet al.,
2000 Molecular analysis ofFRIGIDA, a major determinant of
natural variation in Arabidopsis flowering time. Science 290:
344–347.
Kliebenstein, D., V. Lambrix, M. Reichelt, J. Gershenzon and
T. Mitchell-Olds, 2001 Gene duplication and the
diversifica-tion of secondary metabolism: side chain modificadiversifica-tion of gluco-sinolates inArabidopsis thaliana.Plant Cell13:681–693. Kliebenstein, D. J., D. Pedersenand T. Mitchell-Olds, 2002
Com-parative analysis of insect resistance QTL and QTL controlling the myrosinase/glucosinolate system inArabidopsis thaliana.Genetics
161:325–332.
Kroymann, J., S. Donnerhacke, D. Schnabelrauchand T. Mitchell
resistance quantitative trait locus. Proc. Natl. Acad. Sci. USA100:
14587–14592.
Lambrix, V., M. Reichelt, T. Mitchell-Olds, D. Kliebenstein
and J. Gershenzon, 2001 The Arabidopsis epithiospecifier
protein promotes the hydrolysis of glucosinolates to nitriles
and influencesTrichoplusia ni herbivory. Plant Cell 13: 2793–
2807.
Lempe, J., S. Balasubramanian, S. Sureshkumar, A. Singh,
M. Schmidet al., 2005 Diversity of flowering responses in wild Arabidopsis thalianastrains. PLoS Genet.1:109–118.
Maloof, J. N., J. O. Borevitz, T. Dabi, J. Lutes, R. B. Nehringet al.,
2001 Natural variation in light sensitivity of Arabidopsis. Nat.
Genet.29:441–446.
Mauricio, R., E. A. Stahl, T. Korves, D. C. Tian, M. Kreitmanet al.,
2003 Natural selection for polymorphism in the disease
resis-tance geneRps2ofArabidopsis thaliana.Genetics163:735–746.
Nei, M., 1987 Molecular Evolutionary Genetics.Columbia University
Press, New York.
Nordborg, M., T. T. Hu, Y. Ishino, J. Jhaveri, C. Toomajianet al.,
2005 The pattern of polymorphism in Arabidopsis thaliana.
PLoS Biol.3:e196.
Nuzhdin, S. V., M. L. Wayne, K. L. Harmonand L. M. McIntyre,
2004 Common pattern of evolution of gene expression level
and protein sequence in Drosophila. Mol. Biol. Evol.21:1308–
1317.
Parker, J. E., M. J. Coleman, V. Szabo, L. N. Frost, R. Schmidtet al.,
1997 The Arabidopsis downy mildew resistance gene RPP5
shares similarity to the toll and interleukin-1 receptors with
N and L6. Plant Cell9:879–894.
Rozen, S., and H. Skaletsky, 2000 Primer3 on the WWW for
general users and for biologist programmers, pp. 365–386 in
Bioinformatics Methods and Protocols: Methods in Molecular Biology, edited by S. Krawetzand S. Misener. Humana Press, Totowa, NJ.
Schadt, E. E., S. A. Monks, T. A. Drake, A. J. Lusis, N. Cheet al.,
2003 Genetics of gene expression surveyed in maize, mouse
and man. Nature422:297–302.
Schmid, K. J., T. R. Sorensen, R. Stracke, O. Torjek, T. Altmann et al., 2003 Large-scale identification and analysis of
genome-wide single-nucleotide polymorphisms for mapping inArabidopsis
thaliana.Genome Res.13:1250–1257.
Schmid, K. J., S. Ramos-Onsins, H. Ringys-Beckstein, B. Weisshaar
and T. Mitchell-Olds, 2005 A multilocus sequence survey in
Arabidopsis thaliana reveals a genome-wide departure from a
neutral model of DNA sequence polymorphism. Genetics169:
1601–1615.
Stein, L. D., Z. R. Bao, D. Blasiar, T. Blumenthal, M. R. Brent et al., 2003 The genome sequence ofCaenorhabditis briggsae: a
platform for comparative genomics. PloS Biol.1:166.
Tajima, F., 1983 Evolutionary relationship of DNA sequences in
fi-nite populations. Genetics105:437–460.
Wang, R. L., A. Stec, J. Hey, L. Lukensand J. Doebley, 1999 The
limits of selection during maize domestication. Nature398:236–
239.
Werner, J. D., J. O. Borevitz, N. Warthmann, G. T. Trainer, J. R.
Eckeret al., 2005 Quantitative trait locus mapping and DNA
array hybridization identify anFLMdeletion as a cause for
natu-ral flowering-time variation. Proc. Natl. Acad. Sci. USA 102:
2460–2465.
Winzeler, E. A., C. I. Castillo-Davis, G. Oshiro, D. Liang, D. R.
Richardset al., 2003 Genetic diversity in yeast assessed with
whole-genome oligonucleotide arrays. Genetics163:79–89.
Yvert, G., R. B. Brem, J. Whittle, J. M. Akey, E. Foss et al.,
2003 Trans-acting regulatory variation inSaccharomyces cerevisiae
and the role of transcription factors. Nat. Genet.35:57–64.