Risk Analysis of a Process Plant Using Fuzzy
Decision Making Tool
Saurabh Jha P
1, Mohd Salman Khan
1M.Tech Scholar, Department of Mechanical and Automation Engineering, Amity University, Noida, U.P, India1
ABSTRACT: This paper attempts to analyse the risk involved in the components of an industrial system. Risk is a factor that affects the system performance, operations, cycle time, availability and also the reputation and demand of the product. The study has employed various methods to identify the potential failure causes in the system such as root cause analysis (RCA), risk priority number (RPN) and failure mode effect analysis (FMEA). These methods establish obscure failures which provides a scope for further work. Hence, fuzzy decision making tool technique is applied to interpret the risky component that calls for thorough attention of the sub systems in a process plant
KEYWORDS: Root Cause Analysis, Risk Priority Number, Failure Mode Effect Analysis, IF-THEN Rule
I. INTRODUCTION
Every organization’s prime motive is to achieve higher productivity with regard to profit. Hence, periodical assessment of all its components are required to be done on a regular basis. Risk analysis is a broad term which deals with analysing the behaviour of the system and their sustainability in future. In order to develop this, Risk priority number of each component is determined and analysed with fuzzy decision tool of if-then rules. These two combined provide a better understanding and provides us with an estimation so that the critical areas can be focused upon which acts as retardation in the way of production.This, in turn will minimize the maintenance cost that occurs from time to time. The root cause analysis provides a platform to define the risk involved and RPN putforths values to these situations. The FMEA charts clearly summarizes the whole scenario of failures and subsequently, fuzzy tool authenticates it by predicting the appropriate amount of failure and the area which needs to be handles immediately.
II. LITERATUREREVIEW
membership function of blood pressure is applied by sugeno fuzzy model. Logic gate also clearly defined the relation between the parameters and defuzzification is performed. The 250 rules plotted as far as the patient’s life is considered are deduced and the surface plot is generated which processed the risk factor. khalegi et al., in 2014 assessed the risk management of a pipelines. A schematic overview represented the damage and its potential problems. Three different types of general structures for fuzzification and defuzzification were sketched to understand the process flow. Later on, in 2015 Khalifa et al., did a risk assessment of mined areas using fuzzy if then rule by varying the signal strength and location in that area. This rule based system was not only research upon industrial systems but also the workers related to it in 2015 by Jariwala and Christian. Various personal factors of the workers working in a solid waste are taken in triangular membership function and defuzification was performed. These data were collected by questionnaire to have the appropriate prediction. In 2016, Doskocil evaluated the total project risk by using triangular, trapezoidal and Gaussian membership function in his research. Results revealed the areas of shortcomings, the areas of warning and the supportive areas to focus upon.Recently, in 2016, Panchal and Kumar established a framework for risk analysis using FMEA and fuzzy decision making tool. This is assessed with help of root cause analysis in order to improve system’s availability and maintainability characteristics which acts as an elaborate qualitative analysis for listing the various failures. Severity, occurrence and non-detection are assessed as far as the machine’s risk is concerned and the results revealed the most critical components in its own category.
Thus, after having a brief knowledge about fuzzy decision making tool using if-the analysis, this I applied to the components of a centrifugal pump industry to determine the critical machines and its risk in the near future.
III.METHODOLOGY
A. ROOT CAUSE ANALYSIS: -
Root cause analysis is an analysis which identifies factors that are responsible for fault or low productivity using a structured approach that helps to focus on the problems underlying as stated by Mahto and Kumar in 2008. Uncertainties or odd factors are always attached to any of the working unit and we cannot deny or eliminate it from the system but its effect on the systems parameters can be reduced by analyzing the causes or failures and its effect in the system.
According to Kiran et al., in 2013, RCA is a four-step process
1. Data collection
2. Cause charting
3. Root cause identification
4. Recommendation
Fig.1.Root cause Analysis
Centrifugal pump production Lathe machine system
Jamming
Thrust bearing is broken Feed is not working
Knocking
Breakage
Chuck screw broken Vibration
Excessive feed & speed
Milling machine
Fail to operate
Less tolerance
Shaft pin loose
Vibration
Noisy operations
Boring machine
Wearing Operational loss Free blade pulley damaged
Tearing
Loss in machining
Bearing damaged Bearing & oil seal damaged
Tapping machine Vibration Unbalancing Shocker damaged Pressure loss Hydraulic pipe burst
Radial Drilling machine
Tearing Eccentric in holes
Unsteady operations Notching
Tool life decreases High work load
Vertical lathe machine
Fail to operate
Misalignment
Motor burnt, bearing housing broken Leakage
In the figure 1, the horizontal lines represent the sequential order to evaluate the root cause effect on the production of centrifugal pump system. Whereas the vertical lines represent the various machines in the production system, and sub branch line shows the potential cause of the problem or failure in the system.
B. RISK PRIORITY NUMBER: -
Risk priority number (RPN) is a method to assess the failure which are crucial in a process. Three important parameters namely severity, occurrences and detection are evaluated based on the rating scale. The rating scale can be varied according to the desirable conditions likely to occur for the particular component.
1. Severity (S) is a term which estimates how severe the effect of failure will be to client.
2. Occurrence (O) deals with the failure that is likely to occur during production or in a process.
3. Detection (D) is used to detect or prevent the cause of failure that has happened.
In 2014, sahoo et al., said that RPN is a term which is used for comparing problems within the analysis and subsequently prioritize the problems which will need further action. Linguistic terms are used for ranking and a scale factor from 1 to 10 is employed.
Severity (S) is measured on a scale from 1 to 10 of each machine to assign the cause effect due to failure.
Where 1= Low severity and 10 will be highly severe.
Occurrence (O) is also calculated on a scale from 1 to 10 and defines the probability at which the defects occur
in the root cause of the machine where 1= Not to take in consideration and 10= 100% chance of happening
Detectability (D) is an approach for indicating the errors or loopholes in the system where 1= Scale defining
that attention needs to be paid immediately towards the detected cause and 10= Low detectability means very little errors are detected.
RPN = Severity x Occurrences x Detection
High RPN means that attention needs to be diverted towards the detection of error signal. This is done by arranging the RPN is sequential order. It is very important to detect such defects as it might cause severe harms to the system on which we are working.
C.FMEA: -
It is a tool for assessing risk associated with the different ways (modes) in which a part or system can fail, identifies the effect of the system failures, and provide a structure for revising the design or the processing work to mitigate risk where necessary. It provides a method for quantitative analysis of the risk
In 2013, rakesh et al., studied about FMEA analysis and stated that it is a systematic tool for identifying and preventing the problems that occur in a system, thereby increasing its productivity. The factors that are identified by FMEA sheet are potential failure mode, potential effect of failure, potential cause of failure and determines risk priority number. Suresh et al., in 2014, assessed the risk of blast furnace by constructing a flowchart to process FMEA. The review team plays an important role in determining the potential causes of failure and ranking them according to the present situation.
D. FDMS: -
math behind this decision tool. In 201, this tool was applied on a power station by sai and reddy. The results were
deduced and subsequently, modification was suggested
.
IV.CASE STUDY
The research focuses on the different machines required to manufacture centrifugal pump converts the kinetic energy to hydrodynamic energy. It enables liquid to flow from low pressure to high pressure and a faster rate. It consists of casing (volute, circular), bearing, shaft rod and an impeller. Hence table 1 represents the machines specification of centrifugal plant with all working parameters.
Table.1. Machines specification
Machine Process Quantity Dimensions Symbol
Lathe machine
Turning, Knurling 3 12inch,12inch,20inch LM1, LM2, LM3
Vertical boring machine
Boring
2 1200*1200mm,1200*1600mm VBM4,VBM5
Tapping machine
Threading 1 1 inch T6
Radial drilling machine
Holes
4 50mm,60mm,60mm,70mm RDM7,RDM8, RDM9,
RDM10
Slotter machine
Facing and
threading
1 24inch SM11
Vertical lathe machine
Keyways
2 6ft,10ft VLM12, VLM13
V. RISKANALYSIS
After collecting the data from the company, risk analysis is performed. Risk analysis defines a system’s behaviour and how it will function in the near future. These are very much essential to the industry so that they keep up with all the components and know about the status which I turn will be helpful in their overall progress of production.
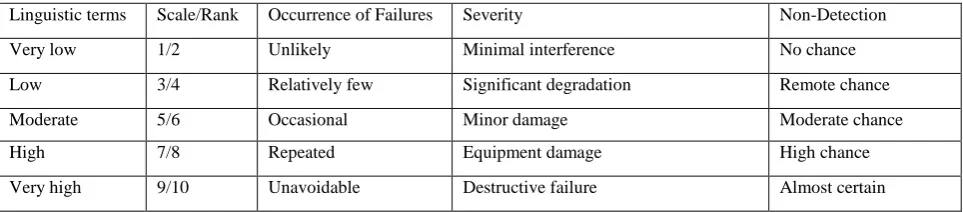
Table 2. Scale used for the probability of failure
Linguistic terms Scale/Rank Occurrence of Failures Severity Non-Detection
Very low 1/2 Unlikely Minimal interference No chance
Low 3/4 Relatively few Significant degradation Remote chance
Moderate 5/6 Occasional Minor damage Moderate chance
High 7/8 Repeated Equipment damage High chance
Table 2 represents the scale determined for each linguistic variable. The parameters associated with machines that are likely to happen in the categories of occurrences, severity and non-detection are defined and accordingly the scale is set. This Table provides an overall view as to how is the variation that is bound to occur in terms of failure.
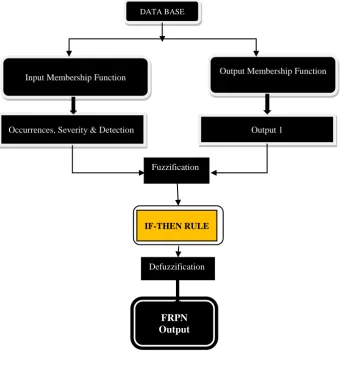
Fig.2 Fuzzy FMEA Flow Chart
A schematic representation of the structure is presented in Fig 2 which defines the flow of methodology. The flow chart is prepared by careful investigation of the sequencing of the work and to have a better understanding in dealing with the objective so that the result can be deduced with much ease and clarity. Therefore, it is a good practice to provide a framework that denotes the work order flow.
DATA BASE
Input Membership Function
Occurrences, Severity & Detection
Output Membership Function
Output 1
IF-THEN RULE
FRPN Output Fuzzification
Table 3. FMEA Sheet
FMEA Sheet is presented in Table 3 which determine RPN according to the scaling done by experts for the potential failures. These are compared with the Fuzzy ranking at a later stage.
Fuzzification is the first step in the fuzzy inference process where the standard (ordinary inputs) are transformed into fuzzy inputs, so that each ordinary (crisp) input has its own group of membership functions or sets to which they are transformed asshown in Fig.3
Components Function Potential failure mode
Potential effect of failure
Potential cause of failure Of S Od RPN
Lathe M/c
Lathe 001
Lathe 002 Lathe 003
To perform turning
To perform knurling To perform facing
Feed is not working Knocking Vibration Feed is not working
Irregular surface Breakage Less tolerance Irregular dimensions
Thrust bearing is broken[L1] Chuck screw broken[L2] Excessive feed & speed[L3] Shaft pin loose [L4]
8 6 5 7 8 7 6 5 6 7 5 8 384 294 150 280 Boring M/c Bearing Gear box
To sustain the loading
Transmission
Wearing Tearing Vibration
Operational loss Loss in machining High cost losses
Free blade pulley damaged[B1] Blade sport bearing damaged[B2] Bearing and oil seal damaged[B3]
4 6 5 7 8 9 9 5 6 252 240 270 Tapping M/c Hydraulic system
To exert pressure Vibration Fail to operate
Unbalancing Pressure loss
Shocker damage[T1] Hydraulic pipe burst[T2]
4 3 7 8 4 6 112 144 Drilling M/c Multiple point tool
To drill the hole Tearing Notching
Eccentric in holes Tool life decreases
Unsteady operations[D1] High work load [D2]
5 7 8 9 7 8 280 504 Vertical Lathe M/c
Machine Oil pump Gear box Pump motor
To perform work To circulate the oil Transmission Power to Pump to circulate
Fail to operate Leakage Vibration, Knocking, Jamming Misalignment Pressure loss Locking Barrier in the continuous working
Motor burnt of rapid[V1] Oil seal damaged[V2] Inadequate greasing[V3] Improper selection of motor[V4]
3 4 5 3 5 6 8 5 9 8 7 6 135 192 280 90
Slotter M/c To make slots on the job
Feed is not working Fail to impart desired slots on the job
Fig 3. Input and Output Membership Function
The input membership function is divided into five criteria namely very low, low, moderate, high and very high in the Gaussian format whereas the output membership function in the triangular format are segregated into seven categories namely not critical, very low, low, moderate, high, very high, and critical.
Fig.4 Conditions of IF-THEN Rule
Fig.5 FRPN Output & Surface plot for potential cause L1
The Fuzzy Ranking Priority Number (FRPN) is obtained for all the machines along with the surface plot. Fig 5 Show the FRPN output for Lathe machine (L1) and also its surface plot. The red marking denotes the position of that of each parameter indicating the scaling value.
V.ANALYSIS OF RESULT
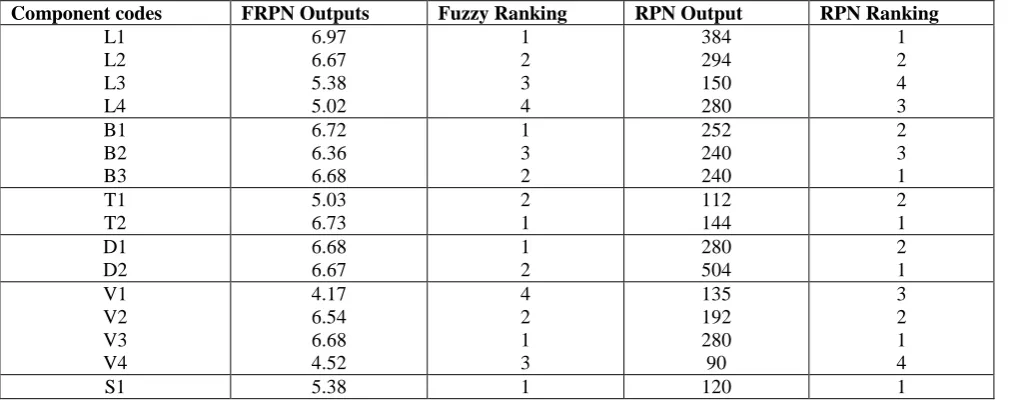
Component codes FRPN Outputs Fuzzy Ranking RPN Output RPN Ranking
L1 L2 L3 L4 6.97 6.67 5.38 5.02 1 2 3 4 384 294 150 280 1 2 4 3 B1 B2 B3 6.72 6.36 6.68 1 3 2 252 240 240 2 3 1 T1 T2 5.03 6.73 2 1 112 144 2 1 D1 D2 6.68 6.67 1 2 280 504 2 1 V1 V2 V3 V4 4.17 6.54 6.68 4.52 4 2 1 3 135 192 280 90 3 2 1 4
S1 5.38 1 120 1
FRPN Output obtained from simulation is ranked which detects the critical system in its own category and similarly RPN output is also evaluated from the FMEA sheet. A comparison is drawn between these two methodologies which shows the dynamic behaviour of the failure pattern as shown in Table.4. The machine L1 stands for a higher rank and thus more focus should be set on this machine for its better function. Similarly, in each section the rank decides the critical system.
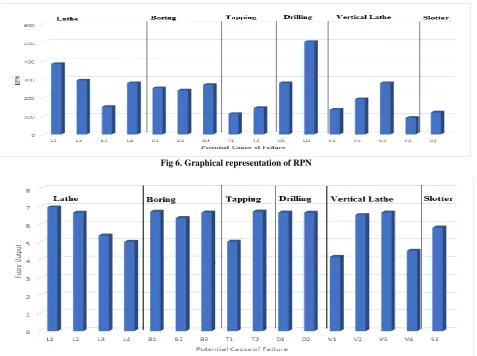
Fig 6. Graphical representation of RPN
Fig 7. Graphical representation of Fuzzy ranking
The graphical representation in fig 6 and 7 denotes the height of RPN and Fuzzy output corresponding to each component.The demarcation line separates each category in order to clearly differentiate the most critical machine that has to be focussed upon immediately. The comparison denotes slight variation in both ranking and thus the maintenance engineer has to study them and act according to the needs of the production plant.
VI.CONCLUSION
The term risk is a fact that cannot be completely eliminated from the system but can be measured and minimized. The present work is a risk analysis of centrifugal pump industry with in depth analysis for determining the failures occurring in the system.The comparison between FMEA and FRPN showcases the components with higher ranking that are to bedealt with utmost care and therefore careful investigation has to be followed for these components in all the areas.These results will be helpful to the system analyst to analyse the behaviour of the system and to plan an appropriate maintenance policy for improving the system performance. This effort will lead to an increase in efficiency and proper maintainability of the sub-systems which will be beneficial to the entire production line.
REFERENCES
1. Sodiya, A. S., Longe, H. O. D., & Fasan, O. M. “Software security risk analysis using fuzzy expert system”. INFOCOMP Journal of Computer
Science, Vol.7,3, pp. 70-77,2008.
2. Golmohammadi, R., Eshaghi, M., & Khoram, M. R. “Fuzzy Logic Method for Assessment of Noise Exposure Risk in an Industrial
Workplace”. International Journal of Occupational Hygiene, Vol.3,2, pp. 49-55,2011.
3. Singh, H., Singh, G., & Bhatia, N. “Election Results Prediction System based on Fuzzy Logic”. International Journal of Computer
Applications, Vol.53,9, pp.30-37, 2012.
4. Mahashwari, T., & Asthana, A. “Image enhancement using fuzzy technique”. International Journal of Research in Engineering Science and
Technology, Vol.2,2, pp.1-4,2013.
5. Mayilvaganan, M., & Rajeswari, K. (2014). “Risk Factor Analysis to Patient Based on Fuzzy Logic Control System.” International Journal of
Engineering Research and General Science, Vol.2,5, pp.185-190,2014.
6. Khaleghi, S., Karimi, S., Givehchi, S., & Zarkar, S. K. A. “Fuzzy Risk Assessment and Management in Process Industries-Case Study: Gas
Pipelines.”American Journal of Oil and Chemical Technologies, Vol.5,2, pp.163-177,2014.
7. Khalifa, S. S., Saadan, K., & Norwawi, N. M. “Risk Assessment of Mined Areas Using Fuzzy Inference”. International Journal of Artificial
Intelligence & Applications, Vol.6,2, pp. 37-15,2015.
8. Jariwala, N., & Christian, R. A. “Fuzzy Rule Based System Approach for the prediction of Respiratory Abnormalities in Solid Waste Workers.”,
Vol.4,1, pp.62-65,2015.
9. Doskočil, R., “An evaluation of total project risk based on fuzzy logic”, Verslas: Teorija ir praktika / Business: Theory and Practice, Vol.17,1,
pp. 23-31,2016.
10. Panchal, D., & Kumar, D.“Stochastic behaviour analysis of power generating unit in thermal power plant using fuzzy methodology”.Journal of
Loss Prevention in the Process Industries, Vol.53,1, pp.16-40,2016.
11. Mahto, D., & Kumar, A. “Application of root cause analysis in improvement of product quality and productivity”. Journal of Industrial
Engineering and Management, Vol.1,2, pp.16-53,2008.
12. Kiran, M., Mathew, C., & Kuriakose, J. “Root cause analysis for reducing breakdowns in a manufacturing industry”, Vol.3,1, pp.11-16,2013.
13. Sahoo, T., Sarkar, P. K., & Sarkar, A. K. “Maintenance optimization for critical equipments in process industries based on FMECA
Method”. International Journal of Engineering andInnovative Technology, Vol.3,10, pp.107-112,2014.
14. Rakesh, R., Jos, B. C., & Mathew, G. “FMEA analysis for reducing breakdowns of a Sub system in the life care product manufacturing
industry”. International Journal of Engineering Science and Innovative Technology, Vol.2,2, pp.218-225,2013.
15. Novák, V., & Lehmke, S. “Logical structure of fuzzy IF-THEN rules”. Fuzzy Sets and Systems, Vol.157,15, pp.2003-2029,2006.