Torsional Irregularity of Multi-storey
Structures
Rahila Thaskeen 1, Shinu Shajee 2
P.G. Student, Department of Civil Engineering, AWH Engineering College, Kuttikattor, Kerala, India1
Associate Professor, Department of Civil Engineering, AWH Engineering College, Kuttikattor, Kerala, India2
ABSTRACT: Damage reports on recent earthquakes have indicated that torsional motions often cause significant damage to buildings, at times leading to their collapse. The objective of this work aimed a better understanding of the torsional behaviour of building systems. In this analysis both symmetric and asymmetric structures with plan irregularity are compared. Symmetric structures have centre of mass coinciding with the centre of rigidity and the torsion effect in such structures occurs out of accidental eccentricity whereas in asymmetric structures have irregular distribution of mass and stiffness and its centre of mass and centre of rigidity do not coincide and hence causes the torsional effect on the structures which is one of the most important factor influencing the seismic damage of the structure. To assess the torsional effect on the structures in the present study 4 types of structures having same outer perimeter area are considered and strengthened by introduction of shear wall cores. A simple linear comparison based on eccentricity is also carried out for G+12 and G+17 structures. Structures with asymmetric distribution of mass and stiffness undergoes torsional motions during earthquake. The performance of the structures is assessed as per the procedure prescribe in IS 1893:2002 and ASCE 7-05. The analysis of the structural models is carried out using ETABS software.
KEYWORDS:Torsional irregularity, Plan asymmetry, Eccentricity, Shear wall core.
I. INTRODUCTION
The earthquakes are the most unpredictable and devastating among all natural disasters, it is very essential to identify the behaviour of buildings, especially their torsional behaviour during an earthquake. The real response of buildings during earthquake can in general be affected by the coupling of translational vibration with rotational vibration. If a three-dimensional dynamic analysis is performed as a part of the seismic design of the building, this coupled vibration including dynamic amplification effects can be estimated and used to guide the design.
Earthquake field investigations repeatedly confirm that irregular structures suffer more damage than their regular counterparts [1]. This is recognized in seismic design codes and restrictions on abrupt changes in mass and stiffness are imposed. Irregularities in dimensions affect the distribution of stiffness, and in turn affect capacity, while mass irregularities tend to influence the imposed demand. Irregular in dimensions is the main area of research.
Torsional responses in structures arise from two sources mainly. Eccentricity in the mass and stiffness distributions, causing a torsion response coupled with translation response. Wherein the torsion arises from accidental causes, including uncertainties in the masses and stiffness, the differences in coupling of the structural foundation with the supporting earth or rock beneath and wave propagation effects in the earthquake motions that give a torsion input to the ground, as well as torsion motions in the earth itself during the earthquake [2].
which is a fraction of the plan dimension, is considered in design to be on either side of the centre of stiffness. The design eccentricity edi to be used at floor is prescribed as,
edi = 1.5esi + 0.05bi
edi = esi - 0.05bi
whichever of these gives the more severe effect in the shear of any of the frame where; esi = Static eccentricity at floor i
defined as the distance between centre of mass and centre of rigidity, and bi = Floor plan dimension of floor i,
perpendicular to the direction of force [3].
The torsional irregularity is an important parameter which measures the extend of torsion effect on the structures. It can be interpreted as the ratio of maximum drift to the average drift of the individual story. Torsional irregularity should be considered when maximum story drift at one end of the structure transverse to an axis is more than 1.2 times the average of the story drift (or inter-story drifts) at the two ends of the structure. Δ1and Δ2 are the story
drift (or inter-story drifts) at the two ends of the structure respectively, then θ is the parameter criterion for torsion [4]. θ = Δ2 /
θ is calculated considering not only actual eccentricity. It is not convenient for engineers to determine θ at the beginning of the design. θ must be calculated through the global analysis of structure. The relative eccentricity is usually considered as the important factor influencing torsion effects.
The torsion effect on plan irregular structures are taken for investigation. The criteria for the torsion to occur in structures and detailed insight to the torsional effects are been investigated. The effect and role of eccentricity in the torsional response of the structure are studied. In this study, an analytical index derived based on generic response characteristics by the modelling and analysis that is being carried out in ETABS 2015 software. The index accounts for the multi directionality of earthquake motion as well as the asymmetry of the structure; hence it captures the true three-dimensional linear static and dynamic effects that govern the response of RC structures.
II. RELATEDWORK
Many research investigations have been carried out regarding the torsional effect of the multi-storey structures. Vipin Gupta and Dr. P.S. Pajgade [5] presented a review about the investigation done on torsional behaviour of multistory buildings with plan as well as vertical irregularities. It also focuses on codal provision made for torsion. From their investigation on reviews they concluded that the torsion is the most critical factor leading to major damage or completes collapse of building; therefore, it is necessary that symmetric buildings should also be analyzed for torsion. As result the buildings should be designed by considering the design eccentricity & accidental eccentricity. It was observed that the irregular profile buildings got larger forces and displacement as compared to regular one. Structures are never perfectly regular and hence the designers routinely need to evaluate the likely degree of irregularity and the effect of this irregularity on a structure during an earthquake.
Amin Alavi et al., [1] made an attempt to realise the seismic response of the structures, for various location of shear walls on RC building having re-entrant corners on high seismic zones. They studied a five storey building with six different shear wall locations They considered the accidental torsion of both negative and positive X and Y directions. The results proved that the structures are more vulnerable when they are more irregular, and also the eccentricities between centre of mass and centre of resistance are more significant to the torsional behaviour of structures during an earthquake.
Gunay ozmen [6] explained the conditions which cause torsional irregularity coefficient to exceed the upper bound value of 2 are investigated. A series of eight walled and framed sample structures with different structural shear wall configurations was chosen and their behaviour under earthquake loading were considered. It was found that torsional irregularity coefficient was maximum when the number of axes and number of stories are low. Also when structural walls are placed as close as possible to the gravity centres without coinciding them, the coefficient were found to be maximum.
free dynamic response. Also, concluded that the centres of resistance must be such that if the eccentricity is zero in all stories then the modes of vibration of the building uncoupled into purely torsional modes and purely translational modes. When centres of resistance do exist, they all lie in a vertical line and torsion free vibration is achieved when all storey centres of mass lie in that same line.
III.SEISMIC ANALYSIS OF STRUCTURE
Seismic Analysis is a subset of structural analysis and is the calculation of the response of a building structure to earthquakes. It is part of the process of structural design, earthquake engineering or structural assessment in regions where earthquakes are prevalent.
1)Equivalent Static analysis
Linear static analysis or equivalent static analysis can only be used for regular structure with limited height. All design against seismic loads must consider the dynamic nature of the load. However, for simple regular structures, analysis by equivalent linear static methods is often sufficient. This is permitted in most codes of practice for regular, low- to medium-rise buildings. It begins with an estimation of base shear load and its distribution on each story calculated by using formulas given in the code. The base shear is the total horizontal force on the structure which is calculated on the basis of structure mass and fundamental period of vibration and corresponding mode shape.
2)Response spectrum analysis
It is a representation of the maximum response of idealized single degree freedom system having certain period and damping, during earthquake ground motions. The maximum response plotted against undamped natural period, for various damping values, can be expressed in terms of maximum absolute acceleration, maximum relative velocity or maximum relative displacement. For this purpose, response spectrum case of analysis has been performed according to IS 1893. In the calculation of structural response (whether modal analysis or otherwise), the structure should be so represented by means of an analytical or computational model that reasonable and rational results can be obtained by its behaviour.
3)
Non-linear static analysisThis method is also known as push-over analysis. This method is an improvement over the linear static and dynamic analysis in the sense that it allows the inelastic behaviour of the structure. The method still assumes a set of static incremental lateral load over the height of the structure. It provides information on the strength, deformation and ductility of the structure and the distribution of demands. This permits to identify critical members likely to reach limit states during the earthquake, for which attention should be given during design and detailing process. The pushover analysis of a structure is a static nonlinear analysis under permanent vertical loads and gradually increasing lateral loads.
4)Non-linear dynamic analysis
A non-linear dynamic analysis or inelastic time history analysis describes the
actual behaviour of the structure during an earthquake. The method is based on the direct numerical integration of the motion differential equations by considering the elasto-plastic deformation of the structure element. This method captures the effect of amplification due to resonance, the variation of displacements at diverse levels of a frame, an increase of motion duration and a tendency of regularization of movements result as far as the level increases from bottom to top.
IV.DESCRIPTION OF MODELS
Details of Structures Storey height = 4.0 meters
Bay width along X-direction = 3.5 meters Bay width along Y-direction = 4.5 meters Beam-1 300x500
Shear wall- 230mm.
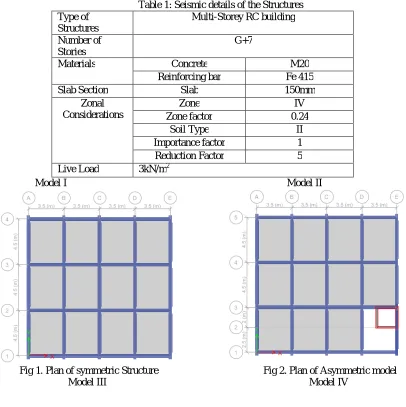
The Figures 1,2,3 and 4 shows the plan of the symmetric and asymmetric structures that are taken into consideration for the torsional analysis. The seismic details of the structures are tabulated in Table 1.
Table 1: Seismic details of the Structures Type of
Structures
Multi-Storey RC building
Number of Stories
G+7
Materials Concrete M20
Reinforcing bar Fe 415
Slab Section Slab 150mm
Zonal Considerations
Zone IV
Zone factor 0.24
Soil Type II
Importance factor 1
Reduction Factor 5
Live Load 3kN/m2
Model I Model II
Fig 1. Plan of symmetric Structure Fig 2. Plan of Asymmetric model
Fig 3. Plan of Asymmetric L shape Model Fig 4. Plan of Asymmetric C shape Model
From the torsional analysis carried out using ETABS 2015 and it was found that model IV(C shape) structure has shown the maximum torsional irregularity and strengthening was carried out for the same. Strengthening has done by introducing shear cores on either side of the structure. The plan of the structure is depicted in Figure 5.
Fig 5 Plan of strengthened model(model V)
V. RESULTS AND DISCUSSIONS
The linear static and response spectrum analysis for the models have been carried out using ETABS 2015 software[9]. The seismic details were incorporated in accordance to the IS code 1893:2002[3]. The torsional irregularity has been found in reference to ASCE-705[8]. The analysis were carried out in order to find the most torsional irregular structure on the basis of different torsion parameters.
1) Modes
Fig 6.Mode numbers and natural period of vibration
The ideal symmetric structure (model I) has shown the maximum natural period of 1.519 seconds and the lowest is found for the strengthened structure (model V) with 0.59 seconds, implying that the structure with higher period of vibration have low resistance to seismic actions. The symmetric structure has longer period of vibration because it is flexible (smaller stiffness k), no stiff elements are introduced for the model I ie staircase load, lift core etc, which in turn increases its flexibility whereas in case of Model V stiff elements like shear core has been introduced near the gravity centres of the structure and thus it is less flexible and will show high resistance to seismic actions. It is noted that more flexible longer period design may be expected to experience proportionately lesser accelerations than a stiffer building.
2) Eccentricity
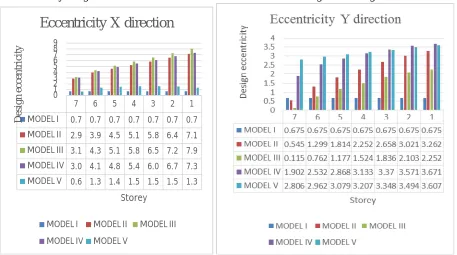
The eccentricity along X and Y directions of the five models are as shown in Figure 7 and Figure 8.
Fig 7. Design eccentricities in X direction Fig 8. Design eccentricities in Y direction
0 0.5 1 1.5 2
0 2 4 6 8 10 12 14 16 18 20 22 24 26 28 30 32
P
er
iod
(s
ec
)
Mode
Modes
model I model II model III model IV model V
7 6 5 4 3 2 1
MODEL I 0.7 0.7 0.7 0.7 0.7 0.7 0.7 MODEL II 2.9 3.9 4.5 5.1 5.8 6.4 7.1 MODEL III 3.1 4.3 5.1 5.8 6.5 7.2 7.9 MODEL IV 3.0 4.1 4.8 5.4 6.0 6.7 7.3 MODEL V 0.6 1.3 1.4 1.5 1.5 1.5 1.3
0 1 2 3 4 5 6 7 8 9
D
es
ign
e
cc
en
tr
ic
it
y
Storey
Eccentricity X direction
MODEL I MODEL II MODEL III
Larger the eccentricity between the centre of rigidity and centre of mass larger will be the torsional effect. While comparing X and Y direction Model IV have got more torsional tendency. It is because of the eccentricity between the load and the resistance, the floor experiences rotation along with translation, which in turn demands enhanced strength and ductility at certain part of the structure.
3) Torsional irregularity
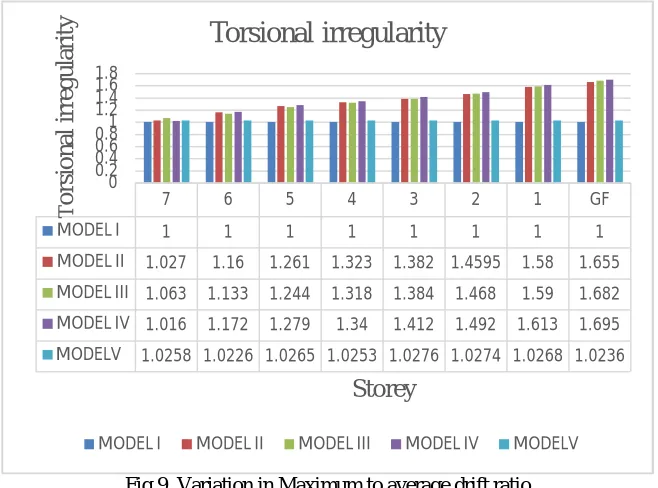
The torsional irregularity or drift ratios of models I to V are shown in Figure 9. From the graph it is evident that symmetric structure has got least percentage of variation of maximum to average drift ratio and similar maximum to average drift ratios are exhibited in all stories. Asymmetric structure of C shape exhibited maximum drift ratios and indicates it has got higher degree of irregularity. Therefore, strengthening has been carried out for the same. Models II, III and IV exhibited almost same range of irregularity, which implies that the structural elements that are being introduced also promote to the torsion effects. In case of model I no lift core, stair loads etc were introduced which in turn made the structure to have equal mass and stiffness distribution.
By introducing shear core for the Model IV it is seen that the torsional irregularity ratio has decreased tremendously due to the introduction of stiff elements which are capable of holding the structure against twisting or torsion and also it came within the code suggested ratio of 1.2.
Fig 9. Variation in Maximum to average drift ratio
4) Drift
Figure 10 and Fig 11 compares the drift of all the five models along both X and Y directions. The drift values do not exceed the permitted drift range which is suggested by IS 1893:2000 Cl 7.11.1[3].
Along X direction model I (ideal symmetric structure) has got higher drift value in all stories when compared with other structures. It has got the value of 0. 0.0013 in the second storey and hence the structure has a got a drift value which is within the limit prescribed by the code. The code recommends a maximum permitted drift value of 0.004H where H is the storey height(H=4m) and the permissible drift value is 0.016.
7 6 5 4 3 2 1 GF
MODEL I 1 1 1 1 1 1 1 1
MODEL II 1.027 1.16 1.261 1.323 1.382 1.4595 1.58 1.655 MODEL III 1.063 1.133 1.244 1.318 1.384 1.468 1.59 1.682 MODEL IV 1.016 1.172 1.279 1.34 1.412 1.492 1.613 1.695 MODELV 1.0258 1.0226 1.0265 1.0253 1.0276 1.0274 1.0268 1.0236
0 0.2 0.4 0.6 0.81 1.2 1.4 1.6 1.8
T
o
rs
io
n
al
i
rr
egul
ar
it
y
Storey
Torsional irregularity
Fig 10.Variation in drift along X-direction Fig 11.Variation in drift along Y-direction
Along Y direction model IV (C-shaped structure) holds the higher drift value of 0.00117and hence along Y direction the maximum drift value lies within the permissible limit of 0.016.
5) Storey displacements
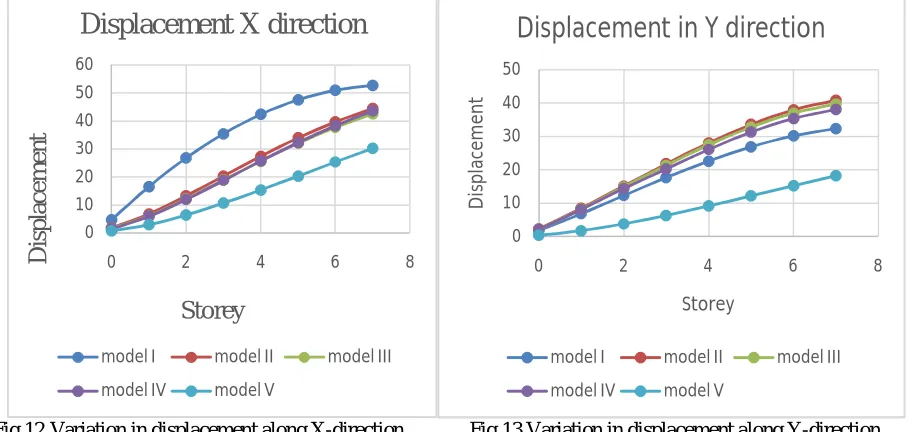
The storey displacements of all the five models are depicted in Figure 12 and Figure 13. It shows an increase in storey displacement along the height of the structure. Model I shows the maximum displacement along X direction followed by model II, IV and model III. The strengthened model V shows minimum displacement indicating the stiffness has increased.
Fig.12Variation in displacement along X-direction Fig 13.Variation in displacement along Y-direction
Storey displacement is the predicted movement of a structure under lateral loads, in medium rise structures, the higher the axial forces and deformations in the column and the accumulation of their effects over a greater height, all these
0 0.0002 0.0004 0.0006 0.0008 0.001 0.0012 0.0014
0 2 4 6 8
D
ri
ft
Storey
Drift X direction
Model I Model II Model III
Model IV Model V
0 0.0002 0.0004 0.0006 0.0008 0.001 0.0012 0.0014
0 2 4 6 8
D
ri
ft
Storey
Drift Y direction
Model I Model II Model III
Model IV Model V
0 10 20 30 40 50 60
0 2 4 6 8
D
is
pl
ac
e
m
e
n
t
Storey
Displacement X direction
model I model II model III
model IV model V
0 10 20 30 40 50
0 2 4 6 8
D is p la ce m e n t Storey
Displacement in Y direction
model I model II model III
causes the flexural component to become dominant. Apart from translational motion there is also floor rotation for displacement.
VI.COMPARISON OF STRUCTURE ALONG HEIGHT
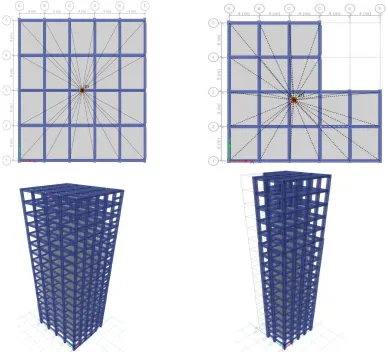
A symmetric plan structure having G+12 stories and G+17 stories and an asymmetric structure of L-shape having G+12 stories and G+17 stories are compared. The eccentricities of the structure along height are investigated which is the key parameter for the torsion effects in multi-storied structures. Figure 14 and figure 15 shows the plan and elevation of G+17 structure. A simple linear analysis has carried out using ETABS 2015 in order to obtain the eccentricities of G+12 and G+17 symmetric and L shape structure.
The actual torsion arises from the moment resulting from the eccentricity between the centres of mass at all floors above and including the given floor and the centre of rigidity of the vertical seismic elements in the storey below the given floor. From the analysis it became evident that the storey height(H=4m) considered is same along the height of the structure the variation of eccentricity along the height of the structure is found to be exactly the same for symmetric structure and for L-shape structure the eccentricity is found to be decreasing as the storey number increases in both X and Y directions in both G+12 and G+17 structures, whereas while comparing the eccentricity values of L and symmetric structure significant variation is visible. It is due to the plan asymmetry that adds to the variation in eccentricity.
In case of L-shape structure the centre of mass do not coincide with the centre of rigidity due to asymmetrical positioning of stiff elements with respect to stiffness. Horizontal irregularity is observed in structures only when there is irregular stiffness or mass distribution. So this thesis mainly focused on structures with different plan irregularities and stiffer elements like lift core etc. in the plan. Non-uniform distribution of stiff elements along the height of the structure and its effect can be studied as a future scope of this thesis
.
VII.CONCLUSION AND SCOPE OF WORK
The major conclusions drawn were:
1) From the analysed models, the estimated time period for first modes indicated that the strengthened model shown less vulnerability to seismic actions. Also, it can be concluded that flexible longer period design may be expected to experience proportionately lesser accelerations than a stiffer building.
2) The eccentricity shows the tendency of a structure for torsional effects. Model IV (C- shaped structure) had the maximum tendency for torsional effects with higher value of eccentricity.
3) The highest torsional irregularity ratio was found maximum for model IV which was the C shape structure and it is seen that the rigidity centre of model IV is concentrated outside the structure.
4) The drift and displacement values yielded values, indicating the dependence of the stiffness and mass concentration on the structure. Strengthened model yielded shorter-period which allowed smaller drift limits and longer-period structures that is the ideal symmetric structure allowed larger drift limits
5) From the study it became evident that though the outside perimeters of the structures (rectangular, L shape and C shape) were taken similar, significant variation was found in torsion parameters which regarded for the plan asymmetry and introduction of stiff elements.
6) In case of tall symmetric structures, for structures above ten stories the analysed results shown no effect of torsion as the design eccentricity remained constant along the height of the structure.
7)In case of tall asymmetric structure (L shaped structure), design eccentricity decreased from bottom to top of the structure which implied that it is the plan that brought the torsion, but significant changes was not seen as other parameters such as height, stiff elements etc were uniformly introduced along the height of the structure and significant variation in eccentricity can be found when the height of each storey is varied hence bringing stiffness and mass asymmetry.
VIII.SCOPE FOR FUTURE WORK
1) Non-linear analysis can be done using non-linear pushover analysis or non-linear time history analysis.
2) Parametric study of the structures by varying the storey height of the structure and its torsional effect can be studied. 3) The study of these structure can be modified by varying the span along both orthogonal directions.
4) The torsional effect can be studied by introducing flat slab for the same structures.
5) The study can be carried out on real structures and soil-structure interaction can also be investigated.
IX.ACKNOWLEDGEMENT
The author’s acknowledge Dr.Sabeena M.V., Head of the Department of Civil Engineering, AWH Engineering College, Kuttikkator, for providing the necessary facilities for the completion of this research work. The authors also extend gratitude to Dr. Vinayakam for the support for the successful completion of the project.
REFERENCES
[1] Amin Alavi and Prof.P.Srinivasa Rao(2013)," Influence of Torsional Irregularities of RC Buildings in High Seismic Zone". Australian Journal of Basic and Applied Sciences, 7(13).
[4] Nina ZHENG, Zhihong YANG ,Cheng SHI and Zhongren Chang(2004), “Analysis of Criterion for Torsional Irregularity of Seismic structures”. 13th World Conference on Earthquake Engineering,Vancouver, B.C., Canada,Paper No. 1465.
[5] Vipin Gupta and Dr. P.S. Pajgade(2015),” Torsional behavior of Multistorey Buildings with Different Structural Irregularities-A Review”.
International Journal of Research in Engineering, Science and Technologies (IJRESTs), ISSN 2395-6453, Vol 1.
[6] Gunay ozmen (2004), “Excessive torsional irregularity in multi-storey structures". Digest 2004,.
[7] R.Riddell and J.Vasquez(1984), “Existence of centres of resistance and torsional uncoupling of earthquake response of buildings”. Journal of Universidad Catolica de Chile, Santiago Chile.
[8] ASCE 7-05(2006).“Minimum design loads for buildings and other structures”, American Society of Civil Engineers, No. 7–05.
[9] ETABS 2015. Integrated software for Structural analysis,Design and Drafting of building system. Computers and Structures,Inc, Berkley. Version15.0.0. Build 1221, 2015.
BIOGRAPHY
1.NAME: RAHILA THASKEEN
AFFILIATION: P.G Student at Civil Engineering Department, AWH engineering college, Calicut, Kerala. SPECIFICATION: Structural Engineering, Civil Engineering
2.NAME: SHINU SHAJEE