ISSN(Online): 2319-8753 ISSN (Print): 2347-6710
I
nternational
J
ournal of
I
nnovative
R
esearch in
S
cience,
E
ngineering and
T
echnology
(An ISO 3297: 2007 Certified Organization)
Website: www.ijirset.com
Vol. 6, Issue 9, September 2017
Application of Grey Relation Analysis and
Fuzzy logics for Optimization of Abrasive Jet
Machining of Haste alloy
M.Shashikanth1, M.A.Gaffer2
Department of Mechanical Engineering JNTUH, Kukatpally, Hyderabad, TS, India1
Department of Mechanical Engineering, JNTUH, Kukatpally, Hyderabad, TS, India2
ABSTRACT:Process parameters optimization of multiple response characteristics of Abrasive jet machining on Hastelloy one of the most promising super alloy using Grey taguchi Fuzzy- Grey relational analysis is presented in this paper. Response characteristics such as MRR, and KERF are optimized during tha machining operation. Process parameters including pressure, Stand off distance,Nozzle diameter are investigated using Taguchi L09 orthogonal array. These response characteristics are studied and examined using Gray touchy and grey-fuzzy approaches and optimal combination of influential input parameters are discovered. Based on the results of verification experiments it is concluded that Taguchi, Fuzzy-Grey Relational Analysis can efficaciously be used to find the optimal combination of influential input parameters of AJM.
KEYWORDS : Fuzzy Grey relation,MRR,KERF,
I.INTRODUCTION
In this section it is discussed about optimization of Abrasive jet machining process parameters with a super alloy as working material. Hastelloy C276 is selected as work material for these experiments.
Numerous nickel-based steel combinations show high imperviousness to erosion, and Hastelloy is one of the best. Notwithstanding extraordinary imperviousness to all way of setting and splitting, parts produced using Hastelloy metal mixes tend to discover great use over an extensive variety of compound applications that may some way or another oxidize the metal. Extra components, for example, molybdenum and chromium round out the profile of a combination that is broadly viewed as one of the world's hardest metal alloy.
Abrasive jet machining is one of the variant and effective approach in non traditional machining process in which the metal removal takes place with the help of abrasion.
Table: 1. Chemical composition of Hastelloy C276
II. METHODOLOGY(Grey Relation Analysis)
ISSN(Online): 2319-8753 ISSN (Print): 2347-6710
I
nternational
J
ournal of
I
nnovative
R
esearch in
S
cience,
E
ngineering and
T
echnology
(An ISO 3297: 2007 Certified Organization)
Website: www.ijirset.com
Vol. 6, Issue 9, September 2017
used to analyze the multi- performances in experimental studies and has some advantages than statistical methods. When the experimental method cannot be carried out exactly, grey relational analysis helps to compensate for the shortcoming in statistical regression. Grey relation analysis is an effective means of analyzing the relationship between sequences with less data and can analyze many factors that can overcome the disadvantages of statistical method.
III. EXPERIMETATION
3.1.Selection of Process Parameters and Orthogonal Array
The parameters like Pressure, Standoff distance and Nozzle diameter are considered as variable parameters Abrasive flow rate and Abrasive grain size of particles are kept constant.
The variable levels that are considered based on the parameters are, for first variable pressure three levels are taken they are 4,6,8 and the units are(kg/cm2),for variable standoff distance three levels are taken(7,8,9nmm) , and for variable Nozzle diameter the three levels taken are (2,3,4 mm).The Abrasive flow rate is kept constant.
For conducting experiments Orthogonal array was designed according to Taguchi. The parameters of Abrasive Jet machining in this study are Pressure, Standoff Distance , and Nozzle diameter. Each parameter is taken for three levels.
Table 2. Shows input Parameters and Levels considered for experimentation Process Parameters Level 1 (Low) Level 2 (Medium) Level 3 (High)
PRESSURE 4 6 8
SOD 7 8 9
ND
in µs
2 3 4
From the taguchi orthogonal selector, we find that for four parameters and three levels an L9 Orthogonal array should be selected.
The selection of parameters for experimentation is done as per Fractional factorial design. An array for four controllable parameters is used to construct the matrix of three levels of controllable factors.
Minitab is used to generate the necessary fraction of experiments out of whole set of experiments possible with three factors at three levels.Table 2 indicates the details of touchy design of experiments based on L9 Orthogonal array and the method used for this is variable factorial method.
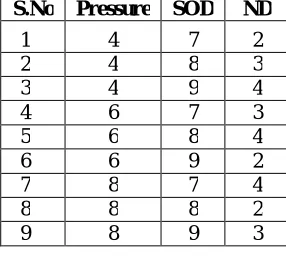
Table 3 . L9 Orthoganal array according to taguchi design of experiments for the corresponding levels of various Variables Factorial method
S.No Pressure SOD ND
1 4 7 2
2 4 8 3
3 4 9 4
4 6 7 3
5 6 8 4
6 6 9 2
7 8 7 4
8 8 8 2
ISSN(Online): 2319-8753 ISSN (Print): 2347-6710
I
nternational
J
ournal of
I
nnovative
R
esearch in
S
cience,
E
ngineering and
T
echnology
(An ISO 3297: 2007 Certified Organization)
Website: www.ijirset.com
Vol. 6, Issue 9, September 2017
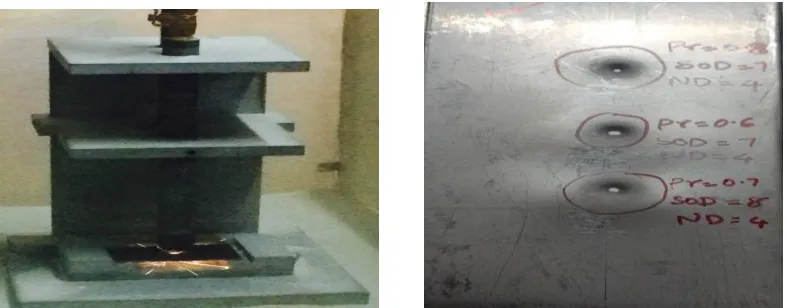
By considering the above input parameters experiments are carried out and Process parameters such as Material removal rate ,Kerf is calculated.
Fig 1 :Shows the machining of Hastelloy by using AJM and the Hastelloy machined based on L9 orthogonal array
Table 4. L9 Orthogonal Array Design of Experiments
S.No Pressure SOD ND MRR KERF
1 4 7 2 0.09187 1.5
2 4 8 3 0.06391 2
3 4 9 4 0.0956 2.5
4 6 7 3 0.057129 2
5 6 8 4 0.069821 2.2
6 6 9 2 0.0713 2
7 8 7 4 0.07178 2.5
8 8 8 2 0.065585 2
9 8 9 3 0.02094 2.5
3.2 Signal - To - Noise Ratio Calculation
ISSN(Online): 2319-8753 ISSN (Print): 2347-6710
I
nternational
J
ournal of
I
nnovative
R
esearch in
S
cience,
E
ngineering and
T
echnology
(An ISO 3297: 2007 Certified Organization)
Website: www.ijirset.com
Vol. 6, Issue 9, September 2017
i
Table 5 .Signal to Noise ratios for response variables
S NO PSNRA/MRR PSNRA/KERF
1 -18.93095251 -3.893140965
2 -24.65988611 -5.834942021
3 -21.42515285 -7.773142281
4 -25.89717826 -5.834942021
5 -21.31470555 -7.219769401
6 -23.70947186 -5.834942021
7 -23.65119338 -7.773142281
8 -24.69822024 -5.834942021
9 -31.77489329 -8.330115958
3.3 Grey Relational Generating & Grade Calculation
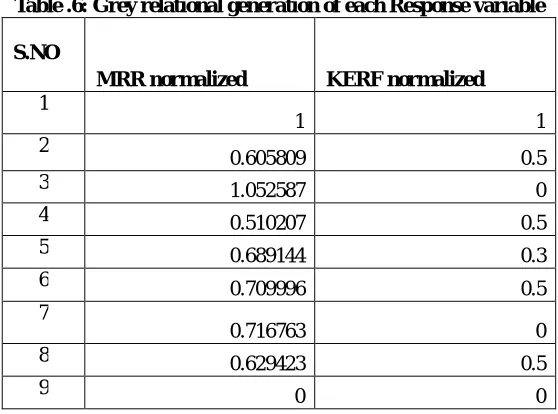
When the units in which performance is measured are different for different attributes, the influence of some attributes may be neglected. This may also happen if some performance attributes have a very large range. In addition, if the goals and directions of these attributes are different, this will cause incorrect results the analysis. It is thus necessary to process all performance values for every alternative into a compatibility sequence, in a process analogous to normalization. This processing is called grey relational generating in GRA
For Higher-the-better quality, normalizing data is calculated by
For Lower-the-better quality, normalizing data is calculated by
Where,
k = 1 to n, i = 1 to 9 ; “n” is the performance characteristic and “i” is the trial number x*i → is the sequence after data normalizing
x0i → is the original sequence
max x0i (k) → is the largest value of x0i (k)
ISSN(Online): 2319-8753 ISSN (Print): 2347-6710
I
nternational
J
ournal of
I
nnovative
R
esearch in
S
cience,
E
ngineering and
T
echnology
(An ISO 3297: 2007 Certified Organization)
Website: www.ijirset.com
Vol. 6, Issue 9, September 2017
i
Table .6: Grey relational generation of each Response variable
S.NO
MRR normalized KERF normalized
1
1 1
2
0.605809 0.5
3 1.052587 0
4 0.510207 0.5
5 0.689144 0.3
6 0.709996 0.5
7
0.716763 0
8 0.629423 0.5
9 0 0
The grey relational coefficient is calculated from the normalized experimental data to express the relationship between the ideal and the actual experiment.
I(k) for the Kth Performance characteristics in ith experiment is I(K) =(∆min +Ψ∆max)/(∆oi +Ψ∆max)
∆oi =׀׀x*0(k)- x*i(k) ׀׀
Δmin = min || x*0 (k) - x*i (k) ||
Δmax = max || x*0 (k) - x*i (k
Where,x*0 (k) is the reference sequence x*i (k) is the compatibility sequence is 0 to 1, in general = 0.5
Table .7: Grey relational Coefficient for each output parameter (Ψ=0.5) S NO
GRC of MRR GRC of KERF
1 1 1
2 0.559 0.5
3 1.118 0.333333
4 0.505 0.5
5 0.617 0.416667
6 0.633 0.5
7 0.638 0.333333
8 0.574 0.5
9 0.333 0.333333
The grey relational grade is computed by averaging the grey relational coefficients corresponding to each process response. The overall evaluation of the multiple process responses is based on the grey relational grade. High Grey relational grade gives the optimal solutions.
ISSN(Online): 2319-8753 ISSN (Print): 2347-6710
I
nternational
J
ournal of
I
nnovative
R
esearch in
S
cience,
E
ngineering and
T
echnology
(An ISO 3297: 2007 Certified Organization)
Website: www.ijirset.com
Vol. 6, Issue 9, September 2017
Where, yi is the grey relational grade and n is the number of performance characteristics.High grey relational grade gives the optimal conditions.
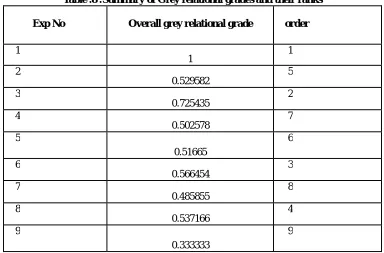
Table .8 :Summary of Grey relational grades and their ranks
Exp No Overall grey relational grade order
1
1 1
2
0.529582
5
3
0.725435 2
4
0.502578 7
5
0.51665
6
6
0.566454 3
7
0.485855
8
8
0.537166
4
9
0.333333
9
From table, it is observed that the experiment no. 8 has the highest grey relational grade. The levels of machining characteristics in the above experiment are Material Removal Rate (0.0918 g/s), Kerf (1.5 mm) .
Table.9 : Response table for Grey Relational Grades
Level PRESSURE SOD ND
1 0.4026 0.4752 0.6818
2 0.6701 0.6071 0.4813
3 0.5620 0.5524 0.4716
Delta 0.2675 0.1319 0.2102
Rank 1 3 2
However, the relative importance among the machining parameters for the multiple performance characteristics still needs to be known, so that the optimal combinations of the machining parameter levels can be determined more accurately. The main effect plot of GRG is drawn. The ordinate of it represents the means of grey relational grade calculated using larger - the - better criteria.
ISSN(Online): 2319-8753 ISSN (Print): 2347-6710
I
nternational
J
ournal of
I
nnovative
R
esearch in
S
cience,
E
ngineering and
T
echnology
(An ISO 3297: 2007 Certified Organization)
Website: www.ijirset.com
Vol. 6, Issue 9, September 2017
Graph .1:Main effect plot of means
7 5 3 0.70
0.65
0.60
0.55
0.50
0.45
0.40
9 8
7 1 2 3
PRESSURE
M
e
a
n
o
f
M
e
a
n
s
SOD ND
Main Effects Plot for Means Data Means
3.4 Grey Fuzzy Logic Analysis:
In fuzzy logic system, the fuzzifier uses the membership functions to fuzzify Grey Relational Coefficient (GRC) of each performance characteristic. The inference engine (Mamdani fuzzy inference system) performs fuzzy reasoning with fuzzy rules to generate a fuzzy value. These fuzzy rules are presented in the form of if-then control rule. For each rule, the three inputs are assigned in the fuzzy subsets of Low, Medium and High and the corresponding membership functions, µx1, µx2 and µx3, respectively.
The output is assigned to any of the Five fuzzy subset (Very Low, Low, Medium, High, Very High) membership functions µY. Fuzzy rules are directly derived based on the fact that larger-the- better characteristic. By tracking maximum- minimum compositional operation, the fuzzy reasoning of these rules yields a fuzzy output. Finally, the defuzzifier converts fuzzy predicted value into a GFRG (Grey Fuzzy Reasoning Grade).
Graph.2:Selection of inputs and outputs in Fuzzylogics
ISSN(Online): 2319-8753 ISSN (Print): 2347-6710
I
nternational
J
ournal of
I
nnovative
R
esearch in
S
cience,
E
ngineering and
T
echnology
(An ISO 3297: 2007 Certified Organization)
Website: www.ijirset.com
Vol. 6, Issue 9, September 2017
Graph .3: Grade attainment in Fuzzy logics (Matlab)
Table .10. Overall Grey Fuzzy Reasoning Grade (GFRG)
Exp no Overall Grey Fuzzy
Reasoning Grade
Order
1
0.92 1
2 0.539 5
3 0.561 3
4 0.504 7
5 0.516 6
6 0.576 2
7 0.489 8
8 0.547 4
9 0.39 9
From table it is observed that the experiment no. 1 has the highest grey relational grade. The levels of machining characteristics in the above experiment are Material Removal Rate(0.09187 kg/cm2 ),Kerf ( 1.5 mm )
ISSN(Online): 2319-8753 ISSN (Print): 2347-6710
I
nternational
J
ournal of
I
nnovative
R
esearch in
S
cience,
E
ngineering and
T
echnology
(An ISO 3297: 2007 Certified Organization)
Website: www.ijirset.com
Vol. 6, Issue 9, September 2017
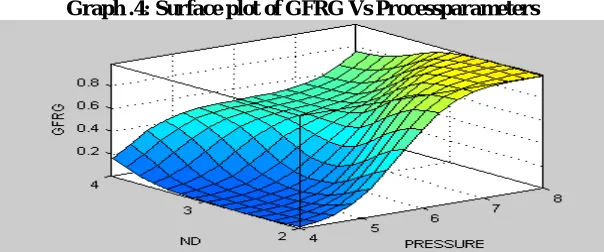
Graph 5:Scatter plot of GFRG Vs Exp No
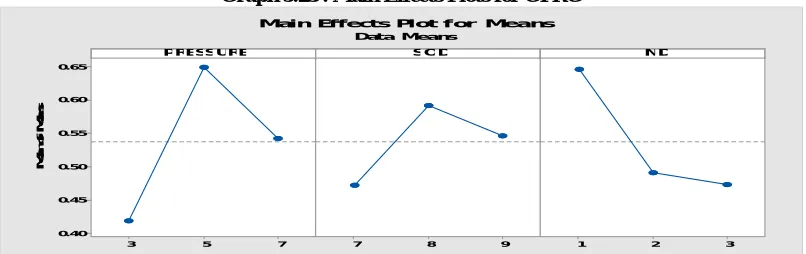
The relative importance among the machining parameters for the multiple performance characteristics still needs to be known, so that the optimal combinations of the machining parameter levels can be determined more accurately. The mean response table for overall GFRG is shown in the table . and is represented in figure , The ordinate of it represents the means of grey fuzzy reasoning grade calculated using larger - the - better criteria.
Table 11. Response table for Grey Relational Grades
Level PRESSURE SOD ND
1 0.4193 0.4730 0.6463
2 0.6493 0.5917 0.4917
3 0.5430 0.5470 0.4737
Delta 0.2300 0.1187 0.1727
Rank 1 3 2
Based on the table Pressure,SOD,ND are the parameters which highly affect the responses of the study such as MRR, KERF.
Graph 5.23 . Main Effects Plots for GFRG
7 5
3 0.65
0.60
0.55
0.50
0.45
0.40
9 8
7 1 2 3
P RESSURE
M
ea
n
o
f
M
ea
n
s
SOD ND
Main Effects Plot for Means Data Means
ISSN(Online): 2319-8753 ISSN (Print): 2347-6710
I
nternational
J
ournal of
I
nnovative
R
esearch in
S
cience,
E
ngineering and
T
echnology
(An ISO 3297: 2007 Certified Organization)
Website: www.ijirset.com
Vol. 6, Issue 9, September 2017
IV. CONFIRMATION OF RESULTS
The confirmation test for the optimal parameters with its levels was conducted to evaluate quality characteristics for AJM of Glass. From the grey relational analysis shows the highest GRG indicating the initial process parameter set of (A3 B2 C2) for the best multiple performance characteristics among the nine experiments.
The optimal grey relational grade (GRGopt) is predicted by using the following equation:
Where GRGmean is the average of Grey relational grade, GRGi is the average of grey relational analysis at optimum level and n is the significantly affecting process parameters. The predicted value of optimal grey relational grade is expressed by taking n = 3 since there are four significant parameters.
The predicted value of optimal Grey Relational Grade is calculated as : GRGopt = 0.5448 + (0.6701 - 0.5448) + (0.6071- 0.5448) +(0.6818-0.5448)
= 0.8694
Table 12. Experimental and predicted values of GRG
Similarly the confirmation of results is done to GFRG. From the fuzzy logic, shows the highest GFRG indicating the initial process parameter set ( A2 B2 C2 D1) for the best multiple performance characteristics. The predicted process parameter set is ( A2 B2 C2 D1).
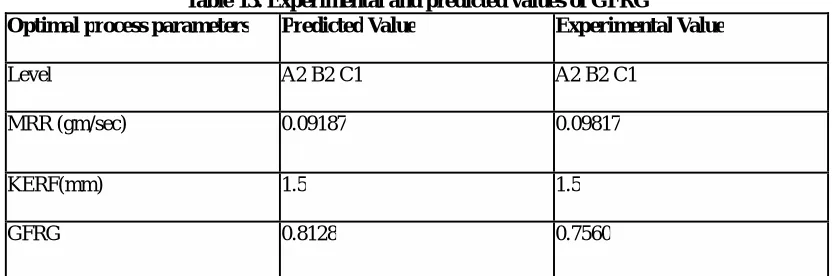
Table 13. Experimental and predicted values of GFRG
Optimal process parameters Predicted Value Experimental Value
Level A2 B2 C1 A2 B2 C1
MRR (gm/sec) 0.09187 0.09817
KERF(mm) 1.5 1.5
GFRG 0.8128 0.7560
From the Experimental and predicted value tables of Grey relational grade and GFRG for optimal process parameters, we observe that the experimental values of both the GRG and GFRG are near to their respective predictive values
Optimal process parameters Predicted Value Experimental Value
Level A2 B2 C3 A2 B2 C3
MRR (gm/sec) 0.9187 0.887
KERF(mm) 2.92 2.7
ISSN(Online): 2319-8753 ISSN (Print): 2347-6710
I
nternational
J
ournal of
I
nnovative
R
esearch in
S
cience,
E
ngineering and
T
echnology
(An ISO 3297: 2007 Certified Organization)
Website: www.ijirset.com
Vol. 6, Issue 9, September 2017
obtained by using Grey relational analysis and Fuzzy logic, hence we confirm that the results obtained through grey relational analysis and Fuzzy logic are correct and AJM of Glass is successfully optimized.
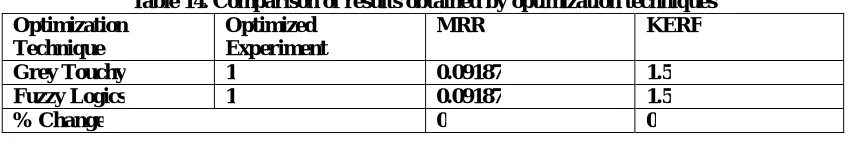
4.1 Comparison of Results obtained by Grey taguchi method and Fuzzy logic
According to Grey taguchi technique we obtained experiment number 5 as the optimized experiment. But when we applied fuzzy logic we obtained experiment number 5 as the optimized experiment. By the application of Fuzzy logic there is 4 6 . 7 8 % reduction in Material removal Rate,and 29.54% reduction in Kerf.
Table 14. Comparison of results obtained by optimization techniques Optimization
Technique
Optimized Experiment
MRR KERF
Grey Touchy 1 0.09187 1.5
Fuzzy Logics 1 0.09187 1.5
% Change 0 0
V.CONCLUSIONS
The conclusions derived from the grey‐fuzzy logic approach in optimizing machining parameters in drilling of Hastelloy C276 are as follows.Experiments are performed based on L9 OA chosen using Taguchi’s DoE and analysis is done using grey relational analysis and fuzzy logic approach for optimizing multiple per‐formance characteristics viz. MRR and KERF.
Grey‐fuzzy reasoning grade is acquired to evaluate the multiple responses with the available 27 sets of framed rules, which shows an improvement when compared with the obtained grey relational grade, thereby reducing the fuzziness. The optimum level of input control parameters obtained are Pressure 8 kg/cm2,SOD is 8mm and the nozzle diameter is 2mm. Interaction plot shows that, a significant level of interaction exists between all the input parameters over each other. The results of GRG and GFRG are compared and found that the values of the both relation grading values are matching.
REFERENCES
[1] Kalpakjian, S., Schmid, S.R. (2009). Manufacturing Engineering and Technology , 6th edition, Prentice -Hall, USA.
[2] Smith, T.T. (2008). Cutting Tool Technology – Industrial Handbook , Springer -Verlag London Limited, UK.
[3] Tamizharasan, T., Senthilkumar , N. (2012). Analysis of surface roughness and material removal rate in turning using Taguchi’s technique, In: Proceedings of IEEE –
International Conference on Advances in Engineering, Science and Management , EGS Pillay Engineering College, Nagapattinam, 231-236. [4] Ramaiah, P.V., Rajesh, N., Reddy, K.D. (2013). Determination of optimum influential parameters in turning of Al6061 using fuzzy logic, International Journal of Innovative Research in Science, Engineering and Technology , Vol. 2, No. 10, 5555 -5560.
[5] Hashmi, K., Graham, I.D., Mills, B. (2003). Data selection for turning carbon steel using a fuzzy logic approach, Journal of Materials Processing Technology , Vol. 135, No. 1, 44 -58, do i: 10.1016/S0924-0136(02)01011 -7
[6] Cabrera, F.M., Beamud, E., Hanafi, I., Khamlichi, A., Jabbouri, A. (2011). Fuzzy logic -based modeling of surface roughness parameters for CNC turning of PEEK CF30 by TiN -coated cutting tools, Journal of Thermoplastic Com-posite Materials , Vol. 24, No. 3, 399 -413, doi: 10.1177/0892705710391562