Abused Children. (Under the direction of Dr. Mary Haskett).
Research has shown that physically abused children display social information processing deficits that are related to their high levels of externalizing behavior problems; however, research has yet to determine the factors that may buffer this relation between social information processing deficits and externalizing behavior problems. The present study attempted to address this gap in the literature by examining whether emotion regulation served as a moderator for the relation between social information processing and
externalizing behavior problems of 62 physically abused kindergarteners. Multiple measures of each construct of interest were used, including teacher reports and playground
observations as measures of externalizing behavior problems; responses to hypothetical peer problems as the measure of social information processing; and teacher reports and behavioral observations as measures of emotion regulation. A total of 12 moderation models were conducted and two supported moderation, however simple slopes analyses indicated a different set of relations between constructs in each. Furthermore, predictors of the outcome variables were examined with emotion regulation significantly predicting externalizing behavior problems. Specifically, positive correlations were found between teacher reports of regulation and both measures of externalizing behavior problems, and a negative correlation was found between the behavioral regulation task and teacher reports of children’s
Jessica Laraine Loehman
A thesis submitted to the Graduate Faculty of North Carolina State University
in partial fulfillment of the requirements for the degree of
Master of Science
Psychology
Raleigh, North Carolina
2012
APPROVED BY:
_________________________________ ______________________________ Shevaun D. Neupert, Ph.D. Scott Stage, Ph.D.
________________________________ Mary Haskett, Ph.D.
Biography
Table of Contents
List of Tables……….. v
List of Figures………. vii
Introduction………. 1
Externalizing Problems of Maltreated Children………. 3
Social Information Processing and Abused Children………. 6
Social Information Processing Model………. 6
Social Information Processing of Physically Abused Children..……… 9
Emotion Regulation as a Moderator……… 12
Emotion Regulation of Abused Children……… 13
Current Study……….. 17
Hypotheses……….. 19
Method……… 20
Participants……….. 20
Procedure……… 22
Measures………. 23
Externalizing Problem Behaviors………... 23
Child Behavior Checklist-Teacher Report Form (CBCL-TRF) & Caregiver Teacher Report Form (C-TRF)……….. 23
Playground Observation……….. 25
Social Information Processing………. 26
Emotion Regulation……… 28
Puzzle Box……….. 28
Behavior Rating Inventory of Executive Functioning (BRIEF). 29 Results………. 30
Preliminary Analyses: Descriptives and Covariates………... 30
Primary Hypotheses: Tests of Moderation………. 32
Secondary Hypotheses: Predictors of Externalizing Behaviors……….. 35
Post hoc Analyses……… 36
Discussion……… 75
Predictors of Behavioral Outcomes……… 80
Post hoc Analyses……… 83
Limitations and Future Directions……….. 85
Conclusion……….. 86
List of Tables
Table 1 Distribution of Study Variables……… 39 Table 2 Skew and Kurtosis of Study Variables……… 41 Table 3 Correlation coefficients of relations between possible covariates and
dependent variables………. 43
Table 4 Results of regression model of emotion regulation (as measured by the BRIEF) and hostile attribution bias predicting CBCL-TRF externalizing
scores (n = 56)………. 44
Table 5 Results of regression model of emotion regulation (as measured by latency to cheat) and aggressive response generation predicting inappropriate social behaviors on the playground (n = 54)………. 46 Table 6 Results of regression model of emotion regulation (as measured by the
BRIEF) and hostile attribution bias predicting inappropriate social behavior
on the playground (n = 55)……… 48
Table 7 Results of regression model of emotion regulation (as measured by the BRIEF) and aggressive response generation predicting CBCL-TRF
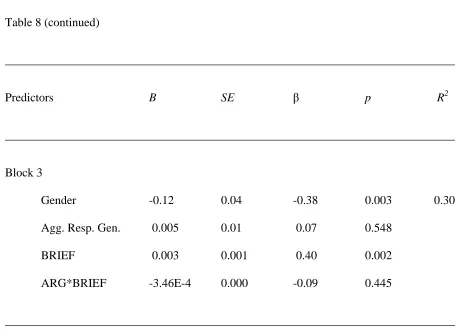
externalizing scores (n = 56)……… 50 Table 8 Results of regression model of emotion regulation (as measured by the
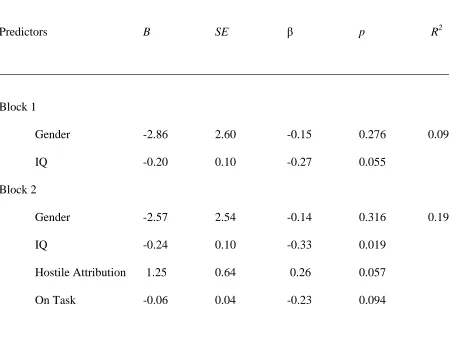
BRIEF) and aggressive response generation predicting inappropriate social behaviors on the playground (n = 55)……… 52 Table 9 Results of regression model of emotion regulation (as measured by time spent
on task) and hostile attribution bias predicting CBCL-TRF externalizing
scores (n =52)……… 54
Table 10 Results of regression model of emotion regulation (as measured by time spent on task) and hostile attribution bias predicting inappropriate social behaviors
on the playground (n =54)……… 56
Table 11 Results of regression model of emotion regulation (as measured by time spent on task) and aggressive response generation predicting CBCL-TRF
Table 12 Results of regression model of emotion regulation (as measured by time on task) and aggressive response generation predicting inappropriate social behaviors on the playground (n =54)……… 60 Table 13 Results of regression model of emotion regulation (as measured by latency to cheat) and hostile attribution bias predicting CBCL-TRF externalizing scores
(n =52)………. 62
Table 14 Results of regression model of emotion regulation (as measured by latency to cheat) and hostile attribution bias predicting inappropriate social behaviors on
the playground (n = 54)……….. 64
Table 15 Results of regression model of emotion regulation (as measured by latency to cheat) and aggressive response generation predicting CBCL-TRF
externalizing scores (n = 52)……… 66 Table 16 Regression results of predictors of externalizing behaviors as measured by the
CBCL-TRF controlling for gender and IQ………. 68 Table 17 Regression results of predictors of inappropriate social behavior on the
playground controlling for gender……….. 69 Table 18 Results of regression model of emotion regulation (as measured by BRIEF)
List of Figures
Figure 1 Moderating effect of BRIEF emotion regulation on relation between hostile attribution bias and CBCL-TRF externalizing problems……… 72 Figure 2 Moderating effect of latency to cheat on relation between aggressive response
generation and inappropriate social behaviors on the playground…… 73 Figure 3 Moderating effect of BRIEF emotion regulation on relation between hostile
Moderating Effects of Emotion Regulation on the Relation between Social Information Processing and Externalizing Symptoms of Physically Abused Children
Results from previous research demonstrate that children with a history of physical abuse are more likely than non-abused children of similar socioeconomic status to display externalizing problem behaviors, such as aggression and defiance (e.g. Eckenrode, Laird, & Doris, 1993; Mueller & Silverman, 1989; Teisl & Cicchetti, 2008). Furthermore, these externalizing problem behaviors have shown to be fairly stable throughout childhood (Bilancia & Rescorla, 2010; Bub, McCartney, & Willett, 2007; McMahon, 1994). The
stability of externalizing problem behaviors points to the need for early intervention efforts to stop negative behavior patterns in children before they become stable and resistant to change. However, prior to developing effective early intervention programs for the externalizing problem behaviors of physically maltreated children, researchers must first identify the factors that contribute to these problems.
Specifically, physically maltreated children tend to make many cognitive errors in the processing of social information, and these errors in turn, are linked to their maladaptive behavior patterns. However, not all maltreated children who experience errors in social information processing show high levels of aggressive behavior, suggesting that some of these children may have a buffer that protects them from developing poor patterns of social relations (Cicchetti & Lynch, 1995).
Previous researchers have provided evidence that the ability to appropriately regulate behavior and emotion may buffer the expression of externalizing behavior problems in children. In one study, Eisenberg, Sadovsky, et al. (2005) explained that “…children who are prone to anger but also well regulated might not exhibit highly unmodulated emotion and problem behaviors…” (p. 194). In other words, strong emotion regulation skills may buffer against the expression of externalizing problem behaviors that can result from negative emotionality, increasing the likelihood that children will have high levels of social competence (Eisenberg, Sadovsky, et al., 2005).
behaviors. Thus, adaptive emotion regulation may have buffered the effect of poor social information processing on the expression of externalizing problem behaviors in Orobio de Castro et al.’s (2005) sample. The purpose of the present study was to further explore the potential for emotion regulation to serve as a buffer for externalizing problem behaviors by examining if emotion regulation moderated the relation between social information
processing and externalizing problems among children with a history of physical abuse. However, unlike previous research (Orobio de Castro et al., 2005; Teisl & Cicchetti, 2008) that examined these constructs individually, the present study examined the interactive influences of emotion regulation and social information processing.
Externalizing Problems of Maltreated Children
behavior problems is thought to be related to the parenting practices present in the
maltreating environment. Heller, Baker, Henker, and Hinshaw (1996) suggest that “…poor parental adaptation is predictive of the continuation and perhaps even the onset of child behavior problems… Parental adaptation is thought to influence the child’s development through impact on parental availability, support, parenting practices, and overall family climate.” (p. 377). When this relation between parenting practices and externalizing problem behaviors was tested a significant relation was found, indicating that poor parenting practices increased the likelihood that children would express externalizing problem behaviors (Heller et al., 1996). Findings supporting this relation between parenting practices and externalizing problem behaviors in children have been replicated in many studies (e.g., Luyckx et al., 2011; Renk, 2011), including investigations focused on links between parenting of abusive parents and adjustment of their children (e.g., Haskett & Willoughby, 2006).
that externalizing behavior problems at age 3 strongly predicted externalizing behavior problems at age 12. Although some young aggressive children will not demonstrate a life-course persistent pattern of aggression, many children who display high levels of
externalizing problem behaviors during young childhood are likely to continue to display these problems throughout late childhood and into adolescence (Powell, Lochman, & Boxmeyer, 2007).
It is important to understand early externalizing behavior problems because they are related to deficits in peer relations. It has been shown that young physically abused children tend to display heightened levels of physical and verbal aggression in peer relations, which is predictive of peer distress and peer avoidance of interactions with maltreated children
(Cicchetti & Lynch, 1995; Mueller & Silverman, 1989). Difficult peer relations are one of the most robust predictors of later adjustment problems. Therefore, it is important to examine the externalizing problem behaviors of young maltreated children and the factors that
influence them, in order to contribute to early intervention for these high risk children. Such was the purpose of the present investigation.
In summary, the externalizing problems that characterize many children with a history of physical abuse tend to be associated with a host of negative long-term
et al., 1995; Teisl & Cicchetti, 2008) and emotion regulation (Kim & Cicchetti, 2010; Teisl & Cicchetti, 2008) may be influential factors for the development of externalizing problem behaviors in maltreated children. However, no studies have examined the interaction between these factors as predictors of children’s adjustment; thus, the present study was designed to further examine these factors by investigating the effects of emotion regulation on the relation between the social information processing and externalizing problem behaviors of physically abused children. To establish a basis for this study, the social information
processing model will be outlined with implications for abused children explained, followed by a discussion of the role of emotion regulation in externalizing problem behaviors and the emotion regulation of abused children. Justification for the present moderation models will then be provided.
Social Information Processing and Abused Children
Social information processing model
clarification of goals, response access, response decision, and behavioral enactment (Crick & Dodge, 1994). According to the social information processing model, children selectively attend to relevant situational and emotional cues of social interactions, such as facial expressions and tone of voice, that guide them in selecting an appropriate behavioral response. While encoding social cues, children simultaneously interpret these cues to evaluate causation, meaning, and the possible attainment of personal goals within the social situation (Crick & Dodge, 1994; Dodge et al, 1986). After interpreting social cues, children then select a goal or intended outcome for the social interaction, such as gaining toys or making a new friend (Crick & Dodge, 1994). Once children have selected a goal for the social exchange, they access possible responses to the social situation based on past experiences, or create new responses if the situation is novel. Children then evaluate the accessed responses and select the one viewed as the most positive based on expected outcomes of the response and self-efficacy in performing the behavior. Finally, children enact the behavioral response chosen and then repeat the cycle of social information
processing throughout the remainder of the interaction (Crick & Dodge, 1994; Dodge et al., 1986).
of information processing, with schemas and emotions having the most profound effects (Crick & Dodge, 1994; Orobio de Castro, et al, 2005; Lemerise & Arsenio, 2000). Schemas allow children to automatically apply past experiences to response decision in the current social exchange when they are overwhelmed with social stimuli. Although schemas can help with the efficiency of information processing, they can also contribute to judgment and reasoning errors, leading to problematic or inappropriate behavior (Crick & Dodge, 1994). For example, a child who experiences physical abuse that is preceded by aloof behavior from others may develop a schema in which aloof behavior from others results in physical harm. This negative schema regarding aloof behavior may in turn lead the child to inappropriately perceive aloof behaviors from peers as threatening – a process known as hostile attribution bias.
resort to avoidance or hostile goals to reduce their arousal. Conversely, children who are able to appropriately regulate their emotions are more likely to select prosocial goals and generate more socially competent responses (Lemerise & Arsenio, 2000). The predicted emotional reactions of peers are also related to response evaluation and decision, in that well-regulated children who perceive a behavioral response to be evaluated negatively by their peer will tend to suppress that response and substitute it for one that the peer will perceive more positively (Crick & Dodge, 1994). Thus, emotion regulation may moderate the relation between social information processing and externalizing problem behaviors in children.
Social information processing of physically abused children
The social information processing model put forth by Dodge et al. (1986) and later revised by Crick and Dodge (1994) was initially developed to account for the behavior of aggressive children. Because physically abused children demonstrate high rates of
aggressive responses as favorable (Orobio de Castro et al., 2005; Teisl & Cicchetti, 2008). Although these studies show robust differences between maltreated and non-maltreated children in social information processing, it is important to note that there are individual differences in social information processing within samples of maltreated children (Haskett & Willoughby, 2006; Teisl & Cicchetti, 2008; Weiss et al., 1992).
Similar to the pattern of research findings based on non-abused children, the social information processing errors that physically abused children make within each step of the social information processing model have been linked to the maladaptive behaviors they express in social situations. Weiss et al. (1992) examined the effects of abuse, as defined by parent report of high levels of harsh physical discipline (e.g., slapping, spanking), in a community sample of preschool parents and found that high levels of parent reported harsh discipline were related to greater processing biases and difficulties, specifically inattention to relevant social cues, generation of aggressive responses, and hostile attribution biases. These social information processing biases and deficits were then related to higher levels of
aggression and this path from social information processing to aggression was found to be significant (Weiss et al., 1992). In a later study, Dodge et al. (1995) tested the mediating effects of encoding errors and aggressive response access in the link between children’s history of physical harm and externalizing problems and found that these problems in social information processing accounted for 33% of the effect of physical harm on conduct
processing patterns of physically abused children partially accounted for the relation between physical abuse and children’s aggression. Thus, there is strong empirical evidence for the role of social information processing errors in the relation between physical abuse and externalizing problem behaviors. However, there are individual differences in the social information processing patterns of abused children and not all abused children express these deficits (Haskett & Willoughby, 2006; Teisl & Cicchetti, 2008; Weiss et al., 1992).
the relation between social information processing and externalizing problem behaviors. Therefore, the present study examined emotion regulation as a moderator for the relation between social information processing and externalizing problem behaviors.
Emotion Regulation as a Moderator
According to Shipman et al. (2007), emotion regulation can be defined as the “ability to monitor, evaluate and modify emotional experience or expression in accordance with the demands of the social environment” (p. 269). Effective emotion regulation is particularly important for school-age children, as teachers report that emotional maturity, self-regulation, and prosocial behavior are important competencies for success in kindergarten (Stormont, Beckner, Mitchell, & Richter, 2005). Children are expected to effectively self-regulate emotional experience independently by the time they reach preschool and research indicates that children who do not develop effective self-regulation strategies are at increased risk for behavioral problems (e.g. Egeland, Yates, Appleyard, & Van Dulmen, 2002).
To illustrate this link between emotion regulation and behavior problems, Mullin and Hinshaw (2007) found that poor regulation of emotional responses – particularly
during which children are required to assemble a puzzle housed in a box without looking at the puzzle. The results of this study indicated that children rated by parents and teachers as high in externalizing problems tended to be under-regulated and more impulsive than control and internalizing children (Eisenberg et al., 2001). In summary, a significant literature indicates that emotion dysregulation and problem behavior puts children at risk for failure in the transition to kindergarten; alternately, children who are well-regulated tend to have fewer behavior problems and experience greater success in the early school years.
Emotion regulation of abused children
Children learn how to regulate their emotions, at least in part, from interactions with their parents. According to the model of parental socialization of emotion put forth by Eisenberg, Cumberland, and Spinrad (1998), parents influence children’s emotion-related behaviors through discussions of emotions with their children, their own reactions to their children’s emotions, and the degree to which they encourage emotional expressivity in the family. According to Halberstadt and Eaton (2002), parents also contribute to their children’s healthy emotion development through the degree to which they openly display expression of
emotions. Socialization practices can also include teaching children how to label and interpret emotions, how to appropriately express emotion, and how to manage emotional arousal (Shipman & Zeman, 2001). Therefore, parents can foster the development of healthy emotion regulation in their children by openly discussing emotional states and how to
(Eisenberg et al., 1998). Additionally, supportive parental responses to children’s expression of emotion enhances children’s internalization of effective emotion regulation strategies and skills, such as coping with distress and enacting socially acceptable expressions of emotion.
A few investigators have examined the relation between emotion regulation and behavioral responses of maltreated children in an attempt to explain why these children express behavioral difficulties. For example, one study showed an association between experiences of negative affect and manifestations of aggression and externalizing behavior, such that maltreated children’s ability to regulate emotions determined how those emotions were expressed behaviorally (Teisl & Cicchetti, 2008). Kim and Cicchetti (2010) also found a link between low emotion regulation and higher externalizing problems in maltreated children, which contributed to later peer rejection. In an investigation based on the larger dataset used in the present study, Kim-Spoon, Haskett, Longo, and Nice (2012) found physically abused children’s regulation, as measured by parents’ reports, were associated with teachers’ reports of children’s regulation in the school setting.
problems. Teisl and Cicchetti (2008) found that both processes were significant mediators of the relation between maltreatment and externalizing behavior.
hostile attribution bias were significant mediators for the relation between physical abuse and externalizing problem behaviors. Hostile attribution accounted for 10% and emotion
regulation accounted for 55% of the overall effect (Teisl & Cicchetti, 2008).
In summary, research supports the link between emotion dysregulation and externalizing behavior problems in physically abused children. Furthermore, studies have shown that the externalizing problems abused children have in relation to their emotion dysregulation are harmful to their social adjustment in school settings (Kim & Cicchetti, 2010; Teisl & Cicchetti, 2008). Therefore, it is imperative to understand the factors
physically abused children’s emotion regulation may be interacting with to affect their social maladjustment. It may be that emotion regulation interacts with the cognitive processes involved in social information processing to affect physically abused children’s behaviors in social interactions.
Current Study
Previous research indicates that physically abused children are at increased risk for externalizing behavior problems, which tend to be stable from early childhood into
de Castro et al. 2005; Dodge et al., 1995; Teisl & Cicchetti, 2008; Weiss et al., 1992). There is evidence to support the influence of emotion regulation on maltreated children’s social information processing (Crick & Dodge, 1994; Orobio de Castro et al., 2005; Teisl & Cicchetti, 2008), which may account for the individual differences present in the relation between social information processing and externalizing problem behaviors of these children.
Previous research has attempted to address the joint influence of social information processing and emotion regulation on externalizing behavior problems; however, many of these studies have been conducted with normative samples and have not examined emotion regulation as a moderator for the link between social information processing and
externalizing problems (e.g. Eisenberg, Zhou, et al., 2005; Orobio de Castro et al., 2005) Teisl and Cicchetti (2008) attempted to address one of these gaps in the literature when they tested the mediating effects of social information processing and emotion regulation on the relation between maltreatment status and externalizing behavior problems. Although this was a well-designed study that provided support for both social information processing and emotion regulation predicting externalizing problem behaviors, Teisl and Cicchetti (2008) did not address the interactive influences of emotion regulation and social information processing on externalizing problems.
multi-method approach with a sample of young physically abused children. Furthermore, this moderation model was explored in the context of children’s experiences in the transition into formal schooling (i.e., in kindergarten). A multi-method approach to measuring constructs was used in this study. Children’s responses to hypothetical peer problems served as the measure of social information processing (e.g., attributional bias and ability to generate solutions to peer problems). To measure emotion regulation, children were observed in a simulated frustrating task and teachers provided ratings of regulation in the school setting using a standardized questionnaire. Externalizing problem behaviors were measured via observations of children’s peer interactions on the school playground and by teacher ratings on a standardized instrument.
Hypotheses
1. The relation between social information processing (hostile attribution bias and response generation) and externalizing problem behaviors will be moderated by teacher-reported and observed children’s emotion regulation ability, as indicated by a significant interaction between social information processing and emotion regulation.
Emotion Regulation
Social Information Processing Externalizing problem behaviors
b. There will be a significant interaction between hostile attribution bias scores and observed regulation in prediction of externalizing problems.
c. There will be a significant interaction between response generation scores and teacher reports of regulation in prediction of externalizing problems.
d. There will be a significant interaction between response generation scores and observed regulation in prediction of externalizing problems.
2. Social information processing patterns will be a significant predictor of the expression of externalizing problem behaviors. Specifically, children with
problematic social information processing skills (hostile attribution bias and response generation) will express higher externalizing problem behaviors.
3. Emotion regulation will be a significant predictor of children’s externalizing problem behaviors, such that poor emotion regulation (as measured by teacher report and observations) will predict higher ratings on externalizing problem behaviors.
Method
Participants
kindergarten, and first grade. The sample for the current study was reduced from the original 93 participants to 69 children who participated in the kindergarten time point; the sample was further reduced because seven children were excluded from analyses because they were missing data on at least one measure used in this study.
Procedures
Participants were recruited for the larger study through mailed information packets distributed by social services staff members, who selected eligible families after reviewing the current child protection registry. Parents interested in participating in the study contacted the project office and voluntarily completed an initial psychosocial interview. After the interview, data collection was scheduled for those families who met inclusionary criteria for the study. Criteria were a substantiated report of physical abuse of the child by the
participating parent within the last 12 months, confirmation of same residence for parent-child dyad at time of enrollment, absence of parent-child sexual abuse, and absence of untreated parental substance abuse. Because the kindergarten time point was used, the current abuse status of the children in this study was unknown, as some children (n = 39) had been enrolled in the study since preschool and others (n = 23) entered the study at the kindergarten time point. Transportation and child care were provided for the families, in addition to $70
compensation for the first data collection session, $80 for the second session, and $90 for the final session. Families were eligible for additional $50 compensation by entering into a drawing each time they scheduled a subsequent data collection session.
At the beginning of data collection sessions, the children’s parents gave informed consent and children provided verbal assent for their participation in the study. Study
and family conditions. Within two weeks of parent and child data collection, teachers were asked to schedule playground observations and complete self-report measures of child behavior, for which they were compensated $15. All teachers who were asked to participate in this study complied. Approval for this study was granted by the university institutional review board.
Measures
There are some missing data for a few children. The HIWC or puzzle box might have not been administered due to time constraints during the data collection session (e.g., some families arrived very late or had to leave early due to appointments or illness) or the playground observation might not have been conducted due to logistics at the school (teachers were not allowed to let their children on the playground for various reasons;
children in year-round schools “tracked out”). The amount of available data for each variable is provided in the description of each measure below.
Externalizing Problem Behaviors.
Child Behavior Checklist-Teacher Report Form (CBCL-TRF) & Caregiver Teacher
Report Form (C-TRF). The CBCL-TRF is a 118 item teacher report of children’s (ages 6-18
years) adjustment, including competencies and emotional and behavioral problems
scores are derived based on child age and gender for eight syndrome subscales and three summary scales; however for the purposes of this study only the Externalizing problems summary scale was used. The CBCL-TRF was completed by teachers of child participants age 6 years (n = 48).
The C-TRF was designed to be comparable to the CBCL-TRF and is intended for children ages 1.5 to 5 years. It contains 99 items and yields T scores based on child age and gender for five syndrome subscales and the same three summary scales as the CBCL-TRF. For the purposes of this study T scores for the Externalizing problems summary scale was used. The C-TRF was administered to teachers of child participants age 5 years (n = 14).
The CBCL-TRF and C-TRF are widely used measures of children’s behavior problems with strong psychometric properties. Test developers reported that internal
consistency for the CBCL-TRF Externalizing scale was α = 0.95 and the test-retest reliability coefficient of the Externalizing problems scale was 0.89. Internal consistency for the C-TRF Externalizing scale was α = 0.92 and the test-retest reliability coefficient for the
Playground Observation. To measure children’s social behaviors with peers in a
naturalistic setting, children were observed by trained research assistants for 30 minutes using a coding system based on the coding system used in a study conducted by Haskett and Kistner (1991). A 15 second interval recording method was used in which children were observed for 10 seconds followed by a five second interval in which four behaviors were recorded as either present or absent. The four target behaviors for this observational measure were Engagement, Negative Behavior, Rough Play, and Aggression. Engagement was defined as verbal and non-verbal behaviors that were directed at a peer with the intention to engage that peer in an interaction or to continue an interaction initiated by the peer (i.e. talking with a peer, making eye contact). Negative behaviors included negative verbal or physical gestures towards peers (i.e. teasing, threatening). Rough play consisted of negative physical contact with a peer without the strength or intensity to be classified as aggressive (i.e. elbowing or shouldering another child, holding onto another child’s clothes). Aggression consisted of negative physical behaviors towards a peer or object with the potential for harm or damage (i.e. hitting, throwing objects).
Scores for each of the behaviors examined during the playground observation reflected the percentage of intervals involved in the behavior. Playground observation data were missing for four children. For purposes of this investigation, inappropriate social
Playground, was created by adding the number of intervals in which Negative Behavior, Rough Play, and/or Aggression occurred and dividing that sum by the total number of
intervals the child was observed (i.e. 120 intervals for most child participants). This observed inappropriate social behavior on the playground variable was created to reflect a broader conceptualization of externalizing problems on the playground, as opposed to examining each inappropriate behavior separately. Inter-rater reliability based on percent agreement for the playground observation variables ranged from 0.78 to 0.94. Scores generated from playground observations using this coding system have been shown to moderately correlate with teacher reports of externalizing problem behaviors on the Preschool Behavior
Questionnaire, r = .36 - .48, p < .05, and peer nominations of likability, r = -.32, p < .05 (Haskett & Kistner, 1991) and scores are related to individual differences in adjustment of abused children (Ward & Haskett, 2006).
Social Information Processing. The Home Interview with Children (HIWC) is an
For example, one item related to the physical conflict category states “Pretend that you are standing on the playground playing catch with someone. You throw the ball to him/her and he/she catches it. You turn around, and the next thing you realize is that he/she has thrown the ball and hit you in the middle of your back. The ball hits you hard, and it hurts a lot.” (Conduct Problems Prevention Research Group, 1991). Children are then asked to (a) explain why the antagonist in the vignette did what he/she did and (b) to report how the child would respond to the peer’s behavior.
Using procedures recommended by the test developers, responses to each question of intent were coded as hostile (“because he is mean”), benign (“because he can’t thrown very well”), or don’t know. The total number of hostile responses (range = 0 – 8) served as the hostile attribution bias variable for this study. Responses to questions of problem solving were coded on a six-point scale ranging from 0 to 5: 0 = don’t know, 1 = do nothing in response, 2 = ask the antagonist why he/she provoked him/her, 3 = make a command, 4 = threaten the antagonist, and 5 = employ aggressive tactics. For the purpose of this study, an aggressive response generation variable was created by adding the number of vignettes in which a children’s response was coded as either a 4 or a 5 (range = 0-8). There was no missing data for either hostile attribution bias or aggressive response generation.
generation). The HIWC also has demonstrated internal consistency as indicated by
confirmatory factor analyses that suggested that hostile attributions and response generation were separate aspects of social information processing (Dodge, Bates, & Petit, 2002). The internal consistency of the HIWC also was assessed by Rains (2002) with both typical and children at risk for clinical levels of externalizing problem behaviors and was found to be 0.72 for attributions and 0.82 for response generation for at risk children. For the present study the internal consistency was 0.75 for items assessing attributions and 0.69 for items assessing response generation for children at the kindergarten time point. In terms of validity, Orobio de Castro, Veerman, Koops, Bosch, and Monshouwer (2002) found higher effect sizes for the relation between hostile attributions and adjustment when vignettes were read to children as opposed to being displayed pictorially or via videos.
Emotion Regulation.
Puzzle Box. The Puzzle Box task is a behavioral measure of children’s self-regulation
included four possible modes of cheating: looking through a Plexiglas side, opening the top of the box, looking through the holes the child used to access the inside of the box, and removing the pieces to look at them.
Each child was videotaped while completing the Puzzle Box task and these tapes were later coded by trained research assistants for the amount of time (number of seconds) the child spent on task (working on the puzzle without cheating) and the child’s latency to first cheating behavior (number of seconds). Data were missing for five children for both time spent on task and latency to cheat. Eisenberg et al. (2001) found inter-rater agreement for persistence and cheating behaviors were both r = 0.99. For the present study, inter-rater agreement was r = 0.994 for time spent on task and r = 0.996 for latency to cheat.
Behavior Rating Inventory of Executive Functioning (BRIEF). The BRIEF is a
standardized 86-item questionnaire designed to assess children’s regulation and executive functioning as reported by teachers (Gioia, Isquith, Guy, & Kenworthy, 2000). Items are rated on a three point scale with 1 = never a problem, 2 = sometimes a problem, and 3 = often a problem. Teachers are asked to rate each item on the basis of children’s behavior in the past six months. Raw scores are converted to T-scores based on child age and gender. The BRIEF yields scores for eight subscales and two broad indices of behavior regulation and
metacognition. BRIEF scores were missing for two children.
too silly”), Shift (“has trouble moving from one activity to another”), and Emotional Control subscales (“has explosive outbursts”). The developers of the BRIEF assessed the
psychometric properties and found internal consistency α = 0.97 and test-retest (3.5 week lapse in administration) coefficient of 0.92 for the BRI. For the present study, the internal consistency for the BRIEF scales ranged from α = 0.88 - 0.96. Validity for the BRI was established through principal factor analysis that confirmed that the Emotional Control, Shift, and Inhibit subscales strongly loaded on the same factor (Gioia et al., 2000). Furthermore, creators of the BRIEF have established construct validity for the measure by comparing it to other measures of similar constructs and found scores on the BRIEF correlated in the
expected fashions with other measures of behavioral and emotional functioning (Gioia et al., 2000).
Results
Preliminary analyses: Descriptives and covariates
transformed because regression analyses only assume normal distribution for dependent variables. Therefore, the normality of the dependent variables were considered using descriptive statistics and it was determined that externalizing behavior as measured by the CBCL-TRF was normally distributed. However, inappropriate social behavior on the playground was significantly skewed and kurtotic and thus was transformed using a square root nonlinear transformation, resulting in this variable meeting normal distribution
assumptions (as reported in Tables 1 and 2).
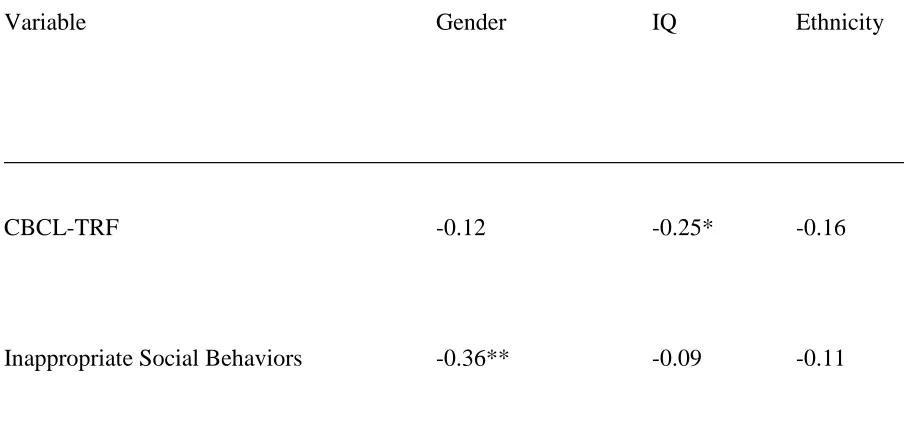
A correlation matrix was generated to determine if gender, ethnicity (African American, non-African American), or intelligence (as measured by the Kaufman Brief Intelligence Test) should serve as covariates (see Table 3). A significant, negative correlation was found between intelligence and CBCL-TRF Externalizing scores, indicating that
children with higher intelligence tended to score lower on the Externalizing behaviors scale of the CBCL-TRF. A significant correlation also was found between gender and
inappropriate social behaviors on the playground, indicating that males were more likely than females to display these inappropriate social behaviors. All other correlations between
and intelligence was entered into subsequent regression analyses when the dependent variable was the CBCL-TRF Externalizing scale.
Predictor variables also were correlated to determine if variables measuring the same construct could be combined as a means of data reduction. In regards to social information processing variables, hostile attribution bias and aggressive response generation were not significantly correlated (r = 0.15, p = 0.24) and thus these variables were analyzed separately in subsequent regression models. Similarly, emotion regulation as measured by the BRIEF was not significantly correlated with time spent on task (r = -0.12, p = 0.39) nor latency to cheat (r = -0.25, p = 0.07) on the puzzle box task; thus these variables were not combined. Finally, the puzzle box variables – time spent on task and latency to cheat – were
significantly correlated (r = 0.63, p = 0.001); however, these variables were not combined in subsequent analyses because they were only moderately correlated, leading me to believe they might be measuring slightly different aspects of regulation.
Primary hypotheses: Tests of moderation
In order to address the primary hypothesis of the current study – that emotion regulation would moderate the relation between social information processing and externalizing problem behaviors – a series of moderation models were tested using hierarchical linear regressions (Howell, 2010). A multi-method approach was used to
resulting in 12 individual moderation models. For each hypothesized model, all predictors were centered prior to analysis to reduce multicollinearity among the main effects and interaction terms. Interaction terms were created by multiplying the centered social information processing variable and the centered emotion regulation variable for each moderation model. Additionally, an intercept term was created for the purposes of
interpreting any significant interactions with simple slope analyses. For each hypothesized model, potential covariates were entered into Block 1, followed by the centered main effects added in Block 2, and the interaction term added in Block 3. Finally, the diagnostic statistics for all models were examined (i.e., heteroscedasticity, influence, distance) and although outliers were present, Cook’s D statistics determined these outliers were not substantially influencing the parameter estimates. See Tables 4 – 15 for the regression results with
significant moderation models presented first, followed by non-significant models organized by moderating variable.
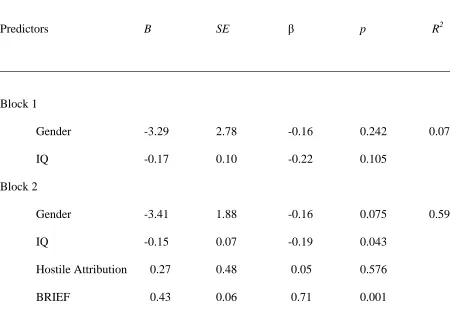
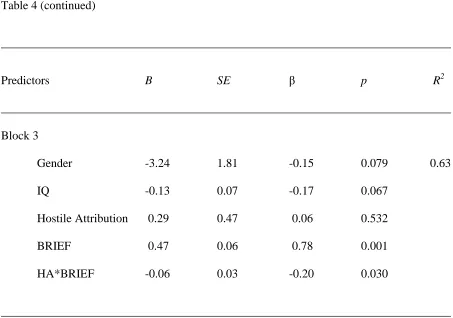
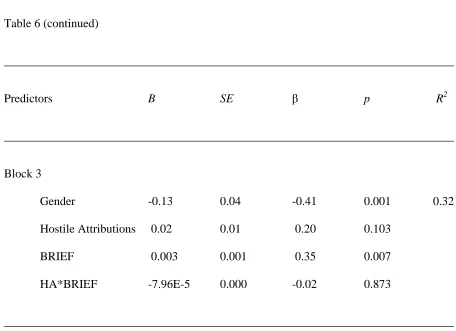
Out of the 12 moderation models examined, support for moderation was only found in two models (see Tables 4 and 5). First, when the effect of emotion regulation (as measured by the BRIEF) on the relation between hostile attribution bias and CBCL-TRF Externalizing scores was examined, support for emotion regulation as a moderator was found. The
Figure 1) determined that at high levels of emotion regulation (low BRIEF scores) there was a positive relation between hostile attribution bias and CBCL-TRF Externalizing scores that approached significance (t = 1.93, p = 0.06). Thus, under conditions of high regulation, the externalizing scores of children are high when these children express high levels of hostile attribution bias. The simple slopes analysis further determined that at sample mean levels of emotion regulation (t = 0.63, p = 0.53) and low levels of emotion regulation (t = -1.03, p = 0.30) there was no relation between hostile attribution bias and CBCL-TRF Externalizing scores.
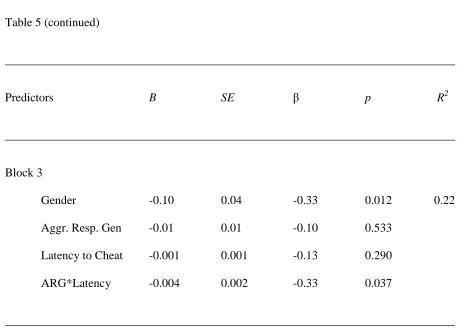
social behaviors on the playground that approached significance (t = -1.96, p = 0.06). Therefore, children with high levels of regulation and high levels of aggressive response generation engaged in less frequent inappropriate social behaviors on the playground. No significant relation was found between aggressive response generation and inappropriate social behaviors on the playground at sample mean levels of latency to cheat (t = -0.63, p = 0.53).
Secondary hypotheses: Predictors of externalizing problem behaviors
To test the remaining study hypotheses, a series of 10 individual linear regressions were conducted to determine which independent variables (hostile attribution bias,
emotion regulation tended to have higher scores on the CBCL-TRF Externalizing scale (see Table 16). In regards to inappropriate social behaviors on the playground, emotion regulation as measured by the BRIEF Behavior Regulation Index was a significant predictor, indicating that children with lower levels of emotion regulation tended to display more inappropriate social behaviors on the playground (see Table 17).
Post-hoc analyses
Post-hoc analyses were conducted to determine if individual subscales or
children expressed low levels of hostile attribution bias. The simple slopes analysis further determined that at sample mean levels of emotion regulation (t = -0.60, p = 0.55) and high levels of emotion regulation (t = 1.20, p = 0.24) there was no relation between hostile attribution bias and CBCL-TRF Aggression scores. In a second round of post hoc analyses, the moderation analyses were conducted with the subcomponents of the inappropriate social behaviors on the playground variable (Negative Behavior, Rough Play, and Aggression) as the dependent variables with appropriate covariates entered into each model. Results for this series of analyses found no significant model supporting moderation.
Post-hoc individual linear regressions also were conducted to determine if the social information processing and emotion regulation variables predicted the individual components of the aggregate adjustment variables (CBCL-TRF and inappropriate social behaviors on the playground). First, a linear regression was conducted to examine whether social information processing variables (i.e., hostile attribution bias and aggressive response generation)
teacher-reported high rule breaking and aggressive behaviors. Results further demonstrated that latency to cheat significantly predicted Aggression scores (B = -0.18, SE = 0.09, p = 0.05), suggesting that children who delayed cheating had lower displays of aggression at school.
Table 1
Distribution of Study Variables
___________________________________________________________________________
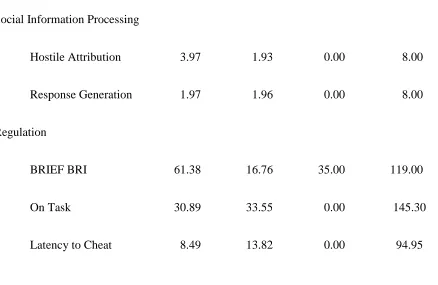
Variable M SD Min Max
___________________________________________________________________________
Social Information Processing
Hostile Attribution 3.97 1.93 0.00 8.00
Response Generation 1.97 1.96 0.00 8.00
Regulation
BRIEF BRI 61.38 16.76 35.00 119.00
On Task 30.89 33.55 0.00 145.30
Latency to Cheat 8.49 13.82 0.00 94.95
Table 1 (continued)
___________________________________________________________________________
Variable M SD Min Max
___________________________________________________________________________ Adjustment
CBCL-TRF 59.13 9.95 41.00 85.00
Inappropriate Social Behaviors 0.17 0.15 0.00 0.49
Table 2
Skew and Kurtosis of Study Variables
___________________________________________________________________________
Variable Skew Kurtosis
___________________________________________________________________________
Social Information Processing
Hostile Attribution 0.09 -0.75
Response Generation 1.05 0.58
Regulation
BRIEF BRI 1.16 1.64
On Task 2.03 4.44
Latency to Cheat 4.43 25.24
Table 2 (continued)
___________________________________________________________________________
Variable Skew Kurtosis
___________________________________________________________________________
Adjustment
CBCL-TRF 0.53 0.17
Inappropriate Social Behaviors 0.39 -0.76
Table 3
Correlation coefficients of relations between possible covariates and dependent variables
___________________________________________________________________________
Variable Gender IQ Ethnicity
___________________________________________________________________________
CBCL-TRF -0.12 -0.25* -0.16
Inappropriate Social Behaviors -0.36** -0.09 -0.11
___________________________________________________________________________
Table 4
Results of regression model of emotion regulation (as measured by the BRIEF) and hostile attribution bias predicting CBCL-TRF externalizing scores (n = 56)
___________________________________________________________________________
Predictors B SE β p R2
___________________________________________________________________________
Block 1
Gender -3.29 2.78 -0.16 0.242 0.07
IQ -0.17 0.10 -0.22 0.105
Block 2
Gender -3.41 1.88 -0.16 0.075 0.59
IQ -0.15 0.07 -0.19 0.043
Hostile Attribution 0.27 0.48 0.05 0.576
BRIEF 0.43 0.06 0.71 0.001
Table 4 (continued)
___________________________________________________________________________
Predictors B SE β p R2
___________________________________________________________________________ Block 3
Gender -3.24 1.81 -0.15 0.079 0.63
IQ -0.13 0.07 -0.17 0.067
Hostile Attribution 0.29 0.47 0.06 0.532
BRIEF 0.47 0.06 0.78 0.001
HA*BRIEF -0.06 0.03 -0.20 0.030
___________________________________________________________________________
Table 5
Results of regression model of emotion regulation (as measured by latency to cheat) and aggressive response generation predicting inappropriate social behaviors on the playground (n = 54)
___________________________________________________________________________
Predictors B SE β p R2
___________________________________________________________________________
Block 1
Gender -0.10 0.04 -0.35 0.009 0.12 Block 2
Gender -0.10 0.04 -0.33 0.016 0.15 Aggr. Resp. Gen. 0.01 0.01 0.09 0.508
Latency to Cheat -0.002 0.001 -0.15 0.258
Table 5 (continued)
___________________________________________________________________________
Predictors B SE β p R2
___________________________________________________________________________
Block 3
Gender -0.10 0.04 -0.33 0.012 0.22 Aggr. Resp. Gen -0.01 0.01 -0.10 0.533
Latency to Cheat -0.001 0.001 -0.13 0.290 ARG*Latency -0.004 0.002 -0.33 0.037
___________________________________________________________________________
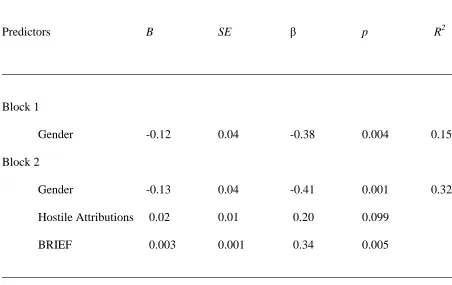
Table 6
Results of regression model of emotion regulation (as measured by the BRIEF) and hostile attribution bias predicting inappropriate social behavior on the playground (n = 55)
___________________________________________________________________________
Predictors B SE β p R2
___________________________________________________________________________
Block 1
Gender -0.12 0.04 -0.38 0.004 0.15 Block 2
Gender -0.13 0.04 -0.41 0.001 0.32 Hostile Attributions 0.02 0.01 0.20 0.099
BRIEF 0.003 0.001 0.34 0.005
Table 6 (continued)
___________________________________________________________________________
Predictors B SE β p R2
___________________________________________________________________________
Block 3
Gender -0.13 0.04 -0.41 0.001 0.32 Hostile Attributions 0.02 0.01 0.20 0.103
BRIEF 0.003 0.001 0.35 0.007
HA*BRIEF -7.96E-5 0.000 -0.02 0.873
___________________________________________________________________________
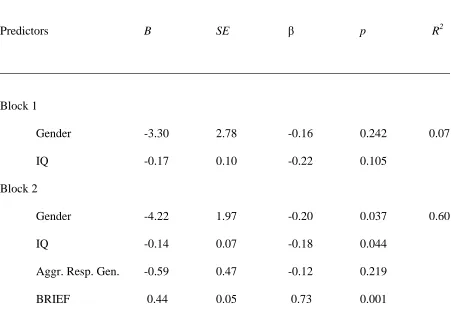
Table 7
Results of regression model of emotion regulation (as measured by the BRIEF) and aggressive response generation predicting CBCL-TRF externalizing scores (n = 56)
___________________________________________________________________________
Predictors B SE β p R2
___________________________________________________________________________
Block 1
Gender -3.30 2.78 -0.16 0.242 0.07
IQ -0.17 0.10 -0.22 0.105
Block 2
Gender -4.22 1.97 -0.20 0.037 0.60
IQ -0.14 0.07 -0.18 0.044
Aggr. Resp. Gen. -0.59 0.47 -0.12 0.219
BRIEF 0.44 0.05 0.73 0.001
Table 7 (continued)
___________________________________________________________________________
Predictors B SE β p R2
___________________________________________________________________________ Block 3
Gender -4.20 1.95 -0.20 0.036 0.62
IQ -0.13 0.07 -0.17 0.061
Aggr. Resp. Gen. -0.56 0.47 -0.11 0.237
BRIEF 0.46 0.05 0.76 0.001
ARG*BRIEF -0.04 0.02 -0.14 0.129
___________________________________________________________________________
Table 8
Results of regression model of emotion regulation (as measured by the BRIEF) and
aggressive response generation predicting inappropriate social behaviors on the playground (n = 55)
___________________________________________________________________________
Predictors B SE β p R2
___________________________________________________________________________
Block 1
Gender -0.12 0.04 -0.38 0.004 0.15 Block 2
Gender -0.12 0.04 -0.37 0.004 0.29 Aggr. Resp. Gen. 0.006 0.01 0.08 0.536
BRIEF 0.003 0.001 0.36 0.003
Table 8 (continued)
___________________________________________________________________________
Predictors B SE β p R2
___________________________________________________________________________
Block 3
Gender -0.12 0.04 -0.38 0.003 0.30 Agg. Resp. Gen. 0.005 0.01 0.07 0.548
BRIEF 0.003 0.001 0.40 0.002
ARG*BRIEF -3.46E-4 0.000 -0.09 0.445
___________________________________________________________________________
Table 9
Results of regression model of emotion regulation (as measured by time spent on task) and hostile attribution bias predicting CBCL-TRF externalizing scores (n =52)
___________________________________________________________________________
Predictors B SE β p R2
___________________________________________________________________________
Block 1
Gender -2.86 2.60 -0.15 0.276 0.09
IQ -0.20 0.10 -0.27 0.055
Block 2
Gender -2.57 2.54 -0.14 0.316 0.19
IQ -0.24 0.10 -0.33 0.019
Hostile Attribution 1.25 0.64 0.26 0.057
On Task -0.06 0.04 -0.23 0.094
Table 9 (continued)
___________________________________________________________________________
Predictors B SE β p R2
___________________________________________________________________________ Block 3
Gender -2.66 2.60 -0.14 0.311 0.19
IQ -0.24 0.10 -0.32 0.022
Hostile Attribution 1.28 0.66 0.27 0.060
On Task -0.06 0.04 -0.23 0.095
HA*On Task -0.004 0.02 -0.03 0.833
___________________________________________________________________________
Table 10
Results of regression model of emotion regulation (as measured by time spent on task) and hostile attribution bias predicting inappropriate social behaviors on the playground (n =54)
___________________________________________________________________________
Predictors B SE β p R2
___________________________________________________________________________
Block 1
Gender -0.10 0.04 -0.35 0.009 0.12 Block 2
Gender -0.11 0.04 -0.35 0.010 0.18 Hostile Attribution 0.02 0.01 0.23 0.075
On Task -3.22E-4 0.001 -0.08 0.563
Table 10 (continued)
___________________________________________________________________________
Predictors B SE β p R2
___________________________________________________________________________
Block 3
Gender -0.11 0.04 -0.37 0.009 0.18 Hostile Attribution 0.02 0.01 0.25 0.063
On Task 0.000 0.001 -0.08 0.556
HA*On Task -1.63E-4 0.000 -0.08 0.548
___________________________________________________________________________
Table 11
Results of regression model of emotion regulation (as measured by time spent on task) and aggressive response generation predicting CBCL-TRF externalizing scores (n =52)
___________________________________________________________________________
Predictors B SE β p R2
___________________________________________________________________________
Block 1
Gender -2.86 2.60 -0.15 0.276 0.09
IQ -0.20 0.10 -0.27 0.055
Block 2
Gender -2.98 2.78 -0.16 0.288 0.14
IQ -0.20 0.10 -0.27 0.046
Aggr. Resp. Gen. -0.55 0.67 -0.12 0.413
On Task -0.06 0.04 -0.21 0.138
Table 11 (continued)
___________________________________________________________________________
Predictors B SE β p R2
___________________________________________________________________________ Block 3
Gender -3.07 2.83 -0.16 0.283 0.14
IQ -0.20 0.10 -0.28 0.050
Aggr. Resp. Gen. -0.62 0.73 -0.13 0.400
On Task -0.06 0.04 -0.22 0.139
ARG*On Task -0.01 0.03 -0.04 0.809
___________________________________________________________________________
Table 12
Results of regression model of emotion regulation (as measured by time on task) and
aggressive response generation predicting inappropriate social behaviors on the playground (n =54)
___________________________________________________________________________
Predictors B SE β p R2
___________________________________________________________________________
Block 1
Gender -0.10 0.04 -0.35 0.009 0.12 Block 2
Gender -0.09 0.04 -0.32 0.027 0.13 Aggr. Resp. Gen. 0.006 0.01 0.09 0.511
On Task -2.40E-4 0.001 -0.06 0.674
Table 12 (continued)
___________________________________________________________________________
Predictors B SE β p R2
___________________________________________________________________________
Block 3
Gender -0.10 0.04 -0.32 0.025 0.15 Aggr. Resp. Gen. 0.004 0.01 0.06 0.696
On Task -3.41E-4 0.001 -0.08 0.558
ARG*On Task -3.72E-4 0.000 -0.13 0.364
___________________________________________________________________________
Table 13
Results of regression model of emotion regulation (as measured by latency to cheat) and hostile attribution bias predicting CBCL-TRF externalizing scores (n =52)
___________________________________________________________________________
Predictors B SE β p R2
___________________________________________________________________________
Block 1
Gender -2.86 2.60 -0.15 0.276 0.09
IQ -0.20 0.10 -0.27 0.055
Block 2
Gender -3.73 2.40 -0.20 0.127 0.26
IQ -0.20 0.10 -0.27 0.041
Hostile Attribution 1.41 0.62 0.30 0.027 Latency to cheat -0.22 0.08 -0.36 0.007
Table 13 (continued)
___________________________________________________________________________
Predictors B SE β p R2
___________________________________________________________________________ Block 3
Gender -3.74 2.42 -0.20 0.129 0.26
IQ -0.20 0.10 -0.27 0.048
Hostile Attribution 1.43 0.62 0.30 0.027 Latency to Cheat -0.20 0.10 -0.32 0.053
HA*Latency -0.02 0.04 -0.07 0.685
___________________________________________________________________________
Table 14
Results of regression model of emotion regulation (as measured by latency to cheat) and hostile attribution bias predicting inappropriate social behaviors on the playground (n = 54)
___________________________________________________________________________
Predictors B SE β p R2
___________________________________________________________________________
Block 1
Gender -0.10 0.04 -0.35 0.009 0.12 Block 2
Gender -0.11 0.04 -0.38 0.004 0.22 Hostile Attribution 0.02 0.01 0.28 0.036
Latency to Cheat -0.002 0.001 -0.21 0.102
Table 14 (continued)
___________________________________________________________________________
Predictors B SE β p R2
___________________________________________________________________________
Block 3
Gender -0.12 0.04 -0.39 0.003 0.23 Hostile Attribution 0.02 0.01 0.26 0.044
Latency to Cheat -0.001 0.002 -0.07 0.717 HA*Latency -0.001 0.001 -0.18 0.354
___________________________________________________________________________
Table 15
Results of regression model of emotion regulation (as measured by latency to cheat) and aggressive response generation predicting CBCL-TRF externalizing scores (n = 52)
___________________________________________________________________________
Predictors B SE β p R2
___________________________________________________________________________
Block 1
Gender -2.86 2.60 -0.15 0.276 0.09
IQ -0.19 0.10 -0.28 0.055
Block 2
Gender -3.93 2.66 -0.21 0.146 0.19
IQ -0.16 0.01 -0.22 0.103
Aggr. Resp. Gen. -0.52 0.65 -0.11 0.423 Latency to Cheat -0.19 0.08 -0.31 0.022
Table 15 (continued)
___________________________________________________________________________
Predictors B SE β p R2
___________________________________________________________________________ Block 3
Gender -3.95 2.69 -0.21 0.148 0.19
IQ -0.16 0.10 -0.22 0.104
Aggr. Resp. Gen. -0.67 0.78 -0.14 0.394 Latency to Cheat -0.19 0.08 -0.31 0.024
ARG*Latency -0.04 0.12 -0.06 0.729
___________________________________________________________________________
Table 16
Regression results of predictors of externalizing problem behaviors as measured by the CBCL-TRF controlling for gender and IQ
___________________________________________________________________________
Predictors B SE β R2
___________________________________________________________________________
Social Information Processing
Hostile Attribution 1.13 0.68 0.22 0.11
Response Generation -0.31 0.71 -0.06 0.07
Regulation
BRIEF 0.44*** 0.05 0.72 0.60
On Task -0.05 0.04 -0.20 0.13
Latency to Cheat -0.20* 0.08 -0.31 0.18
___________________________________________________________________________
Table 17
Regression results of predictors of inappropriate social behavior on the playground controlling for gender
___________________________________________________________________________
Predictors B SE β R2
___________________________________________________________________________
Social Information Processing
Hostile Attribution 0.02 0.01 0.22 0.17
Response Generation 0.01 0.01 0.11 0.13
Regulation
BRIEF 0.003** 0.001 0.37 0.29
On Task -2.44E-4 0.001 -0.06 0.13
Latency to Cheat -0.002 0.001 -0.15 0.14
___________________________________________________________________________
Table 18
Results of regression model of emotion regulation (as measured by BRIEF) and hostile attribution bias predicting CBCL-TRF Aggression scores
___________________________________________________________________________
Predictors B SE β p R2
___________________________________________________________________________
Block 1
Gender -0.04 0.02 -0.25 0.090 0.06 Block 2
Gender -0.04 0.01 -0.27 0.013 0.56 Hostile Attribution -0.001 0.004 -0.04 0.685
BRIEF 0.003 0.000 0.71 0.001
Table 18 (continued)
___________________________________________________________________________
Predictors B SE β p R2
___________________________________________________________________________
Block 3
Gender -0.04 0.01 -0.25 0.013 0.61 Hostile Attribution -0.002 0.003 -0.05 0.643
BRIEF 0.003 0.000 0.80 0.001
HA*BRIEF -4.12E-4 0.000 -0.26 0.017
___________________________________________________________________________
60 65 70 75 80 85 Low High
Hostile Attribution Bias
E x te rn al iz in g S co re s o n C B C L -T R F c
Low Emotion Regulation Average Emotion
Regulation
High Emotion Regulation
0 0.1 0.2 0.3 0.4 0.5 0.6 0.7 0.8 Low High
Aggressive Response Generation
In ap p ro p ri at e S o ci al B eh av io rs ( T ra n sf o rm ed )
Low Latency to Cheat Average Latency to Cheat High Latency to Cheat