Selection and Drift in Subdivided Populations: A Straightforward Method for
Deriving Diffusion Approximations and Applications Involving
Dominance, Selfing and Local Extinctions
Denis Roze*
,†,1and Franc¸ois Rousset*
*Institut des Sciences de l’Evolution, Universite´ Montpellier II, 34095 Montpellier, France and†Centre d’Etudes sur le Polymorphisme des Microorganismes, Institut de Recherche pour le De´veloppement, 34394 Montpellier, France
Manuscript received February 11, 2003 Accepted for publication May 19, 2003
ABSTRACT
Population structure affects the relative influence of selection and drift on the change in allele frequen-cies. Several models have been proposed recently, using diffusion approximations to calculate fixation probabilities, fixation times, and equilibrium properties of subdivided populations. We propose here a simple method to construct diffusion approximations in structured populations; it relies on general expressions for the expectation and variance in allele frequency change over one generation, in terms of partial derivatives of a “fitness function” and probabilities of genetic identity evaluated in a neutral model. In the limit of a very large number of demes, these probabilities can be expressed as functions of average allele frequencies in the metapopulation, provided that coalescence occurs on two different timescales, which is the case in the island model. We then use the method to derive expressions for the probability of fixation of new mutations, as a function of their dominance coefficient, the rate of partial selfing, and the rate of deme extinction. We obtain more precise approximations than those derived by recent work, in particular (but not only) when deme sizes are small. Comparisons with simulations show that the method gives good results as long as migration is stronger than selection.
T
HE geographical distribution of a population has Slatkin(1981) used a low-migration limit to investigatemany consequences on its evolution. The nature of the joint effects of dominance and spatial structure on the habitat (fragmented or continuous) and the dis- fixation probabilities of advantageous mutations. In his persal patterns of individuals across space affect the model, the fixation of an allele within a deme occurs much relative importance of the different processes changing faster than its transmission between demes, so that fixation allele frequencies (selection, genetic drift . . .) and there- is assumed to take place independently in each deme fore have an effect on several genetical features of popu- (see also Takahata1991). He showed that the probabil-lations, such as the amount of genetic diversity and the ity of fixation of recessive mutations is increased in this strength of inbreeding depression. Spatial structure may low-migration limit, compared to the case of a panmictic also affect the timescale of evolution; indeed, the rate population; indeed, population structure increases the of adaptation of a population depends critically on the probability that an advantageous homozygous genotype
probability that new advantageous mutations will go to is created before the mutation is lost. However, the
fixation and on the time length of the fixation process. probability of fixation of dominant mutations is
de-Different models have been used to calculate the creased. Barton (1993) worked on another model to
probability of fixation of an advantageous mutation in study the effect of catastrophic extinctions of demes a spatially structured population, dealing with different and showed that extinctions can substantially reduce the types of population structure, and different modes of fixation probability of beneficial alleles. More recently,
selection. For some simple models, Maruyama (1970) several authors used diffusion approximations to derive
found that in a population subdivided into demes of fixation probabilities and fixation times in
metapopul-constant size that never go extinct, spatial structure has ations. Cherry(2003a,b), Cherryand Wakeley(2003),
no influence on fixation probabilities: a new mutation and Wakeley(2003) have shown that diffusion
meth-has the same probability of fixation as if the population ods can be used in island models of population structure was not fragmented. This conclusion has been supported and studied the joint effects of dominance, population
by more recent work (Cherry and Wakeley 2003). structure, and local extinctions on fixation probabilities
and times of mutant alleles. Whitlock(2003) has pre-sented another approach, which he also applies to the
1Corresponding author:Centre d’Etudes sur le Polymorphisme des
stepping-stone model of population structure.
Microorganismes, UMR CNRS-IRD 9926, Institut de Recherche pour
In this article we provide a different method to
con-le De´veloppement, 911 avenue Agropolis, BP 64501, 34394
Montpel-lier Cedex 5, France. E-mail: [email protected] struct diffusion approximations, which is in several ways
more general than previous ones. The method consists one “generation.” This way of representing the dynam-ics of recolonization is obviously simplistic, but may be of expressing the mean of allele frequency change over
one generation in terms of partial derivatives of a “fit- seen as a first step in understanding the consequences of extinction and recolonization (Slatkin1977; Wade ness function” and probabilities of genetic identity
com-puted in a neutral model. We make no assumption on and McCauley 1988; Whitlock and Barton 1997;
Pannell and Charlesworth 1999); more complex
the particular form of the fitness function; indeed, the
method can be applied to many different selection mod- models may be tractable within the framework presented here (Rousset2004, Chaps. 10 and 11).
els (including multilevel selection). We then take the example, considered by previous authors, of selection through effects on fecundity (different genotypes
pro-THE DIFFUSION APPROXIMATION
ducing different numbers of gametes) and consider the
effects of dominance, self-fertilization, and local extinc- Diffusion theory has provided good approximations tions on the probability of fixation of new mutations. We for probabilities of fixation of mutant alleles (Kimura
confirm some previous approximations; however, our 1964). In this section we briefly review the methodology
method gives more precise results when migration is in the case of a panmictic population containing two
strong, when deme size is small, and also when extinc- allelesaandA. We callpthe frequency ofAand␦pthe tions occur. As discussed later, the diffusion method change in frequency ofAover a short time interval␦t. gives satisfying results as long as migration rates are not We first suppose that time and frequency are continuous
too small; with dominance, Slatkin’s method performs and define
better when migration is very low.
M␦p⫽E[␦p|p] (1)
V␦p⫽E[(␦p)2|p], (2) LIFE CYCLE
whereE[x] is the expectation ofx. To use the diffusion Throughout this article, we use an island model of
method we need the following limits: population structure, with possible local extinctions. We
assume that the population is subdivided intondemes. ᏹ␦p⫽ lim
␦t→0 (M␦p/␦t) (3)
At the beginning of the life cycle, each deme contains
Nadult individuals and has a probabilityeof becoming ᐂ␦p⫽ lim
␦t→0 (V␦p/␦t). (4)
extinct. In the surviving demes, individuals produce a
very large number of gametes and die; in practice we If these limits are finite, and if the higher-order
mo-treat the number of gametes produced as if it were ments of ␦p are negligible, the probability of fixation
infinite. Gamete fusion may precede or follow migration ofAwhen present in frequencyp,u(p), is given by the
(zygotic or gametic migration); we first do not make differential equation
any assumption about the breeding system, but later we
consider the cases of random union of gametes and of ᏹ␦
p
du dp⫹
ᐂ␦p
2
d2u
dp2 ⫽ 0 (5)
partial self-fertilization at a rate ␣. Migrants produced by a deme can reach any other deme with the same
(Karlin and Taylor1981) with solution
probability. The migration ratemis defined as the pro-portion of migrant zygotes (or gametes) present in any
u(p)⫽
冮
p
0G(x)dx
冮
10G(x)dx
, (6)
surviving deme once migration has occurred (“back-ward” migration rate). We assume that migrants arriving
in extinct demes do not survive, each extinct deme being where recolonized later by a finite number k of individuals
(Slatkin1977). These recolonizers come from “propa- G(x)⫽ exp
冤
⫺冮
2ᏹ␦xᐂ␦x
dx
冥
. (7) gules” that formed in each surviving deme after the firstround of dispersal. Again, recolonization can be zygotic
To apply this continuous model to the case of a popu-(if it occurs after fertilization) or gametic popu-(if it occurs
lation with discrete generations, one states that time is before; in this case each extinct deme is recolonized by
measured in units of N generations, where N is the
2kgametes). We also define a parameterφmeasuring
population size, and that the short time interval␦t corre-the probability that two colonizers come from corre-the same
sponds to one generation. Then␦t⫽1/N, andᏹ␦pand
deme (this is specified later). We assume that colonizers ᐂ
␦xare the limits asN tends to infinity ofN ⫻ M␦p and
reproduce immediately, producing a very large number
N⫻V␦p, respectively (Karlinand Taylor1981).
of zygotes. Finally, in all demesN individuals are
sam-In the simple case of genic selection whereAhas a pled randomly among all the zygotes to form the new
selective advantagesoverain an ideal haploid Wright-adult generation; exactly N adults are always in each
Fisher population of sizeN, we have deme, recolonized or not. Thus, recolonizers
phenotype of heterozygous individualszAa⫽ zaa ⫹ sh, h
measuring the dominance ofA. Definingpijas the
fre-V␦p⫽
pq
N ⫹o(1/N)⫹o(s) , (9) quency ofAin individual ij(p
ij ⫽ 0,1⁄2, or 1), pij1 and
pij2as the frequencies ofAat each of its two homologous
withq⫽1⫺p(Ewens1979; Karlinand Taylor1981).
genes, andzijas its phenotype, we have the relation
Forᏹ␦pandᐂ␦xto be finite, we need to assume thats
tends to zero asNtends to infinity and that the product z
ij ⫽zaa ⫹s[2hpij⫹ (1⫺2h)pij1pij2]. (11)
Nshas a finite limit, say. Then Equations 6 and 7 are
The expected change in frequency of A over one
valid, withᏹ␦p⫽ pqandᐂ␦x⫽pq. These expressions of
generation is
ᏹ␦pandᐂ␦xlead to the classical result (e.g., Ewens1979)
M␦p⫽
1 2nN
兺
n
i⫽1
兺
Nj⫽1
Wijpij⫺ p. (12)
u(p)⫽1⫺exp[⫺2Nsp]
1⫺ exp[⫺2Ns], (10)
To the first order ins, this is
where N is assumed to be large and s small. Despite
all the approximations done, this formula proves very
M␦p⫽ s 2nN
兺
n
i⫽1
兺
Nj⫽1 dWij
ds pij⫹o(s)
accurate for values ofsas high as 0.1, even whenN is as small as 10 (e.g., Carrand Nassar1970; Gale1990). In the following, we consider an island model of
popu-⫽ s
2nN
兺
ni⫽1
兺
Nj⫽1
冢
Wij zij
dzij ds ⫹
Wij zi
dzi ds⫹
Wij z
dz
ds
冣
pij⫹o(s), (13)lation structure and look for an expression for the prob-ability of fixation of a mutant alleleAin a population
asWijdepends onzij,zi, andz. Equations 11 and 13 give
initially fixed for allelea; pis now the frequency of A
in the whole population, while the vectorp⫽(p1, . . . ,
M␦p⫽
s
2
Wij zij
冤
2h p2
ij⫹ (1⫺2h)pij1pij2
冥
pn) gives the frequencies of A in different demes. We
suppose that the number of demes (n) is large and
defineᏹ␦pandᐂ␦pas the limits asntends to infinity of ⫹ s
2
Wij zi
冤
2h p2
i ⫹ (1⫺2h)pij1pij2pi
冥
the productsn ⫻ M␦pand n⫻ V␦p, whereM␦p andV␦p
are still the first two moments of the change ofAover
one generation. Using a simple argument, we show that ⫹ s
2
Wij z
冤
2hp2⫹(1⫺ 2h)p
ij1pij2p
冥
⫹o(s), (14)these limits can be expressed as functions of the average
frequency ofAin the population (p). A rigorous demon- where the overbar means the average among demes and stration that the process does converge to a diffusion individuals over the whole population.
(including the proof that higher-order moments vanish ᏹ
␦phas been defined as the limit of the productn⫻
in the limit as n tends to infinity) would follow the M
␦pasngoes to infinity. For this limit to be finite, we
general argument of Ethierand Nagylaki(1980) for have to assume in principle thats is of order 1/n, so
Markov chains with two timescales. Wakeley (2003) that the productnshas a finite limit asntends to infinity explains how their equations apply to island models of (for the same reason,shad to be of order 1/Nin the
structured populations. We do not repeat such argu- panmictic case—see previous section). Therefore our
ments here, but we offer an alternative presentation of method supposes a high number of demes (n high)
the same general idea. and weak selection (ssmall), although simulations will
show that these are not major constraints. As s is of order 1/n, the terms ino(s) ofM␦pvanish when we take EXPECTED CHANGE IN ALLELE FREQUENCY
the limit ofn⫻M␦pasngoes to infinity.
The different averages in Equation 14 can be seen as We use the direct fitness method (Taylorand Frank
1996; Roussetand Billiard2000) to expressM␦pas a probabilities of identity: for example,p2i is the
probabil-ity of obtaining twoAalleles after sampling two genes function of probabilities of identity and partial
deriva-tives of a fitness function. The parameters and variables with replacement from the same deme. In the diffusion limit (ntends to infinity,stends to zero,nsfinite), these of the model are summarized in Tables 1 and 2. In all
the following, the subscript ij refers to the jth adult probabilities converge to values that depend only onp, the overall frequency ofA. Again, we take the example individual of theith deme. The fitnessWijof this
individ-ual is defined as the expected number of its gametes of p2
i, the probability that two genes sampled with
re-placement from the same deme are bothA. Consider
that will participate to the next adult generation. Fitness
may depend on the phenotype of the individual, on the the two ancestral lineages of these genes backward in
time: either these lineages stay and coalesce in the same mean phenotype of the individuals present in its deme,
and on the mean phenotype in the whole population. deme or one of them (or both) migrates to another
deme before coalescence occurs; in the first case, the We callzaathe phenotype of homozygousaaindividuals
and assume that the phenotype ofAAindividuals differs expected coalescence time does not depend on the
TABLE 1
Parameters of the model
n No. of demes in the population N No. of adults per deme m Migration rate
e Extinction rate
k No. of colonizers (per extinct deme)
φ Probability that two genes sampled randomly among the 2kgametes recolonizing an extinct deme were in the same deme before migration
1,2 Probability that three genes sampled randomly among the 2kgametes recolonizing an extinct deme were in the same deme (1) or in two different demes (2) before migration
h Dominance coefficient of alleleAovera
s Phenotypic difference betweenaaandAAhomozygotes zaa Phenotype ofaahomozygotes
time becomes infinitely long asntends to infinity. This p2
ij⫽ p2⫹ rR0pq⫹ O(1/n). (16)
has been described as a separation of timescales (e.g.,
HererR
0 is the probability of coalescence for two genes
Wakeley 2003 and references therein), because
lin-sampled with replacement from the same individual, in eages in different demes coalesce at a rate inversely
a population with an infinite number of demes. related to n, while genes within demes can coalesce
DenoterD
1the probability of coalescence of two genes
within a few generations, at a rate depending on deme
sampled from the same demewithoutreplacement, and
size and migration (roughly, onm⫹1/Nin the island
rD
0 the probability of coalescence of the homologous
model), but essentially independent ofn. Therefore in
genes of an individual (still in the limit as n tends to the limit asn tends to infinity, at time t independent
infinity). We have the relations of nin the past we can consider that the two lineages
have either stayed in the same deme and coalesced (with
rR 1 ⫽
1 2N ⫹
1 2Nr
D
0 ⫹
冢
1⫺1
N
冣
rD
1 (17)
a probability that we callrR
1) or have migrated to
differ-ent demes and have not coalesced (with probability 1⫺
and
rR
1). Thus the probability that our two genes are A is
equal to rR
1pt ⫹ (1⫺ rR1)p2t, wherept is frequency of A
rR 0 ⫽
1
2⫹
1 2r
D
0. (18)
in the whole population at timet. However, in the limit asntends to infinity andstends to zero, the frequency
rD
0 can be shown to be equivalent to Wright’sFITin the
ofAin the population does not change over the finite
infinite island model. Aspij1pij2is the probability that the
number t of generations, thus pt ⫽ p, the present
fre-two homologous genes of an individual are bothA, we quency ofA. Therefore
have
p2
i ⫽rR1p⫹(1 ⫺rR1)p2⫹O(1/n)
pij1pij2⫽p2⫹rD0pq⫹ O(1/n). (19)
⫽p2⫹rR
1pq⫹O(1/n). (15)
Last, we need the limit as n tends to infinity of This expression, as well as all further expressions
involv-pij1pij2pi, which measures the probability that the two
ingO(1/n) terms, is an average over all parental
popula-homologous genes of an individual and a third gene tions with the same value ofp. These parental
popula-sampled from the same deme are allA. We callaRthe
tions may differ in the frequency of demes with different
limit as n tends to infinity of the probability that the copies of theAallele, so that for each possible parental
three lineages coalesce before one of them moves to populationp2
i may depart from the above average. But another deme,
bRthe limit of the probability that only
the magnitude of these differences vanishes as the
num-two of them stay in the same deme and coalesce, and ber of demes increases, which allows us to use diffusion
cR ⫽ 1⫺ aR ⫺bR the limit of the probability that two
equations (see Wakeley 2003, Equation 33, and also
lineages move to different demes before any coales-Ethierand Nagylaki1980, Equation 1.5). In the
infi-cence event has occurred. We have nite island model, one recovers the classical expression
pij1pij2pi ⫽aRp⫹bRp2⫹ cRp3⫹O(1/n)
p2
i ⫽p2⫹ rR1pqfor inbreeding coefficients (e.g., Crow
and Kimura 1970). Here rR
1 is equivalent to Wright’s ⫽
p3⫹aRpq⫹(1⫺cR)p2q⫹O(1/n). (20)
FST(Hudson1998; Rousset 2002).
The same reasoning is used to calculate the limit of DenoteaD,bD, andcDthe same probabilities when the
third gene is sampled in a different individual. We have
p2
ij, which is the probability that two genes sampled with
TABLE 2
Variables of the model
zij,zi,z Phenotype of individualjin demei, mean phenotype in demei, and mean phenotype in the population pij1,pi j2 Frequency ofAat each of the homologous chromosomes of individualjin demei
pij,pi,p Frequency ofAin individualjin demei, frequency ofAdemei, and frequency ofAin the population Wij Fitness of individualjin demei
rR
0,rD0 Probability that the ancestral lineages of two genes sampled with (R) or without (D) replacement from the same adult individual coalesce before one of them moves to a different deme, in the limitngoes to infinity rR
1,rD1 Same probability for two genes sampled with (R) or without (D) replacement from the same deme
aR,aD Probability that the ancestral lineages of the two homologous genes of an individual, plus a third gene sampled with (R) or without (D) replacement from the same deme, all coalesce before one of them moves to a different deme, in the limit asngoes to infinity
bR,bD Probability that only two of the three lineages coalesce before one moves to a different deme, in the same case cR,cD Probability that two lineages move to different demes before any coalescence has occurred, in the same case
frequencies). By definition,Neis the variance effective
aR⫽ 1
Nr
D
0 ⫹
冢
1⫺1
N
冣
aD (21)
population size (Ewens1982).
When e ⫽ 0 (no extinction), covariances in the
and change in allele frequencies in different demes equal
zero (because sampling occurs independently in each
cR⫽
冢
1⫺ 1N
冣
cD. (22)
deme). Equations A1–A5 ofappendix alead to
V␦p⫽
2(1⫺rD
1)⫺(1⫺ rD0)
2nN pq⫹ o(1/n), (26)
Because adult population size remains constant after regulation, the partial derivatives of the fitness function
sum to zero (Roussetand Billiard2000); therefore which is of the formpq/2Ne, with
we can expressM␦pas a function of the two first partial
derivatives only. After replacing the average products Ne⫽ nN
2(1⫺rD
1)⫺(1 ⫺rD0)
, (27)
of allele frequencies by the expressions calculated
above, we obtain a result known under the formnN/(1⫺F
ST)(1⫹ FIS),
whereFST⫽rD1 andFIS⫽(rD0 ⫺ rD1)/(1⫺ rD1) (see Wang
M␦p⫽
s 2
Wij
zij
[h(1⫹rD
0)⫹(1⫺2h)[r0D⫹(1⫺rD0)p]]pq
and Caballero1999 for a more general result). In the case of gametic migration, monoecious individuals, and ⫹s
2
Wij
zi
[2hrR
1⫹(1⫺2h)[aR⫹(1⫺cR⫺rD0)p]]pq⫹o(1/n). random fertilization, we haverD0 ⫽ rD1, giving (23)
Ne⫽
nN
1⫺ rD 1
. (28)
VARIANCE IN ALLELE FREQUENCY CHANGE Extinctions add an additional complication because they introduce correlations in the change in allele fre-To use the diffusion method, we also need the limit
quency in different demes (because the frequency ofA
asntends to infinity ofn⫻V␦p, whereV␦p⫽E[(␦p)2|p]
in the migrant pool depends on which demes did sur-and␦pis the change in frequency ofAover one
genera-vive). We show in appendix a that when e ⬎ 0, the
tion. We have
variance effective population size is
V␦p⫽Var0[p⬘]⫹o(1/n), (24)
Ne⫽
n(1 ⫺e) 2rR
1[1⫺ (1⫺e)2(1⫺ m)2]
. (29)
wherep⬘ ⫽p⫹ ␦pand Var0is the variance in the neutral
case (s⫽0). We look for an expression for Var0[p⬘] to
This is also the eigenvalue effective size (Ewens1979, the first order in 1/n. We have
1982), derived by several independent arguments in
Rousset (2003).
Var0[p⬘]⫽ 1 n2兺
n
i⫽1 Var0[p⬘
i]⫹ 1 n2
兺
n
i⫽1
兺
j⬆i Cov0[p⬘i,p⬘j]. (25)
PROBABILITIES OF COALESCENCE
We show inappendix athat these variance and
covari-ance terms can be expressed, to first order in 1/n, as The expressions forM␦pandV␦pderived in the
previ-ous sections involve variables representing variprevi-ous prob-functions of the frequency ofAin the whole population
(p) and an effective population sizeNedepending on abilities of coalescence in a neutral model, evaluated in
calculated by writing recurrence equations (which will randomly in the whole population after migration (in this caseφ⫽ 1 ⫽ 2⫽ 0), and the “propagule pool,”
depend on the life cycle considered) and calculating
values at equilibrium. These recurrence equations are where the 2kgametes were all in the same deme after
migration [in this case φ⫽ (1 ⫺ m)2,
1 ⫽ (1⫺ m)3,
given inappendix bfor three different cases: (i)
mono-ecious individuals with random fertilization, gametic and 2 ⫽ 3m(1 ⫺ m)2]. When the extinction rate e is
O(m) we obtain migration, and no extinction; (ii) monoecious
individu-als with rate␣of self-fertilization, zygotic migration, and
no extinction; and (iii) monoecious individuals with rD
0 ⫽ rD1 ⬇
1⫹eN/k
1⫹4M⫹ 2eN[1⫺φ(1⫺ 1/2k)]. (34) random fertilization, gametic migration, extinction rate
e, and gametic recolonization. Here we give only
approx-This approximation follows from the recursion (B20) imate solutions assuming that migration rate is small
inappendix band was also obtained by Whitlockand
and deme size large, so thatN⫽O(1/m), and neglecting
McCauley (1990). We could not obtain any simple
terms in O(m).
approximation foraD,bD, andcD.
Case i: random fertilization, no extinction: Approxi-mating Equations B5–B9 for smallmand largeN, one
obtains (withM⫽ Nm)
EXAMPLES OF FITNESS FUNCTIONS rD
0⫽rD1⬇
1
1⫹4M, (30) We consider two cases of individual selection: “soft”
and “hard” selection. The first case corresponds to a
(aD,bD,cD)⬇
冢
1(1⫹4M)(1⫹2M),
6M (1⫹4M)(1⫹2M),
8M2
(1⫹4M)(1⫹2M)
冣
. regulation of the number of gametes (or zygotes)pro-duced by the different surviving demes just before mi-(31)
gration, while in the second case there is no such regula-These approximations are also valid for zygotic migra- tion. However, in both cases there is a phase of population
tion and dioecious individuals (not shown). Although, regulation, as N adults are sampled in each deme at
as found by Whitlock (2002), these approximate ex- the end of every generation. This definition of hard
pressions satisfy the relationaD⫽2(rD
1)2/(1⫹ rD1), this selection is the same as in Barton(1993), but different
is no longer the case when the exact expressions (given from in Whitlock(2002), which explains some
discrep-inappendix b) are used. ancies between our results and results in Whitlock
Case ii: partial self-fertilization, no extinction:Here we (2003). In Whitlock’s hard selection model, each deme assume that self-fertilization occurs at a rate ␣ and that contributes to the next adult generation in proportion fertilization precedes migration. Random fertilization cor- to the number of juveniles produced in the deme before
responds to␣ ⫽1/N. We obtain the approximations migration; although this definition sounds simple, we
do not know any realistic life cycle maintaining a
con-rD 0 ⬇
1⫹2␣M
1⫹ 2(2⫺ ␣)M, r
D 1 ⬇
1
1⫹ 2(2⫺ ␣)M, (32) stant population size in this case.
In both cases, we fixzaa to zero and assume that an
individual of phenotype zij produces a number of
ga-aD⬇ 1⫹ ␣M
[1⫹2(2⫺ ␣)M][1⫹(2 ⫺ ␣)M], metes proportional to 1⫹zij; the numbers of gametes
produced byAaandAAindividuals, relative toaa indi-viduals, are then 1⫹shand 1 ⫹s, respectively.
bD⬇ 2M[3⫺ ␣
2M⫹2␣(M⫺1)]
[1⫹2(2⫺ ␣)M][1⫹ (2⫺ ␣)M], We note at this point that we need only the limit as
n tends to infinity of the fitness function, as terms of
cD⬇ 4(1⫺ ␣)(2⫺ ␣)M2
[1⫹2(2⫺ ␣)M][1⫹ (2⫺ ␣)M]. (33) order 1/nand higher will vanish when we will calculate
ᏹ␦p—see Equation 23.
Case iii: random fertilization, extinctions:We assume Soft selection:In this case, we assume that the number
here that both migration and recolonization are ga- of gametes produced in each deme is regulated before
metic. In the life cycle section, we introduced the migration to a constant value that is the same for all
parametersk(number of colonizers) andφ(probability demes; we suppose that this value is still very large.
of common origin). More precisely, φ measures the Recall that the fitness of individual ij is the expected
probability that two genes sampled randomly among number of its gametes that will participate to the next
the 2kgametes colonizing an extinct deme were in the adult generation. We obtain
same deme before migration. We also need the
parame-ters 1 and 2, defined as the probabilities that three Wij⫽2N(1⫺e)
冤
(1⫺m) 1⫹zijN(1⫹zi)
⫹m 1⫹zij
N(1⫹zi)
genes sampled randomly among the 2kcolonizers were in the same deme before migration (1) or in two
differ-⫹ e
1 ⫺e
1⫹zij
N(1⫹zi)
冥
⫹O(1/n) . (35)
ent demes (2). Following Slatkin (1977), we
distin-guish two modes of recolonization: the “migrant pool,”
if its deme survives (probability 1⫺ e). The first term selection means no selection whenN⫽ 1. In the case in the parentheses is the frequency of gametes produced of zygotic migration,Nhas to be replaced byN(2N)/ by individualij present in demei after migration; the (2N⫺1) in Equation 39, whileN⫺1 has to be replaced
second term is the frequency of gametes produced by byN(2N⫺2)/(2N⫺1) in Equation 40. These
differ-ijin any other nonextinct deme, after migration, times ences are significant only for small values ofN.
the number of other nonextinct demes; and the third Therefore, in the additive case with no extinction,
term is the frequency of gametes produced byijin the probabilities of fixation depend neither on population
pool of recolonizers, times the number of extinct demes. structure nor on inbreeding, as found by Maruyama
Simplifying Equation 35 leads to (1970), except for effects of order 1/Nthat have been
ignored in previous analyses. Previous simulation
stud-Wij⫽ 2
1⫹zij
1⫹zi
⫹O(1/n) , (36) ies have also missed them, often because large values
of N were assumed. When extinctions occur (e ⬎ 0), givingWij/zij ⫽2,Wij/zi⫽ ⫺2 (derivatives have to the expression ofGis more complex and depends on
be evaluated fors⫽0, which means herezij,zi,z⫽ 0). population structure. For example, under soft selection
Hard selection: Here we assume that the number of and haploid migration, we find gametes or juveniles produced in a deme before migration
is not regulated: a deme fixed forAproduces 1⫹stimes G(x)⫽exp
冦
⫺n(N⫺1)(1⫺e)s 2(1⫺r D1)⫺(1⫺rD0) rD1N[1⫺(1⫺e)2(1⫺m)2]
冧
.the number of gametes (or juveniles) produced in a deme
(41) fixed fora. Here the fitness function is given by
Effects of dominance: Whenh⬆ 1⁄
2, the functionG
Wij⫽2N(1⫺e)
冤
(1⫺ m)(1⫹ zij)
N[(1⫺m)(1⫹zi)⫹m(1⫹z)] is a complicated function of the parameters. Here we
present some results relative to case i (monoecious indi-viduals with random fertilization, gametic migration,
⫹m 1⫹zij
N[1⫹z]⫹
e
1⫺ e
1⫹zij
N[1⫹z]
冥
and no extinction). If we assume thatmis small andNlarge, so that we can use approximations 30 and 31, we
⫹O(1/n). (37)
obtain Again, the first term in the parentheses represents the
proportion of gametes produced by individualijpresent G(x)⬇exp
冦
⫺2nNsx1⫹ 2Nmx⫹ 4Nmh(1⫺ x)1⫹2Nm
冧
,in demeiafter migration (provided that demeidid not
(42) go extinct); the second term is the average proportion
of gametes produced byijin the other nonextinct demes,
which has to be integrated numerically to obtainu(p), after migration, times the number of other nonextinct
the probability of fixation ofA. For advantageous muta-demes; and the third term is the proportion of gametes
tions (s⬎0), a crude approximation can be obtained produced by ij in the pool of recolonizers, times the
by neglecting terms inx2in the expression ofG, giving
number of extinct demes (we assume that surviving demes contribute to the pool of colonizers in
propor-u
冢
12nN
冣
⬇ s1⫹ 4Nmh
1⫹ 2Nm . (43)
tion of the total number of gametes present in the deme). Equation 37 leads to
We found that this approximation often gives a good
Wij⫽2(1⫺e)
冤
(1⫺m)(1⫹zij)
1⫹(1⫺m)zi⫹mz
⫹
冢
m⫹ e1⫺e
冣
1⫹zij1⫹z
冥
idea of the probability of fixation of a rare advantageousallele, except when both the migration rate is large and ⫹O(1/n), (38) his close to zero.
Figure 1 shows the probability of fixation of a rare ad-givingWij/zij⫽ 2,Wij/zi ⫽ ⫺2(1⫺ e)(1⫺m)2.
vantageous allele as a function of its dominance coeffi-cient, for different values of the migration rate. Here we
RESULTS used the exact expressions of the probabilities of
iden-tity for case i (given inappendix b); however, Equation
Additivity:In the additive case (h⫽1⁄
2) and when no
43 gives very close results (not shown). We used the soft extinction occurs (e⫽0), simple results are obtained.
selection model, but under hard selection the results Under hard selection and gametic migration one arrives
are qualitatively and quantitatively very similar for large at
N. Figure 1 illustrates the fact that population structure
G(x)⫽exp[⫺2nNsx] , (39)
increases the probability of fixation of recessive advanta-geous mutants, while it decreases the probability of fixa-while under soft selection and gametic migration,
tion of dominant advantageous mutants. It also shows
G(x)⫽exp[⫺2n(N⫺ 1)sx] . (40)
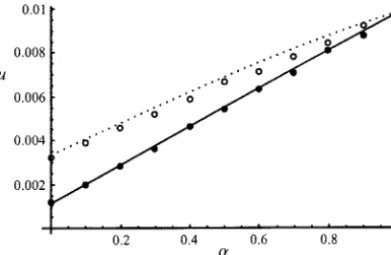
Figure 2.—Probability of fixation of a recessive advanta-geous mutation (s⫽0.01,h⫽0), as a function of the rate of self-fertilization (␣). Individuals are monoecious and
migra-Figure1.—Probability of fixation of an advantageous
muta-tion is zygotic. Number of demes,n⫽200; deme size,N⫽ tion (s⫽0.01) when present as a single copy, as a function of
100; no extinction occurs (e⫽0). Results from the diffusion its dominance coefficient (h). Migration is gametic, individuals
model are: dotted line, migration ratem⫽ 0.01; solid line, are monoecious with random fertilization, and no extinction
migration ratem⫽0.05. Simulation results are: open circles, occurs (e⫽0). Number of demes,n⫽200; deme size,N⫽
m⫽0.01; solid circles,m⫽0.05. 100. Results from the diffusion model are: dotted line,
migra-tion ratem⫽0.1; dotted/dashed line,m⫽0.01; dashed line, m⫽0.001. Simulation results are: solid circles,m⫽0.1; open
(e.g., Kimura 1962). Using a low-migration limit, Lande
circles, m⫽0.01; squares, m⫽0.001. The solid line
corre-sponds to Slatkin’s (1981) low migration limit. (1985) showed that local extinctions can increase the probability of fixation of underdominant mutations, in an island model of population structure. This effect has
migration approximation performs better (this is dis- also been observed by simulation in a two-dimensional
cussed later). stepping-stone model (Michalakisand Olivieri1993).
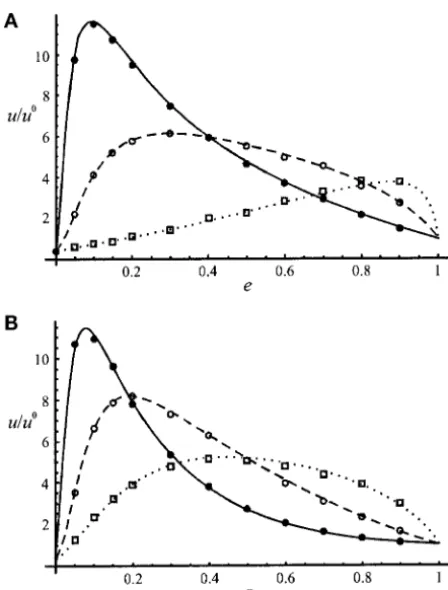
Effects of selfing:In case ii (monoecious individuals Figure 3 represents the probability of fixation of an with rate ␣ of self-fertilization, zygotic migration, and underdominant mutation, relative to a neutral
muta-no extinction), approximations (32) and (33) lead to tion, as a function of the extinction rate e, and for
different values ofk, the number of colonizers. Figure G(x)⫽exp
冦
⫺2nNsx冤
2h⫹(1⫺2h)1⫹(2⫺ ␣)Nm[␣ ⫹(1⫺ ␣)x]1⫹(2⫺ ␣)Nm
冥冧
, 3A corresponds to the migrant pool model ofcoloniza-tion, while Figure 3B corresponds to the propagule pool (44)
model. We used the soft selection model, but again which has to be integrated numerically. Neglecting the results are very similar with hard selection (not shown). terms inx2, we obtain a crude approximation for
advan-The effect of the rate of extinction on the fixation
proba-tageous mutations: bility of the mutant is nonmonotonic. This may result
from two opposite forces: extinctions increase the
prob-u
冢
12nN
冣
⬇ s1⫹ (2⫺ ␣)[␣ ⫹2h(1⫺ ␣)]Nm
1⫹ (2⫺ ␣)Nm . (45) ability that an advantageous AA genotype will appear
before alleleAis lost, in particular when the number of colonizers is small, but also decrease the chance of Figure 2 shows the effect of partial self-fertilization
fixation ofAonceAAgenotypes have been created (by on the probability of fixation of a recessive advantageous
increasing random drift, extinctions reduce the proba-mutation (h⫽0). Again, we used the exact expressions
bility of fixation of advantageous alleles). of the probabilities of identity and integrated
numeri-cally the G function, but Equation 45 gives very close results. We still observe a discrepancy between analytical
DISCUSSION
and simulation results at small values ofm.
Effects of the extinction rate: Figure 3 shows some Figures 1 and 2 show that the analytical model gives good predictions when the migration rate is not too results concerning case iii (monoecious individuals with
random fertilization, gametic migration, extinction rate small, while for small values ofmpredictions are not as
good (except when h ⫽ 1⁄
2 and e ⫽ 0, since in that
e, and gametic recolonization), taking the example of
an advantageous underdominant mutant. Underdomi- case we obtain an expression independent onmfor the
probability of fixation). This comes from the fact that nance corresponds to the case where heterozygotes are
disadvantaged (h⬍0); it can result from chromosomal we calculated the probabilities of coalescence before migration (r0,r1,a,b,c) in the neutral case (s⫽ 0); as
rearrangements (Lande1985) and possibly from
muta-tions affecting transcriptional regulation during the de- sincreases, these probabilities become more and more different from the neutral values, and this difference velopment (Gibson1996). In a large panmictic
TABLE 3
Accuracy of the diffusion results
s⫽0.2 s⫽0.1 s⫽0.05 s⫽0.01
n⫽5 0.020953 0.013665 0.009097 0.003737 0.018484 0.012514 0.008583 0.003642 n⫽10 0.016542 0.010498 0.006839 0.002721 0.014920 0.009834 0.006472 0.002705 n⫽20 0.013498 0.008288 0.005254 0.002003 0.012631 0.007933 0.005151 0.001974 n⫽50 0.010930 0.006383 0.003870 0.001369 0.010594 0.006179 0.003783 0.001343
Probability of fixation of alleleAwhen present as a single copy, for different values ofnands. Heree⫽0 (no extinction), N⫽ 100, h⫽0, and m⫽ 0.1; individuals are monoecious, fertilization is random and migration is gametic. The value at the top of each cell is the diffusion result, and the value at the bottom has been obtained by simulation (5 million replicates for each set of parameters).
gives accurate results for values ofn as low as 10 and values ofs as high as 0.1. When the exact expressions of the probabilities of identity are used, no other as-sumption needs to be made; for example, deme size (N) and rate of extinction (e) can be arbitrarily large Figure 3.—Probability of fixation of an underdominant
advantageous mutation (s⫽ 0.02, h ⫽ ⫺0.1) relative to a or small. This is a difference between the approach used
neutral mutation, as a function of the extinction rate (e). in Cherryand Wakeley(2003), Cherry(2003a), and Individuals are monoecious with random fertilization, and Whitlock(2003) and our approach. Indeed, these au-migration and recolonization are gametic; number of demes,
thors calculate various quantities that are similar to the
n⫽ 200; deme size, N ⫽ 100; migration rate, m ⫽ 0.1. A
probabilities of identity in Equation 14 by using the fact
corresponds to the “migrant pool” model and B to the
“propa-gule pool” model. Results from the diffusion model are: solid that the distribution of allele frequencies among demes
line, number of colonizersk⫽2; dashed line,k⫽10; dotted can be approximated by a-distribution whenNis large line,k⫽100. Simulation results are: solid circles,k⫽2; open andmis small. From our coalescent argument, we obtain circles,k⫽10; squares,k⫽100.
the first moments of the distribution of allele
frequen-cies among demes without having to assume thatN is
large orm small. In fact, Cherry (2003a) and
Whit-lock’s (2003) approximations for theG function are
what matters in the argument based on a separation of
timescales is that changes in allele frequencies within the same as our Equation 42, which assumes small m
and largeN. We found that Equation 42 gives satisfying demes, due to drift and migration, are fast relative to
selection (see also Wakeley2003), hence thatsis small results as long as deme size is not too small; for small values ofN, however, using the exact expressions ofr0,
relative to m ⫹ 1/N. In practice, the validity of the
diffusion approximation depends on weak selection r1,a, andcgives more precise results. For example, with
n⫽50,N⫽15, andm⫽0.3, Equation 42 predicts that (smalls) and not-too-small migration (roughly,m⬎s).
This can also be expressed in terms of our coalescent the probability of fixation of a deleterious allele withs⫽
⫺0.005 andh⫽0 (relative to a neutral allele) is 0.0072, argument: for relatively high values ofm, two lineages
from the same deme either separate to different demes while using the exact expressions of r1,a, andc gives a
value of 0.01128, and simulations give 0.01121 (for soft (in the past) or coalesce rapidly within the deme, and
during this short time selection does not have much selection). Although assuming either hard or soft
selec-tion does not make much difference whenN is large
effect. For small values of the migration rate, however,
the mean within-deme coalescence time becomes longer, andmsmall (indeed, Equation 42 holds in both cases), this is not the case whenNis small, as can be shown by and the effect of selection during that time cannot be
neglected any more. using expressions of theG function that do not make
any assumption onNandm—obtained from equations
Although the validity of the diffusion approximation
depends on a large number of demes (large n) and B5–B9 and 36 and 38. This is illustrated by Figure 4,
which shows the probability of fixation of a recessive weak selection (small s), these two conditions are in
Figure5.—Effect of population structure on the probability
Figure4.—Probability of fixation of an advantageous
reces-of fixation reces-of a recessive advantageous mutation (s ⫽0.01, sive mutation (h⫽0,s⫽0.02), relative to a neutral mutation,
h⫽0).x-axis, migration rate;y-axis, probability of fixation of as a function of deme size (N). Migration is gametic,
individu-the mutation when present as a single copy. Migration is ga-als are monoecious with random fertilization, and no
extinc-metic and fertilization random; extinctions do not occur (e⫽ tion occurs (e⫽ 0). Number of demes,n⫽100; migration
0). Solid line,n⫽1000,N⫽10; dashed line,n⫽100,N⫽ rate, m⫽0.3. Dashed line, soft selection; dotted line, hard
100; dotted line,n⫽10,N⫽1000. selection; solid line, approximation (42) for Nlarge and m
small.
mechanically from the fitness function with minimal risk of error by the “direct fitness” method, where the and from Equation 42, for low values ofN. These
exam-fitness function itself is a direct expression of the life ples show that using exact values of the probabilities
cycle considered. This method has been useful for ana-of coalescence leads to more precise approximations;
lyzing selection on various traits under different popula-moreover, exact values ofr0,r1,a, andccan be calculated
tion structures (e.g., Taylorand Frank1996; Rousset without too much difficulty for many different life
cy-and Gcy-andon 2002). In this context, fitness has to be cles, while it is not always easy to obtain approximations
defined as the expected number of “successful” gametes for the distribution of allele frequencies among demes
of an individual, i.e., those that effectively participate (for example, when extinctions occur).
to the gene pool of the next adult generation. Many Barton(1993) obtained approximations for the
proba-different uses of the word “fitness” can be found in the bility of fixation of a single mutant in a model with
literature; it often means “relative fecundity” or “relative extinction and additive selection, assuming that deme
survival.” Defining a fitness function as we do proves size is large. We observed that his approximation for
to be useful since it leads to general expressions like
the case φ⫽ 0 (Equation 11b in Barton 1993) gives
Equation 23. similar results as our solution when migration and
ex-The direct fitness method used here has also proven tinction rates are small (not shown); however, in our
convenient to study kin selection (Taylorand Frank
model recolonization does not occur exactly as in
Bar-1996; Roussetand Billiard2000). A substantial part ton(1993); therefore, one must be cautious when
com-of kin selection theory has been devoted to the evolution paring our results.
of altruistic traits; in some cases, it can be shown that An important consequence of population subdivision
such traits always increase in frequency if a condition is an increase of the fixation probability of recessive
of the form⫺c⫹rb⬎0 holds, wherecandbare the cost advantageous mutations. Figure 5 shows this effect for
and benefit of the altruistic act, andrthe “relatedness” a population of size 10,000; the different curves
corre-between interactants, assumed to be independent of the spond to different modes of subdivision (10 demes of
frequency of the allele coding for altruism (Hamilton 1000 individuals, 100 demes of 100 individuals, and 1000
1964). Whether such a condition exists is not always demes of 10 individuals). One can see that the increase
obvious, and the present application of the direct fitness in fixation probability of the recessive mutation is
sub-formalism may clarify such problems, since from Equa-stantial only with “strong” population structure (small
tion 23 one easily obtains conditions under which an migration rate and/or small deme size); a moderate
allele increases in frequency in a structured population.
structure such as N ⫽ 100, m ⫽ 0.1 has virtually no
For example, whenh⫽1⁄
2, Equation 23 shows thatM␦p
effect on the fixation probability of recessive alleles.
is always positive provided that We have demonstrated a simple method to construct
diffusion approximations for populations subdivided ac- W
ij zij
⫹ 2rR1
1⫹rD 0
Wij zi
⬎ 0 . (46)
cording to an island model. It is based on the separation of timescales and on the additional fact that for the
Cherry, J. L., 2003a Selection in a subdivided population with
domi-obtains by modern inclusive fitness techniques; it shows
nance or local frequency dependence. Genetics163:1511–1518.
that⫺c,b, andrhave to be defined asWij/zij,Wij/zi, Cherry, J. L., 2003b Selection in a subdivided population with local extinction and recolonization. Genetics164:789–795.
and 2rR
1/(1⫹rD0), respectively. Whenh⬆1⁄2we can also
Cherry, J. L., and J. Wakeley, 2003 A diffusion approximation for
define a relatedness coefficient from Equation 23, but
selection and drift in a subdivided population. Genetics 163:
now this coefficient depends onp, the frequency ofA. 421–428.
Crow, J. F., and M. Kimura, 1970 An Introduction to Population Genet-Conversely, our model can be used to include the effects
ics Theory. Harper & Row, New York.
of genetic drift in kin selection models and derive
fixa-Ethier, S. N., and T. Nagylaki, 1980 Diffusion approximations of
tion probabilities and fixation times of alleles coding Markov chains with two time scales and applications to population
genetics. Adv. Appl. Prob.12:14–49.
for altruistic behaviors.
Ewens, W. J., 1979 Mathematical Population Genetics. Springer-Verlag,
Many other applications are outside the scope of this
Berlin.
article, but are worth mentioning. For example, one can Ewens, W. J., 1982 On the concept of effective population size.
Theor. Popul. Biol.21:373–378.
compute the distribution of allele frequency of recessive
Gale, J. S., 1990 Theoretical Population Genetics. Unwin Hyman, London.
deleterious alleles in a metapopulation and consider
Gibson, G., 1996 Epistasis and pleiotropy as natural properties of
the implication of different demographic regimes on the transcriptional regulation. Theor. Popul. Biol.49:58–89.
Hamilton, W. D., 1964 The genetical evolution of social behaviour.
purge of such alleles. Average times to fixation or loss of
J. Theor. Biol.7:1–52.
new alleles are easily obtained once the expressions
Hudson, R. R., 1998 Island models and the coalescent process. Mol.
of M␦p andV␦p are known (Crowand Kimura 1970); Ecol.7:413–418.
Karlin, S., and H. M. Taylor, 1981 A Second Course in Stochastic although in this article we focused on fixation
probabili-Processes. Academic Press, New York.
ties, fixation times are equally important in
determin-Kimura, M., 1962 On the probability of fixation of mutant genes
ing the rate of evolution of populations. Cherry and in a population. Genetics47:713–719.
Kimura, M., 1964 Diffusion models in population genetics. J. Appl.
Wakeley(2003), Cherry(2003b), and Whitlock(2003)
Prob.1:177–232.
showed that the diffusion method provides good
ap-Lande, R., 1985 The fixation of chromosomal rearrangements in a
proximations for fixation times in structured popula- subdivided population with local extinction and colonization. Heredity54:323–332.
tions. In general, a lower rate of migration slows down
Maruyama, T., 1970 On the fixation probability of mutant genes
fixation, while extinction/recolonization can speed it up. in a subdivided population. Genet. Res.15:221–225.
One may wonder about the generality of the present Michalakis, Y., and I. Olivieri, 1993 The influence of local extinc-tions on the probability of fixation of chromosomal rearrangements.
approach with respect to the type of population
struc-J. Evol. Biol.6:153–170.
ture. Although in this article we stayed in the framework Pannell, J. R., and B. Charlesworth, 1999 Neutral genetic diver-of the island model, the methodology presented here sity in a metapopulation with recurrent local extinction and
recol-onization. Evolution53:664–676.
can be used with other spatial models, as long as
coales-Rousset, F., 2002 Inbreeding and relatedness coefficients: what do
cence occurs at two different timescales: a fast one dur- they measure? Heredity88:371–380.
ing which selection can be neglected and a slow one Rousset, F., 2003 Effective size in simple metapopulation models. Heredity91:107–111.
that becomes infinitely long as population size tends to
Rousset, F., 2004 Genetic Structure and Selection in Subdivided Popula-infinity. This is the case, for example, for cytoplasmic tions. Princeton University Press, Princeton, NJ.
genes: coalescence is fast if lineages are sampled within Rousset, F., and S. Billiard, 2000 A theoretical basis for measures of kin selection in subdivided populations: finite populations and
the same organism and slow if they are sampled in
localized dispersal. J. Evol. Biol.13:814–825.
different organisms. The two scales can also be family Rousset, F., and S. Gandon, 2002 Evolution of the distribution of
dispersal distance under distance-dependent cost of dispersal. J.
vs. population (e.g., Caballero and Hill 1992). In
Evol. Biol.15:515–523.
these examples many questions arise about conflicting
Slatkin, M., 1977 Gene flow and genetic drift in a species subject
levels of selection; multilevel selection is easily incorpo- to frequent local extinctions. Theor. Popul. Biol.12:253–262. Slatkin, M., 1981 Fixation probabilities and fixation times in a
rated into this framework by redefining the fitness
func-subdivided population. Evolution35:477–488.
tion. Takahata, N., 1991 Genealogy of neutral genes and spreading of
selected mutations in a geographically structured population. We thank Joshua Cherry, John Wakeley, and Michael Whitlock for
Genetics129:585–595. providing articles in press and Joshua Cherry, Montgomery Slatkin,
Taylor, P. D., and S. A. Frank, 1996 How to make a kin selection John Wakeley, Michael Whitlock, and an anonymous reviewer for
model. J. Theor. Biol.180:27–37.
helpful comments on the manuscript. This is paper ISEM 2003–79. Wade,M. J., and D. E. McCauley, 1988 Extinction and
recoloniza-tion: their effects on the genetic differentiation of local popula-tions. Evolution42:995–1005.
Wakeley, J., 2003 Polymorphism and divergence for island-model species. Genetics163:411–420.
LITERATURE CITED
Wang, J., and A. Caballero, 1999 Developments in predicting the Barton, N. H., 1993 The probability of fixation of a favoured allele effective population size of subdivided populations. Heredity82:
in a subdivided population. Genet. Res.62:149–157. 212–226.
Caballero, A., and W. G. Hill, 1992 Effects of partial inbreeding Whitlock, M. C., 2002 Selection, load and inbreeding depression on fixation rates and variation of mutant genes. Genetics131: in a large metapopulation. Genetics160:1191–1202.
493–507. Whitlock, M. C., 2003 Fixation probability and time in a metapopu-Carr, R. N., and R. F. Nassar, 1970 Effects of selection and drift lation. Genetics164:767–779.
on the dynamics of finite populations. I. Ultimate probability of Whitlock, M. C., and N. H. Barton, 1997 The effective size of a subdivided population. Genetics146:427–441.
Whitlock, M. C., and D. E. McCauley, 1990 Some population We then need to calculate the average covariance of genetic consequences of colony formation and extinction:
ge-the change in frequency ofAin different demes, to the
netic correlations within founding groups. Evolution44:1717–
1724. first order in 1/n. We start by noting that at the begin-ning of the life cycle, the probability of sampling two
Communicating editor:L. Excoffier
Aalleles with replacement isp2if we sample them from
the whole population, p2
i if we sample them from the APPENDIX A same deme, and pipj if we sample them from different
demes (i⬆ j). This gives
No extinction:Whene⫽ 0,V␦pis given by
p2⫽ 1
np
2
i ⫹
冢
1⫺1
n
冣
pipj (A11)V␦p⫽
1
n2
兺
ni⫽1
Var0[p⬘
i]⫹o(1/n) (A1)
since the covariance in the change in allele frequency and sincep2
i tends top2⫹rR1pqasntends to infinity,
in two different demes equals zero (sampling occurs independently in each deme). We have
pipj⫽p2⫺
1
nr
R
1 pq⫹o(1/n). (A12)
Var0[p⬘
i]⫽E0[p⬘i]E0[q⬘i]⫺ E0[p⬘iq⬘i] (A2)
We have and
E0[p⬘
i]⫽(1 ⫺m)pi⫹mp (A3) Cov[p⬘i,p⬘j]⫽E[p⬘ip⬘j]⫺ E[p⬘i]E[p⬘j]. (A13)
and since the averages overi ofE0[p⬘
iq⬘i] andp⬘iq⬘i both From Equations A9 and A12 we obtain the second term
tend to (1⫺ rR
1)pqasntends to infinity, we obtain of the covariance:
V␦p⫽
1
n[1⫺ (1⫺m)
2]rR
1pq⫹ o(1/n) 1
n2
兺
i⬆jE[p⬘i]E[p⬘j]⫽p2⫺ 1 n(1⫺e)
2(1⫺m)2rR
1pq⫹o(1/n).
(A14) ⫽ (rR
1 ⫺rD1)
pq
n ⫹o(1/n) (A4)
The first term of the covariance is the probability of sampling twoAalleles from two different demes, at the asrD
1 ⫽(1⫺ m)2rR1. Using Equation 17, one arrives at
next generation. With a probability of order 1/n, these two lineages come from the same deme in the
previ-V␦p⫽
2(1⫺rD
1)⫺ (1⫺rD0)
2nN pq⫹o(1/n) (A5) ous generation and are both A with probability p2 ⫹
rR
1pq⫹O(1/n), while with a probability of order 1 they
and thus we can define a variance effective population
come from different demes, in which case the probabil-size as
ity that they areAis given by Equation A12. We calculate the probability that they come from the same deme as
Ne⫽
nN
2(1⫺rD
1)⫺ (1⫺rD0)
(A6)
follows: if the two demes where the genes are sampled have not become extinct in the previous generation so that
[probability (1⫺ e)2], the probability that the two
lin-eages come from a single deme in the previous
genera-V␦p⫽
pq
2Ne
⫹o(1/n). (A7)
tion is
Extinction-recolonization:Extinctions introduce cor- 1⫺(1⫺ m)2
n(1 ⫺e) ⫹ o(1/n) , (A15)
relations in the change in allele frequency in different demes (because the frequency ofAin the migrant pool
depends on which demes did survive).V␦pis expressed as while if one or both demes became extinct [probability
1⫺(1⫺e)2], this probability is 1/[n(1⫺e)]. Taking V␦p⫽
1
n2
兺
n
i⫽1
Var0[ p⬘i]⫹
1
n2
兺
n
i⫽1j
兺
⬆iCov0[
p⬘i,p⬘j]⫹o(1/n). (A8) all cases into account, one arrives at
The first term is obtained as above. Var0[p
i⬘] is still given 1 n2
兺
i⬆j
E[p⬘ip⬘j]⫽p2⫹
冤
1⫺(1⫺e)2(1⫺ m)2 n(1⫺e)
1
n
冥
r R1pq⫹o(1/n),
by Equation A2, with
(A16)
E0[p⬘
i]⫽ (1⫺e)[(1 ⫺m)pi⫹mp]⫹ep, (A9)
which, combined with Equations A10 and A14, finally giving
gives
1 n2
兺
n
i⫽1 Var0[p⬘
i]⫽ 1
n[1⫺(1⫺e)
2(1⫺m)2]rR
1pq⫹o(1/n).
V␦p⫽
1⫺ (1⫺e)2(1⫺ m)2
n(1⫺ e) r
R
1pq⫹o(1/n). (A17)