ISSN(Online): 2319-8753 ISSN (Print): 2347-6710
I
nternational
J
ournal of
I
nnovative
R
esearch in
S
cience,
E
ngineering and
T
echnology
(An ISO 3297: 2007 Certified Organization)
Website: www.ijirset.com
Vol. 6, Issue 6, June 2017
Comparative Study of Lateral Pile Behaviour
in Cohesionless Soil under Inclined
Compressive Loading with P-y curve Method
Serin Issac
Assistant Professor, Department of Civil Engineering,New Horizon College of Engineering, Bengaluru,
Karnataka, India
ABSTRACT:Pile foundations are extensively used to support various structures built on loose/ soft soils where shallow foundations would undergo excessive settlements or have low bearing capacity. Piles are slender, having high length to width ratio, and are mainly designed to resist axial loads. However, some structures such as high rise buildings, offshore structures, tall chimneys, earth retaining walls are subjected to horizontal or lateral pressure caused by wind force, wave force, traffic movement, earthquake etc. These loads cause lateral and vertical displacements and rotation of the pile cap. These overall behaviour of the piles can be estimated from the available conventional theoretical approaches. A widely popular method for analysing lateral displacement of the piles under working loads is the p-y method, where the soil is modeled as disjointed springs that offer lateral resistance to pile movement.This paper is an attempt to study the behaviour of single pile in cohesionless soil, subjected to varying inclined load until failure with the angle of applied load varying from 0º to 90º from the vertical axis of the pile, through an experimental model study on model mild steel and concrete piles driven into dry river sand. Lateral load carrying capacities of both piles of various slenderness ratios (10, 15, and 20) are found through the load – settlement diagrams and are compared. The effects of lateral components of inclined loads on horizontal and vertical displacement of the pile head are discussed. Also, the effects of pile material on the lateral load capacity of piles are studied. The results obtained are assessed by comparing with the theoretical p – y curve analysis method.
KEYWORDS:Bearing Capacity, Cohesionless soil, Inclined Loads, Lateral loads, Model tests, Pile foundation.
I. INTRODUCTION
Pile foundations are generally adopted, when the soil conditions are poor. The purpose of a pile foundation is to transmit the loads of the superstructure to the deep underlying firm soil while preventing excessive structural deformations. Pile foundations of offshore structures, transmission towers, wind energy converters, are often subjected to inclined loads and moment from usual structural dead load and horizontal loads generated by wind, waves, earth pressure etc. For proper functioning of such structures, two criteria must be satisfied: (1) A pile should be safe against ultimate failure, (2) Normal deflection at working loads should be within the permissible limit. For design of such piles, a quantitative estimate of allowable inclined compressive load is needed. If a vertical pile is subjected to an inclined and eccentric load, the ultimate bearing capacity in the direction of the applied load is intermediate between that of ultimate lateral load and ultimate vertical load. When load acts vertical, it is resisted by pile through skin friction and base resistance but when load acts with inclination, the deficiency in the base resistance and to some extent in the shaft friction leads to decrease in carrying capacity of single pile. Analysis of piles subjected to inclined loading action is complicated due to large number of variables involved. Further, experimental studies on behaviour of single pile subjected to inclined compressive loads are limited. The effect of angle of inclination of compressive load on horizontal deflection and vertical displacement of vertical piles of different length to diameter ratio are also rarely tested. The behaviour of a single pile under the action of lateral load components induced by various means of inclined compressive loads are studied in this paper.
ISSN(Online): 2319-8753 ISSN (Print): 2347-6710
I
nternational
J
ournal of
I
nnovative
R
esearch in
S
cience,
E
ngineering and
T
echnology
(An ISO 3297: 2007 Certified Organization)
Website: www.ijirset.com
Vol. 6, Issue 6, June 2017
or anchors separately and that too in homogeneous media. The comparative study by LianyangZang et al. (2005) has shown that these studies produced significantly different ultimate resistance values of single as well as pile group. Behaviour of vertical and batter piles subjected to inclined oblique loads have been reported by researchers like Madhusudan Reddy. K et al. (2011), Muthukkumaran et al. (2015) etc. Salini U. and Girish M. S (2009), Alice Johny and C. Prabha (2014), JerinWiba, V. JeyanthiVineetha (2014) studied the lateral load analysis results of single piles in cohesionless soils for range of soils. Their studies captured both the short pile and long pile behaviour observed for loose sands from dry state to submerged condition.
The present work involves an experimental analysis of lateral pile capacities of single piles of different materials under the action of inclined loads with varying angles of inclination, in cohesionless soil. Also, the results are validated with the conventional p-y curve analysis method. An attempt is made here to study the behavior of single model steel and concrete piles in cohesionless soil, subjected to varying inclined load until failure with the angle of applied load varying from 0º to 90º from the vertical axis of the pile, through an experimental model study.
Paper is organized as follows. Section II describes the Experimental Investigation in which the Foundation medium chosen, Materials used and the Experimental Setup of the study are explained. Section III explains the p-y curve method of finding the Lateral pile load capacity. The results of the study and the supporting discussion on the results obtained are given in Section IV. Finally, the Section V presents conclusion.
II. EXPERIMENTAL INVESTIGATION
2.1FOUNDATION MEDIUM
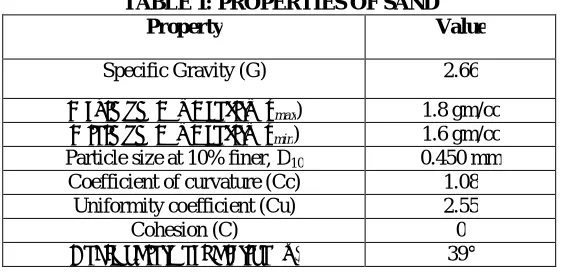
The foundation medium used for the study is dry sand obtained from the river Bharathapuzha in Palakkad district, Kerala, India. The physical properties of sand were determined using various laboratory experiments such as specific gravity test, density test, sieve analysis and direct shear test. The results obtained are shown in Table 1.
TABLE 1: PROPERTIES OF SAND
Property Value
Specific Gravity (G) 2.66
Maximum Dry Density (γmax) 1.8 gm/cc Minimum Dry Density (γmin) 1.6 gm/cc Particle size at 10% finer, D10 0.450 mm
Coefficient of curvature (Cc) 1.08 Uniformity coefficient (Cu) 2.55
Cohesion (C) 0
Angle of internal friction (φ) 39°
2.2 MODEL PILES
A steel pile and a concrete pile are used as the model piles, as shown in Fig 1. The range of prototype dimensions represented by the model piles for different scale factors is calculated using the following formula (Wood et al. 2002; Wood 2004)
(EI)P / (EI) m = n4.5
Where, n = scale factor, (EI) P = Flexural rigidity of prototype pile and (EI) m= Flexural rigidity of model pile.
ISSN(Online): 2319-8753 ISSN (Print): 2347-6710
I
nternational
J
ournal of
I
nnovative
R
esearch in
S
cience,
E
ngineering and
T
echnology
(An ISO 3297: 2007 Certified Organization)
Website: www.ijirset.com
Vol. 6, Issue 6, June 2017
Fig 1: Steel Piles and Concrete Piles
Rigid rough Mild Steel (MS) solid tubes and precast concrete tubes having diameter 20 mm with lengths of 200mm, 300mm and 400mm to achieve desired slenderness ratios of 10, 15 and 20 respectively were used as model piles. The Mild steel piles were slightly roughed to ensure better interaction with the sand particles. The concrete piles were casted in a PVC pipe, using cement and sand in the ratio of 1:1.5 and 0.5 water-cement ratio, providing a reinforcement of 6 mm diameter steel bar at the center. The casted piles were cured for 28 days and were taken out of the casing for testing. The model piles used in the present study are classified in terms of long and short piles respectively according to clause C-3 of IS 2911 (Part l/Sec 1): 2010. The stiffness factor T, for mild steel piles and concrete piles used in the study for densely deposited soil are found to be 133 for 200mm, 139 for 300mm and 128 for 400mm piles respectively. Therefore, the Piles chosen for the study are long piles.
2.3 EXPERIMENTAL SETUP
The dimensions of the model test tank are decided based on the effective stressed zone of soil mass from the edge of the foundation. For a laterally/ inclined loaded single pile, it is inferred from the literature that the boundary effect is more predominant within 10 times the pile diameter from the pile periphery (Matlock 1970; Rao et al. 1996, 1998). In the present study, the model pile diameter is 20 mm and hence the size of the tank in the plan should be larger than 200 mm for a single pile. Accordingly, the dimensions of the model steel tank are fixed as 1.0 × 1.0 × 0.75 m (depth) to avoid the boundary effects while testing the model pile under axial, lateral and inclined loads.
ISSN(Online): 2319-8753 ISSN (Print): 2347-6710
I
nternational
J
ournal of
I
nnovative
R
esearch in
S
cience,
E
ngineering and
T
echnology
(An ISO 3297: 2007 Certified Organization)
Website: www.ijirset.com
Vol. 6, Issue 6, June 2017
Fig.2: Schematic view of the experimental assembly
The Fig.3 shows the pictorial representation of this test setup. Loading was applied at the pile head by wheel axle arrangement for load inclination angle ranging from 0° to an angle of 60° with the vertical axis of the pile. Vertical and the horizontal displacements of the pile top were measured with dial gauges of sensitivity 0.001 mm. Loads were applied in small increments till the ultimate capacity of the pile was reached with little subsequent increment of the applied load.
Fig.3: Pictorial view of the experimental assembly
ISSN(Online): 2319-8753 ISSN (Print): 2347-6710
I
nternational
J
ournal of
I
nnovative
R
esearch in
S
cience,
E
ngineering and
T
echnology
(An ISO 3297: 2007 Certified Organization)
Website: www.ijirset.com
Vol. 6, Issue 6, June 2017
Ultimate capacity of pile for a central inclined load at the head of a fully embedded pile, the limits of vertical and horizontal components, Pv and Phrespectively, of ultimate capacity can be approximated by a semi-empirical relationship expressed as
+ = 1
where, Puand PHare the ultimate pile capacities under axial loading and horizontal loadingrespectively.
Reese et al (1974) proposed criteria for cohesionless soils for analysing the behaviour of piles subjected to lateral loadings under static conditions. The following procedures were developed for constructing p-y curves under static conditions.
1. Obtain the values of the angle of internal friction φ, the effective unit weight γ, and the pile diameter d.
2. Obtain the ultimate resistances of soil per unit length of pile using following equations. For soil close to ground surface:
= ∅
( ∅) + ( ∅)( + ) + ( ∅ −tan )−
(1)
For soil well below ground surface:
= ( −1) + ∅ (2)
Where, α = φ/2, β = 45° + φ/2, Ko = 0.4, KA = tan2 (45° - φ/2)
3. Find the depth at which there is an intersection of equations (1) and (2). Above this depth use equation (1) and below this depth, use equation (2).
4. Select a depth x at which p-y curve is required. 5. Establish yu = 3d / 80,compute Puby the equation,
Pu = AsPs
Use the appropriate value of As for the particular non-dimensional depth x/d. 6. Establish ym = d / 60,compute Pmby the equation,
Pm = BsPs
Use the appropriate value of Bs for the particular non-dimensional depth x/d.
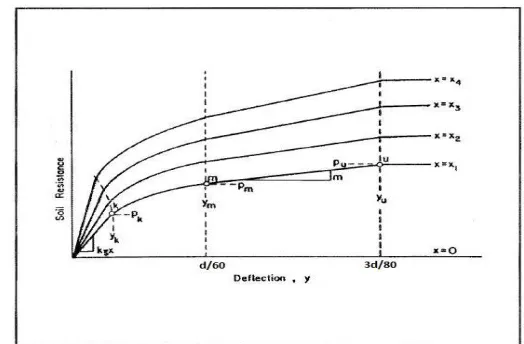
7. The two straight line portions of the curve beyond the point where y = d / 60 can now be established as shown in Fig.4.
Fig 4: Characteristic shape of p-y curves for static and cyclic loading in sand.
8. Establish the initial portion of the p-y curve by the equation,
ISSN(Online): 2319-8753 ISSN (Print): 2347-6710
I
nternational
J
ournal of
I
nnovative
R
esearch in
S
cience,
E
ngineering and
T
echnology
(An ISO 3297: 2007 Certified Organization)
Website: www.ijirset.com
Vol. 6, Issue 6, June 2017
9. Establish the parabolic section of the curve by the relation,
P = Cy1/n
(a). Fit the parabola between the points k and m as follows:
=
(b). Obtain the power of the parabolic section by,
=
(c). Obtain the coefficient C as,
= /
(d). Determine point k as,
=
= /
10. Compute appropriate number of points on the parabola using the equation on step 9. For design of these piles, a quantitative estimate of allowable inclined compressive load is needed.
IV.RESULTS AND DISCUSSIONS
Due to application of oblique load P on pile head, it is subjected to a vertical component, Pvand a horizontal
component, Ph. From geometry, these components can be expressed as:
= =
It can be seen that, as θ increases, Pvdecreases and Phincreases. Thus, with the increase of tilt of load with the
vertical direction the horizontal component dominates the vertical load component. Previous analytical and experimental approaches propose that depending on the relative magnitudes of the ultimate axial capacity and lateral ultimate resistance of a vertical pile, the axial component may attain critical value equal to ultimate load carrying capacity of pile axially. In this case, the horizontal component remains smaller than the ultimate horizontal load carrying capacity causing axial failure of the pile. However, if the horizontal component reaches the critical value equal to the ultimate horizontal capacity, while the axial component is less than the ultimate axial load capacity, plastic hinge formation takes place and bending failure will occur in long pile and in case of short pile translation failure in pile occurs.
In this study, the results of the lateral load components versus axial and lateral movement of the pile head are plotted. The failure load is taken to be that load at which the load vs. pile head displacement curve passes in to steep and fairly straight tangent. Comparisons of obtained experimental results with the available p –y curve analysis are carried out.
4.1 EXPERIMENTAL ULTIMATE LATERAL CAPACITY OF THE PILES
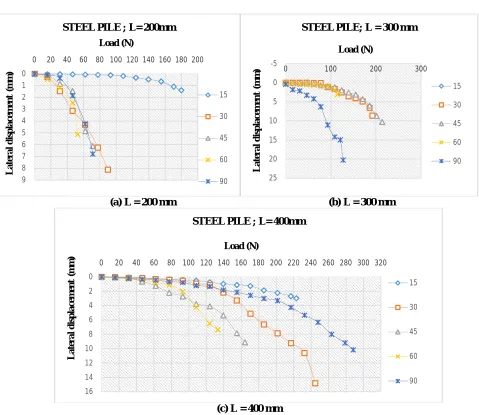
In order to obtain the lateral load bearing capacity of the Steel Pilesand Concrete Piles subjected to various load inclinations, plots of horizontal component of the loads versus the lateral settlement of the pile head are drawn for all pile slenderness ratio at load inclinations of 15°, 30°, 45° and 60° as shown in Fig.5 (a), (b) and (c) and Fig.6 (a), (b) and (c). All loads applied at inclinations have horizontal components, Ph, whose values are different from that under
ISSN(Online): 2319-8753 ISSN (Print): 2347-6710
I
nternational
J
ournal of
I
nnovative
R
esearch in
S
cience,
E
ngineering and
T
echnology
(An ISO 3297: 2007 Certified Organization)
Website: www.ijirset.com
Vol. 6, Issue 6, June 2017
(a) L = 200 mm (b) L = 300 mm
(c) L = 400 mm
Fig.5: Horizontal component the load vsLateral of displacement of steel pile.
TABLE 2: LATERAL CAPACITIES OF STEEL PILES AT VARYING INCLINATIONS IN (N)
From the above table, it can be seen that lateral load capacity increases with increase in length of the pile. This is because the passive resistance is mobilized on increased embedment of pile, i.e. when the embedment length of pile increases. It is inferred that the Ultimate lateral capacities of the steel piles having lengths 200mm, 300mm and 400mm are found to be 72 N, 120 N and 200 N respectively.
0 1 2 3 4 5 6 7 8 9
0 20 40 60 80 100 120 140 160 180 200
L a te ra l d is p la ce m en t (m m ) Load (N)
STEEL PILE ; L= 200mm
15 30 45 60 90 -5 0 5 10 15 20 25
0 100 200 300
L a te ra l d is p la ce m en t (m m ) Load (N)
STEEL PILE; L = 300 mm
15 30 45 60 90 0 2 4 6 8 10 12 14 16
0 20 40 60 80 100 120 140 160 180 200 220 240 260 280 300 320
L a te ra l d is p la ce m en t (m m ) Load (N)
STEEL PILE ; L= 400mm
15
30
45
60
90
Load inclinations 15° 30° 45° 60° 90°
Le n gth o f p il e in mm
200 39 45 40 41 72
300 62 93 109 100 120
ISSN(Online): 2319-8753 ISSN (Print): 2347-6710
I
nternational
J
ournal of
I
nnovative
R
esearch in
S
cience,
E
ngineering and
T
echnology
(An ISO 3297: 2007 Certified Organization)
Website: www.ijirset.com
Vol. 6, Issue 6, June 2017
(a) L = 200 mm (b) L = 300 mm
(c) L = 400mm
Fig.6: Horizontal component of the load vs Lateral displacement of concrete pile
TABLE 3: LATERAL CAPACITIES OF CONCRETE PILES AT VARYING INCLINATIONS IN (N)
From the above table, the lateral load capacity is found to increase with increase in length of the pile because the passive resistance is mobilized on increased embedment of pile, i.e. when the embedment length of pile increases. Also, it can be inferred that the Ultimate lateral capacities of the concrete piles having lengths 200mm, 300mm and 400mm are found to be 62 N, 110 N and 140 N respectively.
-5 0 5 10 15 20
0 20 40 60 80 100 120 140 160
L a te ra l d is p la ce m en t (m m
) Load (N)
CONCRETE PILE ; L= 200 mm
15 30 45 60 90 0 5 10 15 20 25
0 100 200 300
L a te ra l d is p la ce m en t (m m ) Load (N)
CONCRETE PILE ; L = 300mm
15 30 45 60 90 0 5 10 15 20 25
0 20 40 60 80 100 120 140 160 180 200 220 240 260 280 300 320 340 360 380 400 420
L at er al d is p lac em en t (m m ) Load (N)
CONCRETE PILE ; L = 400 mm
15
30
45
60
90
Load inclinations 15° 30° 45° 60° 90°
Le n gth o f p il e in mm
200 24 30 37 40 62
300 43 55 75 54 110
ISSN(Online): 2319-8753 ISSN (Print): 2347-6710
I
nternational
J
ournal of
I
nnovative
R
esearch in
S
cience,
E
ngineering and
T
echnology
(An ISO 3297: 2007 Certified Organization)
Website: www.ijirset.com
Vol. 6, Issue 6, June 2017
TABLE 4: COMPARISON OF LATERAL CAPACITIES OF PILES (N)
LENGTH OF PILE (mm)
STEEL PILES (N)
CONCRETE PILES (N)
200 72 62
300 120 110
400 200 140
From the above table, it is observed that the lateral load capacity of mild steel pile is more than that of concrete pile. Therefore, it is evident that with increase in the slenderness ratio, the lateral load capacity in case of Steel pile is found to increase more than that in concrete due to the increase in the weight and stiffness (EI) of the pile.
4.2. THEORETICAL ULTIMATE LATERAL LOAD CARRYING CAPACITY
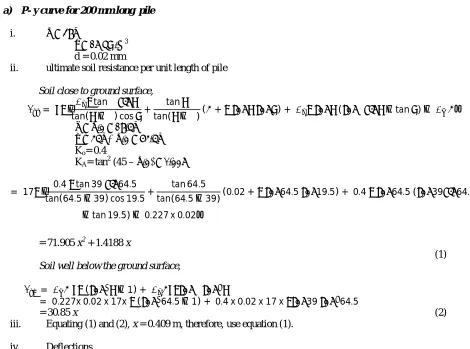
The experimental values of the ultimate lateral resistance of piles have beencompared with the theoretical values predicted by plotting p-y curve. Sample calculations for P- y curve analysis for 200mm long Steel Plie is depicted as below.
a) P- y curve for 200 mm long pile
i. φ = 39°
γ = 17 kN/m3 d = 0.02 mm
ii. ultimate soil resistance per unit length of pile
Soil close to ground surface,
= tan∅
tan( − ∅) cos +
tan
tan( − ∅)( + ) + ( ∅ −tan )−
α = φ/2 = 19.5° β = 45° + φ/2 = 64.5° Ko= 0.4
KA= tan2 (45 – φ/2) = 0.227
= 17 0.4 tan 39 64.5
tan(64.5−39) cos 19.5+
tan 64.5
tan(64.5−39)(0.02 + 64.5 19.5) + 0.4 64.5 ( 39 64.5
−tan 19.5)− 0.227 x 0.02
= 71.905 x2 + 1.4188 x
(1)
Soil well below the ground surface,
= ( −1) + ∅
= 0.227x 0.02 x 17x ( 64.5−1) + 0.4 x 0.02 x 17 x 39 64.5
= 30.85 x (2)
iii. Equating (1) and (2), x = 0.409 m, therefore, use equation (1).
iv. Deflections,
yu= 3d/ 80 = 3x0.02/ 80 = 7.5 x 10⁻⁴ m
ISSN(Online): 2319-8753 ISSN (Print): 2347-6710
I
nternational
J
ournal of
I
nnovative
R
esearch in
S
cience,
E
ngineering and
T
echnology
(An ISO 3297: 2007 Certified Organization)
Website: www.ijirset.com
Vol. 6, Issue 6, June 2017
Pu = AsPst
Pm = BsPst
= =
.
Get values of As and Bsfrom the graphs shown below, for various values of x/d.
(a) Values of As (b) Values of Bs Fig.7 :Non dimensional coefficients for the development of P-y curves.
Depth x
(m)
x/d As Bs Pst (kN/m)
Pu (kN/m)
Pm (kN/m)
m
0.02 1 2.1 1.6 0.057138 0.1199 0.0914 68.34 0.04 2 1.45 1.1 0.1718 0.24911 0.18898 144.20 0.06 3 1.05 0.75 0.3439 0.36109 0.25792 247.41 0.08 4 0.9 0.6 0.57369 0.516321 0.34421 412.73 0.1 5 0.88 0.5 0.86093 0.75761 0.4304 784.67 0.12 6 0.88 0.5 1.20568 1.06099 0.60284 1098
0.14 7 0.88 0.5 1.60797 1.4150 0.8039 1465
0.16 8 0.88 0.5 2.06777 1.8195 1.03388 1884
0.18 9 0.88 0.5 2.5851 2.2748 1.29255 2355
0.20 10 0.88 0.5 3.1560 2.7772 1.578 2875
From the values of Asand Bsobtained from the graphs shown in Fig 7, Pst, Pu, Pm, and then m are calculated for various depths, x as shown in above table.
vi. Compute n, C, yk, Pk using the formulae given, as shown in the table below for various depths.
= , = /
= , = /
For dense sand, nh = 50 x 103 kN/m3 (After Reese, 1986) Depth x
(m)
Pm (kN/m)
m 1/n n/n-1
C nhx (kN/m2)
yk (m)
ISSN(Online): 2319-8753 ISSN (Print): 2347-6710
I
nternational
J
ournal of
I
nnovative
R
esearch in
S
cience,
E
ngineering and
T
echnology
(An ISO 3297: 2007 Certified Organization)
Website: www.ijirset.com
Vol. 6, Issue 6, June 2017
0.16 1.03388 1884 1.647 0.60 2.54 126 8000 2.63 x 10⁻⁵ 0.225 0.18 1.29255 2355 1.647 0.60 2.54 157 9000 3.41 x 10⁻⁵ 0.327 0.20 1.578 2875 1.647 0.60 2.54 192 10000 4.36 x 10⁻⁵ 0.464 vii. Construct the p –y curve as shown below, so as to obtain the solution for the lateral loading in piles.
Fig. 8: P-y curve for 200mm long Pile in sand at various depths
Solution for steel pile:
i. As a first trial, assumenh = 50 x 103 kN/m3 ii. EI = 1.56 kNm2
iii. = / = . / = 0.125 m
iv. Compute deflection y at various depths as shown in table below using the equation,
=
is obtained from the table given by Reese and Matlock.
Pt for steel pile is taken as 0.072 kN
Depth
x(m)
Z= x/T Ay y (m) 0.02 0.16 2.176 1.96 x 10⁻⁴ 0.04 0.32 1.920 1.728 x 10⁻⁴ 0.06 0.48 1.674 1.50 x 10⁻⁴ 0.08 0.64 1.438 1.29 x 10⁻⁴ 0.1 0.8 1.216 1.09 x 10⁻⁴ 0.12 0.96 1.0116 0.91 x 10⁻⁴ 0.14 1.12 0.827 0.744 x 10⁻⁴ 0.16 1.28 0.66 0.594 x 10⁻⁴ 0.18 1.44 0.511 0.46 x 10⁻⁴ 0.20 1.6 0.381 0.343 x 10⁻⁴
0 0.5 1 1.5 2 2.5 3
-0.0001 0 0.0001 0.0002 0.0003 0.0004 0.0005 0.0006 0.0007 0.0008
P
,
k
N
/m
Deflection, y in m
P -Y CURVE FOR PILE OF L = 200mm
0.02
0.04
0.06
0.08
0.1
0.12
0.14
0.16
ISSN(Online): 2319-8753 ISSN (Print): 2347-6710
I
nternational
J
ournal of
I
nnovative
R
esearch in
S
cience,
E
ngineering and
T
echnology
(An ISO 3297: 2007 Certified Organization)
Website: www.ijirset.com
Vol. 6, Issue 6, June 2017
v. Obtain p from the p-y curve shown in Fig 8, for various values of y obtained above and compute Es by,
= as shown in the table below. Depth
x(m)
y
(m)
P
(kN/m)
Es (kg/cm2) 0.02 1.96 x 10⁻⁴ 0.12 6.1224 0.04 1.728 x 10⁻⁴ 0.18 10.4166 0.06 1.50 x 10⁻⁴ 0.22 14.66 0.08 1.29 x 10⁻⁴ 0.26 20.15 0.1 1.09 x 10⁻⁴ 0.1 9.17 0.12 0.91 x 10⁻⁴ 0.28 30.76 0.14 0.744 x 10⁻⁴ 0.3 40.32 0.16 0.594 x 10⁻⁴ 0.34 57.23 0.18 0.46 x 10⁻⁴ 0.4 86.95 0.20 0.343 x 10⁻⁴ 0.48 140
vi. Plot Es against depth, shown in Fig 9, to determine nhby drawing an average line. The value of nh is as nh = 42.57 x 10³ kN/m3.
vii. The value of T is obtained as
= / = . / = 0.129 m
Pt for steel pile is taken as 0.072 kN
Find yusing the formula in step iv and are tabulated as shown below
Depth x(m) Z= x/T Ay y
(m)
0.02 0.155 2.184 2.163 x 10⁻⁴
0.04 0.31 1.93 1.91 x 10⁻⁴
0.06 0.465 1.69 1.67 x 10⁻⁴
0.08 0.620 1.483 1.468 x 10⁻⁴
0.1 0.775 1.34 1.326x 10⁻⁴
0.12 0.93 1.033 1.022x 10⁻⁴
0.14 1.08 0.85 0.8415x 10⁻⁴
0.16 1.24 0.74 0.7326 x 10⁻⁴
0.18 1.39 0.56 0.554 x 10⁻⁴
0.20 1.55 0.42 0.41580-4
viii. Obtain p from the p-y curve shown in Fig 8, for various values of y obtained above and compute Es by,
= as shown in the table below. Depth x(m) y
(m)
P
(kN/m)
Es (kg/cm2)
0.02 2.163 x 10⁻⁴ 0.14 6.47
0.04 1.91 x 10⁻⁴ 0.19 9.94
0.06 1.67 x 10⁻⁴ 0.24 14.37
0.08 1.468 x 10⁻⁴ 0.29 19.75
0.1 1.326x 10⁻⁴ 0.12 11.75
ISSN(Online): 2319-8753 ISSN (Print): 2347-6710
I
nternational
J
ournal of
I
nnovative
R
esearch in
S
cience,
E
ngineering and
T
echnology
(An ISO 3297: 2007 Certified Organization)
Website: www.ijirset.com
Vol. 6, Issue 6, June 2017
0.14 0.8415x 10⁻⁴ 0.34 40.40
0.16 0.7326 x 10⁻⁴ 0.38 51.87
0.18 0.554 x 10⁻⁴ 0.42 75.81
0.20 0.4158 x 10⁻⁴ 0.5 120.25
ix. Plot Es against depth as shown in Fig 9, to determine nhby drawing an average line. The value of nh is obtained as nh = 38.26 x 10³ kN/m3.
x. The value of T is obtained as
= / = . / = 0.132 m
Pt for steel pile is taken as 0.072 kN
Find yusing the formula in step iv and are tabulated as shown below
Depth x(m) Z= x/T Ay y
(m)
0.02 0.150 2.1925 2.327 x 10⁻⁴
0.04 0.30 1.952 2.071x 10⁻⁴
0.06 0.45 1.72 1.824x 10⁻⁴
0.08 0.60 1.496 1.587 x 10⁻⁴
0.1 0.75 1.284 1.362x 10⁻⁴
0.12 0.90 1.086 1.152x 10⁻⁴
0.14 1.06 0.988 1.048x 10⁻⁴
0.16 1.21 0.75 0.795 x 10⁻⁴
0.18 1.36 0.588 0.623 x 10⁻⁴
0.20 1.51 0.4625 0.49x 10⁻⁴
xi. Obtain p from the p-y curve shown in Fig 8, for various values of y obtained above and compute Es by,
= as shown in the table below.
Depth x(m) y
(m)
P
(kN/m)
Es (kg/cm2)
0.02 2.327 x 10⁻⁴ 0.14 6.00
0.04 2.071x 10⁻⁴ 0.19 9.17
0.06 1.824x 10⁻⁴ 0.25 13.70
0.08 1.587 x 10⁻⁴ 0.30 18.90
0.1 1.362x 10⁻⁴ 0.18 13.21
0.12 1.152x 10⁻⁴ 0.32 27.77
0.14 1.048x 10⁻⁴ 0.36 34.35
0.16 0.795 x 10⁻⁴ 0.39 49
0.18 0.623 x 10⁻⁴ 0.43 69
0.20 0.49 x 10⁻⁴ 0.56 114.28
ISSN(Online): 2319-8753 ISSN (Print): 2347-6710
I
nternational
J
ournal of
I
nnovative
R
esearch in
S
cience,
E
ngineering and
T
echnology
(An ISO 3297: 2007 Certified Organization)
Website: www.ijirset.com
Vol. 6, Issue 6, June 2017
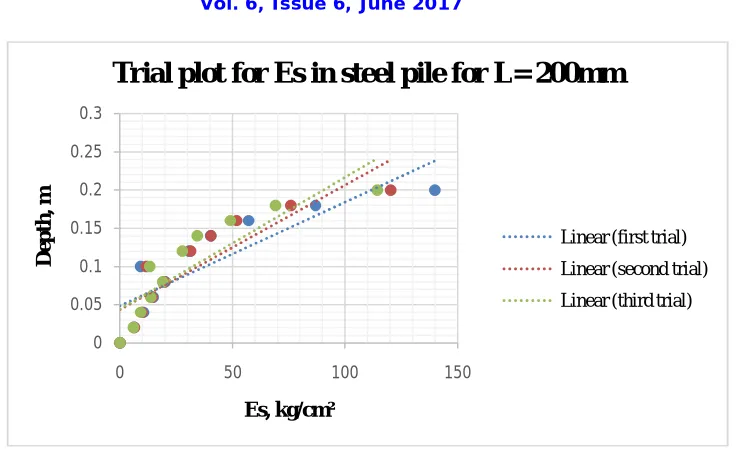
Fig.9: Trial plots for Es for 200 mm long steel pile
xiii. The value of ultimate lateral load for 200mm long steel pile, obtained from the equation P = Es y
corresponding to = 37 x 103 kN/m3 is, PU = 172 N.
Similarly, the ultimate lateral capacities of other Piles are obtained simultaneously by plotting P – y curves and they are compared with that of its experimental values, as tabulated in the Table 5.
TABLE 5: EXPERIMENTAL AND THEORETICAL VALUES OF LATERAL LOAD CAPACITY (N)
Pile type Length of Pile in
mm
L/d Theoretical ultimate Lateral capacity using P
– Y curve in (N)
Experimental values (N)
Steel Pile 200 10 172 72
300 15 196 120
400 20 211 200
Concrete Piles
200 10 110 62
300 15 160 110
400 20 190 140
From the above table, it can be seen that the experimental values of lateral load carrying capacities of steel and concrete piles are found be comparable to the predicted values for P –y curve method. Also it can be seen that for shorter piles, the theoretical values have overestimated the experimental values by more than 100%, whereas, for longer piles the percentage variations are found to be lesser, i.e, from 5% to 45 %.
V. CONCLUSION
The lateral capacities of the piles are found to increases with increase in the L/d ratio. This could be due to increase of the passive resistance with the increase in pile length. Also, on applying loads in various inclinations, increase in the inclined load carrying capacity of the vertical pile was found at lesser values of θ, mainly at 15°. The lateral load capacities of steel piles were found to be more than that of concrete piles.
0 0.05 0.1 0.15 0.2 0.25 0.3
0 50 100 150
D
e
p
th
,
m
Es, kg/cm²
Trial plot for Es in steel pile for L= 200mm
ISSN(Online): 2319-8753 ISSN (Print): 2347-6710
I
nternational
J
ournal of
I
nnovative
R
esearch in
S
cience,
E
ngineering and
T
echnology
(An ISO 3297: 2007 Certified Organization)
Website: www.ijirset.com
Vol. 6, Issue 6, June 2017
The curves of horizontal component of the load versus lateral settlement of the steel piles and concrete piles at 15°, 30°, 45° and 60° are different from pile’s vertical settlement under lateral loading condition (at = 90°) i.e. when no vertical components are present. Further it is observed that the presence of axial component of the applied load, when the inclination of loading with the vertical axis of pile approaches an angle around 60° to 90° caused an increase in lateral load carrying capacity of the pile and at 15° a decrease in the lateral load carrying capacity. The Ultimate lateral capacities of the steel piles having lengths 200mm, 300mm and 400mm are found to be 72 N, 120 N and 200 N respectively. The Ultimate lateral capacities of the concrete piles having lengths 200mm, 300mm and 400mm are found to be 62 N, 110 N and 140 N respectively. The lateral load capacity in case of Steel piles is found to be more than that in concrete piles due to the
increase in the weight and stiffness (EI) of the pile. The modulus of elasticity is also more for steel when compared to concrete.
Experimental values of lateral load carrying capacities of steel and concrete piles are comparable to the values from P –y curve method. For shorter piles, the theoretical values have overestimated the experimental values by more than 100%, whereas, for longer piles the percentage variations are found to be lesser, i.e, from 5% to 45%.
REFERENCES
[1] Alice Johny and C. Prabha, “Laterally Loaded Pile in Cohesionless Soil”, International Journal of Engineering Research & Technology (IJERT), Vol. 3 Issue 9, pp. 931-934, September- 2014.
[2] Braja. M. Das, Seeley, G. R. and Raghu, D., “Uplift capacity of model piles under oblique loads”, Journal of the Geotechnical Engineering Division, ASCE, Vol. 102, pp. 1009–1013, 1976.
[3] Gandhi, S. R., and Selvan, S., ‘‘Group Effect on Driven Piles under Lateral Load’’, Journal of Geotechnical and Geoenvironmental Engineering, Vol. 123, No. 8, pp. 702 – 709.
[4] JerinWiba, V. JeyanthiVineetha, “Behaviour of Laterally Loaded Piles in Cohesionless Soils”, International Journal of Research in Engineering and Technology, Vol. 3 Issue 11, pp. 179 -181, 2014.
[5] Ling Zhang, Minghua Zhao and XinjunZou (2015), “Behaviour of Laterally loaded Piles in Multilayered Soils”, ASCE journal
[6] K. Muthukkumaran and N. Almas Begum, “Experimental Investigation of Single Model Pile Subjected to Lateral Load in Sloping Ground”, Springer- Geotechnical and Geological Engineering, 2015.
[7] Madhusudan Reddy. K and R. Ayothiraman, “Experimental Studies on Behavior of Single Pile under Combined Uplift and Lateral Loading”, Journal of Soil Mechanics and Foundation Division, ASCE, Vol.20, 2011.
[8] Martin Achmus and Khalid Abdel –Rahman, “Behaviour of Piles in sand subjected to inclined loads”, Institute of Soil Mechanics, University of Hannover, Germany, 2002.
[9] Meyerhof, G. G., “Penetration Tests and Bearing Capacity of Piles”, Journal of Soil Mechanics and Foundation Division, 1956, ASCE, Vol.82. [10] Padmavathi V, E. Saibaba Reddy and M. R. Madhav , “Behaviour of laterally loaded rigid piles in cohesive soils based on kinematic
approach”, LOWLAND TECHNOLOGY INTERNATIONAL, Vol. 10, No. 1, pp. 27-41, 2008.
[11] Poulos, H. G. and Davis, E. H., Pile foundation analysis and design, 1st Edition, John Wiley and Sons, New York, USA, 1980.
[12] Ranjan, N. P., and Jagannath, P. P, “Ultimate Lateral Resistance of Pile Groups in Sand”, Journal of Geotechnical and Geoenvironmental Engineering, Vol.127, No.6, pp. 481 – 486, 2001
[13] Salini U. and Girish M. S, “Lateral Load Capacity of Model Piles on Cohesionless Soil”, EJGE, Vol. 14, pp. 1- 11, 2009.
[14] Sharma, B., “A model study of micropiles subjected to lateral loading and oblique pull”, Indian Geotechnical Journal, Vol. 41(4), pp. 196 -205, 2011.
[15] Soumya Roy, Dr. Bikash Chandra Chattapadhyay et.al, “Pile Behaviour under Inclined Compressive Loads—A Model Study”, EJGE, Vol 18, pp. 2187 – 2205, 2013.
[16] Sunil Bhardwaj and S. K. Singh, “Pullout capacity of model micropiles under oblique loads”, Indian Geotechnical Journal, 2013,Roorkee. [17] V. S. Phanikanth, Deepankar Choudhury and G. Rami Reddy, “Response of Single Pile under Lateral Loads in Cohesionless Soils”, EJGE,