Vol. 2, Issue 9, September 2013
6
0
0
Full text
Figure

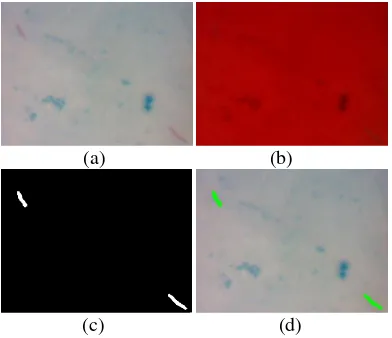
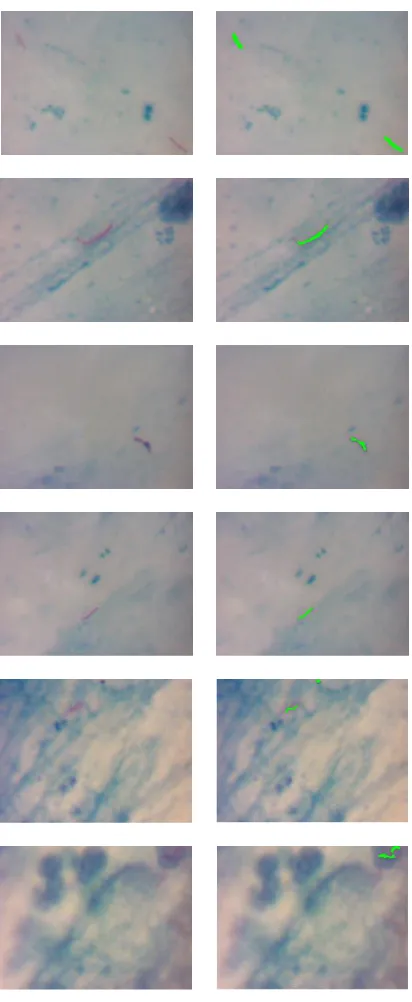
![Fig 2. Several samples of data training used in training process [3,6].](https://thumb-us.123doks.com/thumbv2/123dok_us/1703572.1216171/3.595.207.387.606.753/fig-samples-data-training-used-training-process.webp)
Related documents
