Metal Enhanced Electrochemical Cyclooxygenase-2 (COX-2)
Sensor for Biological Applications
Naumih M. Noah,Omole Marcells,Anas Almalleti,Jae Lim,Omowunmi A. Sadik*
Department of Chemistry & Center for Advanced Sensors & Environmental Monitoring State University of New York at Binghamton, P. O. Box 6000 Binghamton, NY 13902-6000, USA
Fax: (607) 777-4478
*e-mail: osadik@binghamton.edu
Received: May 3, 2011;& Accepted: June 30, 2011
Abstract
Pain measurement is commonly required in biomedical and other emergency situations, yet there has been no pain biosensor reported in literature. Conventional approaches for pain measurement relies on Wong-Baker face dia-grams, which are grossly inadequate for situations involving children or unconscious people. We report a label-free immunosensor for monitoring the pain biomarker cylooxygenase-2 (COX-2) in blood. The sensor is based on the concept of metal-enhanced detection (MED). MED relies on the idea that the immobilization of underpotential deposition (upd) metallic films deposited either as a monolayer or electrostatically held onto a solid gold substrate could significantly amplify bimolecular recognition such as involving antigen-antibody (Ab-Ag) interactions. The surface bound Ab-Ag complex insulates the electrode; causing a decrease in concentration-dependent redox signals. A linear detection range of (3.64–3640.00) 104ng/mL was recorded with a detection limit of 0.25 104ng/mL, which was 4 orders of magnitude lower than that reported for ELISA for the same biomarker. The immunosensor exhibited selectivity of less than 6 % for potential interferents.
Keywords: COX-2, Cyclic voltammetry, Immunosensor, Pain biomarkers, Real samples, Self-assembled-monolayer
DOI: 10.1002/elan.201100241
1 Introduction
Pain is a complex response involving the interaction of multiple inflammatory mediators released at sites of tissue injury. Assessment of pain is necessary in clinical setting for diagnosis, pain management, choice of treat-ment and for the evaluation of treattreat-ment efficacy. Cur-rent methods used to assess pain include visual analog, Wong-Baker faces and verbal numeric scales [1]. Howev-er, studies have found that these scales may be subjective with discrepancies recorded in pain intensity measure-ments [2]. Hence there is a need for developing an objec-tive scale that relies on the fundamentals of chemical and biological mechanisms of pain transduction.
Arachidonic acid (AA) is one of the major pain bio-markers. Its products of arachidonic acid (AA) which in-clude enzymatically generated molecules such as throm-boxanes and prostaglandins, among others, are the major substances that play a pivotal role in both inflammation and pain [3, 4]. The most important step in the production of prostaglandins and thromboxanes is the metabolism of AA to prostaglandin H2 (PGH2) by the enzyme
prosta-glandin H2synthase, also referred to as cyclooxygenase-2
(COX-2) [5]. COX-2 is normally undetectable in healthy tissues but, rapidly induced in response to inflammatory stimuli such as bacterial endotoxin [6, 7]. In the presence of two oxygen molecules, it catalyzes the conversion of
AA to form prostaglandin G2 (PGG2) and a peroxidase
(POX) reaction in which PGG2 subsequently undergoes a
two-electron reduction to (PGH2) [8].
Currently, the Wong-Baker faces pain rating scale is used as the standard method for pain measurement but it allows for a subjective and a rather qualitative indicator of pain [10]. Studies have shown that the amount of AA and the levels of COX-2, PGG2 or PGH2 at the point of
inflammation may ultimately translate to the degree of inflammation [9], thus providing a means of directly as-sessing the level of pain. The long-term goal of this work is to utilize biochemical transduction mechanisms as a means of developing a pain biosensor. The immediate goal is to develop a label-free approach to pain measure-ment using COX-2 antibody-modified electrode as a sensor for the antigenic COX-2. We recently reported the electrochemical characterization of different pain bio-markers [11] but the development of electrochemical sen-sors for assessing the level of pain or pain biomarkers has not been realized. We hereby report a label-free, MED-based sensor for monitoring COX-2, a major pain bio-marker.
1.1 Immunosensor Concept
techniques such as cyclic voltammetry, differential pulsed voltammetry and UPD of silver. Underpotential deposi-tion is an electrochemical process whereby a single metal adlayer is electroplated on a dissimilar metal [12]. The UPD phenomenon is observed when there are strong adatom-substrate interactions that are energetically more favorable than that formed during bulk electrodeposition. In MED, a solid-phase monolayer of silver is deposited onto a gold electrode using UPD [12–14]. MED signal is based on the redox peaks from the UPD silver, which sig-nificantly enhances the sensitivity of the biomolecular recognition [12, 13]. By oxidizing the silver monolayer, and in the presence of immobilized Ab molecules, highly reactive oxides of silver are generated in situ causing a change in the electronic properties of the immobilized monolayer. By scanning in the reverse direction, current arising from the of the reduction of the oxide layers is measured. If an antigen is introduced into the medium, the molecular recognition occurring between the antibody and the antigen is evidenced by a corresponding change in the redox currents of the silver monolayer, which de-pendents on the concentrations of the antigen. The con-centration-dependent signals are attributed to the interfa-cial charge transfer barrier and related “site-blocking ef-fects” of the non-electroactive COX-2 antigen.
We have established that MED reactive surfaces could be fabricated using metalized silver-on-gold (mSOG); either as continuous films, nanoparticles, colloids or mon-olayers. The mSOG surface is predicted to significantly amplify the electrochemical signals following molecular recognition without an intentionally added electroactive species in solution [13, 14]. As a result, MED phenomena allowed for label-free detection of bioaffinity recognition, precise and reproducible control of surface coverage while simultaneously increasing the sensitivity of electro-chemical detection.
We have developed MED-based biosensors for other bioaffinity reagents such as DNA-DNA, DNA-small mol-ecule detection and genetic mismatch of DNA [14, 15]. In this work, we extend the MED concept for the detection of pain biomarkers as the first step towards realizing an objective measure of pain for AA, COX-2 or PGG2. We
report the development of an immunosensor for COX-2 with subsequent validation in model real samples. Quanti-tative ELISA was first carried out to establish the molec-ular recognition between goat anti-COX-2 and COX-2 enzyme (antigen). The capture antibody is immobilized on the electrode via thiol groups of a thiolated Protein G which helps with the antibody orientation. To the best of our knowledge, this is the first electrochemical sensor to be reported for monitoring important pain biomarkers such COX-2 proteins.
2 Experimental
2.1 Reagents
Prostaglandin H synthase (Human recombinant COX-2, antigen), COX-1, goat anti-human COX-2 and rabbit anti-COX-2 polyclonal antibodies were purchased from Cayman Chemicals (Santa Cruz Ann Arbor, MI) and stored at 208C. Bovine serum albumin (BSA) and flat-bottom polystyrene 96-well microplates were purchased from Thermo Fisher Scientific (Pittsburgh, PA, USA). The following chemicals were purchased from Sigma Al-drich (St. Louis, MO, USA)-Sodium hydrogen phosphate, sodium phosphate, sodium carbonate, sodium hydrogen carbonate, rabbit anti-goat IgG alkaline phosphatase enzyme conjugate, tris HCl, tris base, human serum albu-min, ovalbualbu-min, diethanolamine and phosphoric acid. P-nitrophenyl phosphate disodium (PNPP) salt was pur-chased from Pierce Chemicals (Rockford, IL USA). Sodium chloride, sulfuric acid, sodium hydroxide and eth-ylenediaminetetraacetic acid (EDTA) were purchased from J.T Baker Chemicals (Philipsburg, N.J). Recombi-nant Protein G and succinimidyl-6-[3’ -(2-pyridyldithio)-propionamido] hexanoate (LC-SPDP) were purchased from Thermo Scientific. Dithiothreitol (DTT) was pur-chased from Fermentas Life Science (Glen Burnie, Mary-land, USA). Dimethyl sulfoxide (DMSO) was purchased from EMD Chemical (Gibbstown, NJ, USA). Simulated blood was obtained from forensics source (Jacksonville, FL, US).
2.2 Enzyme Linked Immunosorbent Assay (ELISA) Protocol
The ELISA protocol used was based on the method de-scribed in literature [15] with minor modifications: Flat-bottom polystyrene 96-well microplates were coated over-night at 48C with 100mL/well of 1 mg/mL of polyclonal goat anti-COX-2 (prepared in 0.05 M bicarbonate buffer pH 9.6) as capture antibody. The plates were washed three times with phosphate buffer saline (PBS) buffer containing 0.05 % Tween 20 (PBS-T, pH 7.6) and the same washing procedure followed in each subsequent stage of the assay. The plates were then blocked with 200mL of 1 mg/mL Bovine serum albumin (BSA) pre-pared in PBS (pH 7.6) and incubated overnight at 4o
phosphatase in Tris buffer (pH 8.0) excluding blanks. This step was followed by additional incubation for 1 h at room temperature. After the final rinsing with Tris buffer (pH 8.0), a 100mL of 1 mg/mL PNPP solution prepared in 10 % diethanolamine buffer (DEA) was added except blank and the plates incubated for 30 minutes at room temperature. Optical densities (OD) of the solutions were measured at 405 nm using Synergy HTRDR multi-detec-tion microplate reader.
2.3 Thiolation of Protein G using LC-SPDP
Thiolation of Protein G was carried out as described in literature [16]. Briefly, a five-fold excess of LC-SPDP dis-solved in PBS-EDTA containing 10 % DMSO was react-ed with Protein G that was dissolvreact-ed in PBS-EDTA. Excess LC-SPDP and unwanted by-products were imme-diately removed by centrifugal filtration and the buffer was exchanged with sodium acetate. DTT was added to a final concentration of 50 mM and reacted for 30 min at room temperature. The reaction mixture was then loaded onto a dialysis bag that placed in a beaker containing PBS-EDTA buffer. The buffer was changed after every two hours twice and then left to dialyze overnight. Over-night dialysis was carried out in order to remove the un-bound Protein G and the LC-SCPD. The dialyzed sample was removed from the dialysis bag and stored at 48C until required. Scheme 1 illustrates thiolation of the pro-tein G and subsequent formation of assembled layer on the silver modified gold electrode.
2.4 Instrumentation
All electrochemical measurements were performed in a conventional three electrode set up using an EG & G PAR 263A potentiostat equipped with an EG & G M270 software for data acquisition. A T-cut gold-quartz crystals (9 MHz, Area=0.2 cm2
) purchased from International Crystal Manufacturers (OK, USA) were used as the working electrodes. Saturated silver electrode (Ag/AgCl-saturated) and platinum wire were used as reference and counter electrode respectively. A well-type electrochemi-cal cell, made from Teflon with a capacity of 300mL was used. All solutions were purged with nitrogen for 5 min before any electrochemical measurements were taken.
2.5 UPD of Silver and further Modification of Gold Electrode (UPD-Ag)
The gold quartz crystal were cleaned in freshly prepared piranha solution (30 % H2O2:H2SO4, 1 : 3 V/V), rinsed
with water and ethanol and finally blow dried with nitro-gen gas. The deposition procedure was as previously de-scribed [13, 14, 17]. Briefly, silver was deposited on a gold quartz crystals using 1 mM silver nitrate solution at the following potentiostat settings: initial potential 503 mV, potential step 1 of 303 mV (49.90 s), and potential step 2 of 503 mV (10.11 s).
Surface pretreatment of the UPD-Ag was achieved using the LC-SPDP crosslinker. Succinimidyl 6-(3-[2-pyri-dyldithio]-propionamido)hexanoate, is a cleavable, water insoluble, amino and thiol (sulfhydryl) reactive
functional protein crosslinker. The “long chain” LC-SPDP crosslinking reagent has a 15.7 angstrom spacer arm and it facilitates the attachment of thiolated Protein G on the gold surface [18]. This surface linkage allows a maximum interaction between the antibody and the anti-gen. The antibody provides the best orientation with re-duced steric hinderance [18]. Similar surface conjugation using LC-SPDP with Protein G had been reported for oriented immobilization of the antibody [16, 19, 20]. In order to achieve the oriented surface conjugation de-scribed, a 200mL of the thiolated Protein G was applied on the surface of the electrode in the Teflon well and left to incubate for one hour. The electrode was rinsed thor-oughly with PBS (pH 7.6) buffer before applying a solu-tion of 200mL of 1mg/mL COX-2 goat antibody; which was followed by additional incubation for two hours. The COX-2 immobilized electrode was subsequently rinsed three times with PBS buffer before applying 1 mg/mL BSA prepared in PBS (pH 7.6) to block any non-specific sites for one hour. Finally, the COX-2 immobilized elec-trode was utilized as a sensor via incubation at varying concentrations (3.64 104
ng/ mL – 3640000 104
ng/ mL) with COX-2 enzyme (prepared in PBS-BSA) for 10 min and then characterized using cyclic voltammetry.
2.6 Cross-Reactivity Studies and Detection of COX-2 in Model Real Samples
The effect of potential interferants such as human serum albumin (0.1mg/ mL), ovalbumin (0.1mg/mL), and COX-1 (3.64 COX-102
ng/ mL) on the MED immunosensor was
tested. The change in the redox currents in the presence of the interferents was compared with that obtained for COX-2. Also, to investigate the efficiency of the MED immunosensor, simulated blood that was designed to mimic the consistency of real human blood was employed as real sample. Known concentrations of COX-2 were spiked in the simulated blood and then detected at the immunosensor. The amount of COX-2 recovered was compared to the amount spiked in the sample in order to ascertain the efficiency of the immunosensor.
3 Results and Discussion
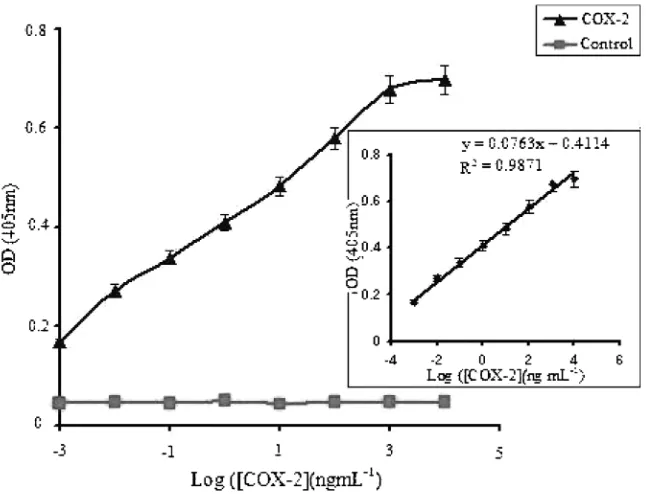
This work seeks to develop a label-free MED immuno-sensor for COX-2, a major pain biomarker. As discussed earlier, the resulting immunosensor was validated for COX-2 using simulated blood real samples. Prior to the development of the MED immunosensor, a quantitative ELISA was carried out to establish the molecular recog-nition between goat anti-COX-2 and COX-2 enzyme. The COX-2 enzyme (antigen) standards used to generate a working calibration plot for the ELISA ranged from 0.0126 to 1260 ng/ mL. The ELISA results as shown in Fig 1 revealed an increase in the recorded absorbance as the concentration of the COX-2 was increased. This sug-gests a biomolecular recognition of the COX-2 enzyme by its antibodies, thus providing a direct measure of COX-2 protein. The linear range, as shown in the inset of Figure 1, was found to be between 1–126 ng mL1
and a
Fig. 1. ELISA results. The results shows the measurable range of the COX-2 enzyme and inset shows a linear standard calibration curve obtained in the sandwich ELISA. Inset shows a linear detection range of between 1–126 ng mL1
and a detection limit of 0.24 ng mL1
detection limit of 0.24 ng mL1
was estimated based on 3 times the standard deviation of the blank.
3.1 Immunosensor Design
Thin film of silver monolayer was deposited on the sur-face of the gold electrode using as described in the exper-imental section. A self-assembled monolayer of thiolated Protein G was then assembled on the silver modified electrode either through attachment to the silver or un-covered gold surface. Silver deposited on the surface of the electrode has been found to increase the stability of the alkanethiol SAM. Jennings et al. demonstrated that alkanethiol-based SAMs on gold surfaces modified by UPD to contain a thin layer of silver exhibited greater stabilities toward desorption than did SAMs on native gold surfaces [12]. A layer of goat anti-COX-2 polyclonal antibody was then assembled onto the silver modified gold electrode via its antibody binding sites of the thiolat-ed protein G which then formthiolat-ed the immunosensor sur-face.
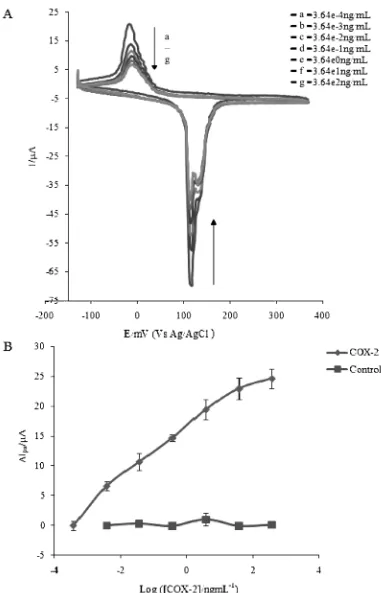
Cyclic voltammetry was used to characterize the elec-trode surface. Oxidizing the silver monolayer in the pres-ence of the goat anti-COX-2 antibody resulted in reactive silver oxides accompanied by electrons producing a redox signal. It showed anodic and cathodic peaks at around 135 mV and 2 mV respectively. The peak currents re-corded indicated no significant change even after several cycles were run, indicating the stability and reproducibili-ty of the goat anti-COX-2 immunosensor. Incubation of the goat anti-COX-2 antibody modified electrode with different concentrations of COX-2 enzyme prepared in PBS buffer (pH 7.6) resulted in biospecific molecular rec-ognition, forming an antibody-antigen complex evidenced by the change in the redox current. The complex forma-tion on the surface of the electrode resulted in insulaforma-tion of the surface toward the redox couple as predicted by MED concept. This insulation reflected the differences in the effective diffusion of ions to the electrode surface due to the Ab-Ag interaction.
The extent of insulation was found to be proportional to the concentration of COX-2 enzyme used indicated by the reduction in the intensity of both the anodic and cathodic peak currents as the concentration was increased (Figure 2A). To ascertain that the reduction in peak cur-rent was due to the antibody-antigen interaction, a con-trol containing buffer solution without incubation of the COX-2 enzyme was performed. The peak current did not show any significant change indicating that the observed current decrease was due to the interaction between COX-2 enzyme and its antibody. A plot of the change in the anodic peak current versus the COX-2 enzyme con-centration showed a linear range of between 3.64 104
to 36400 104
ng/mL with a detection limit of 2.54 105
ng/ mL based on 3 times the standard deviation of blank (Figure 2B). Interassay precision of the immunosensor was calculated based on results of three independent
ex-periments using equation 1 and a percent coefficient of variation (%CV) of between 8.45–13.12 % was obtained.
%CV¼standard deviation of the mean of triplicates
mean of triplicates 100
ð1Þ
3.2 Cross-Reactivity and Detection of COX-2 in Real Samples
The effect of potential interferents (human serum albu-min, ovalbumin and COX-1) tested was found to be insig-nificant since no major change in the redox currents was observed using the interferents as analytes. The cross se-lectivity, calculated using COX-2 response as 100 % and equation 2 was found to be of less than 6 %
%Cross selectivity¼interferent response
COX-2 response 100 ð2Þ
To investigate the efficiency of the MED immunosen-sor, COX-2 enzyme was detected in simulated blood using the MED immunosensor. Simulated blood obtained from forensics source (Jacksonville, FL, US) was diluted in PBS buffer and different known concentrations of COX-2 spiked in the samples.. Calibration curve was first constructed using standard COX-2 concentrations be-tween 3.64 104
to 36400 104
ng/mL. The immunosen-sor response of each spiked sample was compared with the response of the standard COX-2 concentration and used to calculate the % recovery. To further validate the system, a control experiment whereby the simulated blood without spiking the COX-2 was performed. Both the anodic and cathodic peak currents decreased as the COX-2 concentra-tion spiked in the samples increased. A plot of the anodic current change versus the COX-2 concentrations spiked in the sample showed a linear range of between 3.64 104
to 36 400 104
ng/ mL (Figure 3). However, there was no sig-nificant change in both the cathodic and anodic peak cur-rents for the control experiment. This showed that the si-mulated blood did not have any interferents which can in-terfere with the performance of the immunosensor when analyzing real sample. As predicted by the MED, this sug-gests that the decrease in the peak currents was due to the interaction between the spiked antigenic COX-2 and the surface-immobilized antibody.
The % recovery of the COX-2 determined from the spiked samples was calculated as shown in Equation 3 and was found to be between 66–102 % with an average value of 81.31 %. These values show that the MED immu-nosensor is selective to interferents in the simulated blood and it can be used to detect COX-2 in real-life blood samples from patients suffering from acute and chronic inflammation pain.
%Recovery¼ DIpaðspiked sampleÞ
DIpaðstandard sampleÞ
Fig. 2. Representative Cyclic voltammograms and Calibration curve. (A) Voltammograms obtained after incubating the goat anti-COX-2 modified electrode with different concentrations of anti-COX-2. (B) MED calibration curve using a plot of the anodic peak current change (DIpa=Ipa–Ipa(ref) whereIpa (ref)=63mA) versus COX-2 concentration. LOD=2.54 105ng mL1, LDR=3.64 104 to 36400 104
4 Conclusions
Label free metal enhanced electrochemical detection bio-sensor is reported for monitoring COX-2, a major pain biomarker. In this method, monodispersed silver ions served as the redox probe. The cathodic and anodic peak current response with or without COX-2 indicated a con-centration-dependent response which was due to the COX-2 enzyme. The concentration-dependent response revealed a linear detection range of between 3.64 104
to 3.64 101
ng mL1
with a detection limit of 2.54 105
ng mL1
which was about 4 orders of magnitude lower than that recorded for ELISA technique. The im-munosensor exhibited a remarkable selectivity of less than 6 % and good recovery of 81.31 % of COX-2 spiked in simulated blood used as real sample. This was an indi-cation that there were no interferents in the simulated blood which may interfere with the detection of COX-2 in real samples. This immunosensor may thus serve as a basis for the quantification of COX-2 and other pain bio-markers such as AA and PGG2. Future work will involve
testing this immunosensor in real-life biological applica-tions such as using blood samples from patients with pain.
Acknowledgements
We acknowledge the following agencies for funding: En-vironmental Protection Agency through the STAR
Pro-gram, and the US Army Research Office for DURIP equipment grant.
References
[1] H. J. Berdine, Disease Management & Health Outcomes
2002,10, 155.
[2] I. Lund, T. Lundeberg, J. Kowalski, E. Svensson, Neurosci. Lett.2005,375, 75.
[3] R. D. W. Hain,Palliative Med.1997,11, 341.
[4] C. N. Serhan, K. Gotlinger, S. Hong, M. Arita,Prostagland. Lipid Mediat.2004,73, 155.
[5] D. L. Dewitt,Biochim. Biophys. Acta1991,1083, 121. [6] B. S. Fletcher, R. W. Lim, B. C. Varnum, D. A. Kujubu,
R. A. Koski, H. R. Herschman, J. Biol. Chem. 1991, 266, 14511.
[7] P. Needleman, P. C. Isakson,J. Rheumatol.1997,24, 6. [8] A. V. Sampey, S. Monrad, L. J. Crofford,Arthritis Res. Ther.
2005,7, 114.
[9] J. R. Vane, Y. S. Bakhle, R. M. Botting, Ann. Rev. Pharma-col. ToxiPharma-col.1998,38, 97.
[10] D. L. Wong, C. M. Baker,Pediatr. Nurs. J.1988,14, 9. [11] M. A. Omole, N. Noah, L. Zhou, A. Almaletti, O. A. Sadik,
H. N. Asemota, E. S. William, J. Gilchrist, Anal. Biochem.
2009,395, 54.
[12] G. K. Jennings, P. E. Laibinis,J. Am. Chem. Soc.1997,119, 5208.
[13] I. O. K’Owino, R. Agarwal, O. A. Sadik,Langmuir2003,19, 4344.
[14] I. O. K’Owino, S. K. Mwilu, O. A. Sadik, Anal. Biochem.
2007,369, 8.
[15] J. T. Paweska, F. J. Burt, R. Swanepoel,J. Virol. Meth.2005, 124, 173.
[16] J. M. Fowler, M. C. Stuart, D. K. Y. Wong,Biosens. Bioelec-tron.2007,23, 633.
[17] A. O. Aluoch, O. A. Sadik, G. Bedi, Anal. Biochem. 2005, 340, 136.
[18] M. M. Billah, C. S. Hodges, H. C. W. Hays, P. A. Millner, Bi-oelectrochemistry2010,80, 49.
[19] J. M. Fowler, M. C. Stuart, D. K. Y. Wong, Anal. Chem.
2007,79, 350.