IJISET - International Journal of Innovative Science, Engineering & Technology, Vol. 2 Issue 6, June 2015. www.ijiset.com
ISSN 2348 – 7968
Energy Audit – A Case Study
Shakila Rani JP
1
P
, Maheshan C MP
2
P
, Sujatha B CP
3
P
, Thivakaran AP
4
P
, RajeshP
5
P
P
1
P
PG STUDENT, Power and Energy Systems, Department of Electrical Engineering, UVCE, Bengaluru-560001.
P
2
P
Assistant Professor, Department of Electrical Engineering, UVCE, Bengaluru-560001. Karnataka State. India.
P
3
P
Associate Professor, Department of Electrical Engineering, UVCE, Bengaluru-560001. Karnataka State. India.
P
4,5
P
DGM(Electrical) and Engineer (Electrical) of Earth Movers Division, BEML, Kolar Gold Fields(KGF), Karnataka state, India.
Abstract: Energy is the gift of nature to mankind in
various forms and has always been a vital resource in the development of any nation. Energy conservation is the key element in the Energy management. In any Industry, the three top operating expenses are often found to be energy (both electrical and thermal), labour and raw material. The energy audit is an inspection, survey and analysis of Energy flows in a building, process or system with the objective of understanding the energy dynamics of the system under study. In this paper Energy Audit is performed at Earth Movers Division (EMD) of BEML located in Kolar Gold Fields (KGF), Karnataka state, India. The contract demand from the electricity supply company to the Earth Movers division of BEML is 8000KVA per month. The annual savings are calculated through Energy audit.
Key words: Energy audit, Energy conservation, annual
savings.
1. Introduction
The Industrial sector is the major energy consuming sector in India and uses about 50% of the total commercial energy available in the country. In general, the Indian industry is highly energy-intensive and energy efficiency is well below that of other industrialized countries. Energy Audit initially became popular in response to the energy crisis of 1973 and Later Years. Interest on energy audits recently increased as a result of growing understanding of human impact upon global warming and climate change. The energy audit would give a positive orientation to the energy cost reduction, preventive maintenance and quality control programmes which are vital role for production and utility activities. In general
This Automobile industry has been considered for energy audit because the higher magnitude of electrical energy used in such industries. The energy bill of automobile manufacturing industries in the country is estimated to be Rs.2327 Crores in a year.
5% efficiency in energy consumption by them would save Rs.116 crore every year in energy cost. Also for any industry 5% saving in energy equals to 10% rise in net profit. Demand for energy is expected to double by 2050.
2. Study of existing conditions
Industry considered
BEML is a large scale public sector manufacturing Mining and Construction, Defence and Rail and Metro. The company with a modest with a turnover of Rs.5 crores during 1965 and the company have been able to achieve a turnover of more than Rs.3500 Crores.
Electrical demand
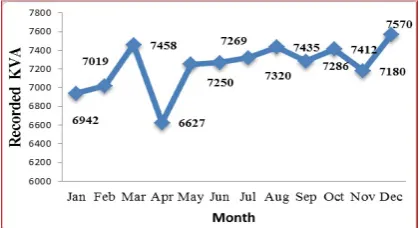
The industry considered is a high tension consumer from the state electricity board. Contract demand is 8000 KVA.
Fig. 1 depicts the monthly variations in KVA consumption for the period January 2013 to December 2013.
Fig.1:Monthly variations in KVA consumption for the period (Jan-Dec) 2013.
Energy Consumption
Energy consumption: 25 lakh units per month. Electricity bill: Rs.1.5 crores per month.
Fig. 2 gives monthly variation in KWH
(Electricity Energy) consumption for the period January 2013 to December 2013.
Fig.2:Monthly variations in KWH consumption for the period of (Jan-Dec) 2013.
Electricity Tariff
Maximum demand (KVA) Charges: Rs.180 / KVA Energy (kWh) charges: Rs.5.3 / kWh.
Following are the details of applicable electricity tariff:
Supply Utility (SEB): Karnataka State Electricity, Bangalore Electricity Supply Company (BESCOM). Tariff: HT2 (A) 1
Contract Demand: 8000 KVA
Energy Charges: Rs.5.35/kWh (up to 100000 units) and Rs.5.75/ KWh (100000 units and Above) Demand Charges: Rs.180/KVA
Average Power Factor: 0.91
Manufacturing facilities
The following are the manufacturing facilities
available at earth movers division of BEML
Machining facilities Gear manufacturing facility
Plate working and fabrication facilities Heavy equipment shop
Heat treatment
2.6 Need for energy conservation
Energy conservation is necessary to reduce the increasing global warming.
Individuals and organizations should conserve energy in order to decrease the energy costs and increase the economic security.
Industrial and commercial users can increase efficiency and thus maximize profit.
3. Energy audit
Energy audit
Energy audit is a systematic study or survey to identify how energy is being used in a building or plant, and identifies energy savings opportunities. Using proper audit methods and equipment, an energy audit provides the energy manager with essential information on how much, where and how energy is used within an organization (factory or building).
Energy audit stages
Energy audit can be categorized into two types, namely walk-through or preliminary and detailed audit.
Walk-through or preliminary audit
Walk-through or preliminary audit comprises one day or half-day visit to a plant and the output is a simple report based on observation and historical data provided during the visit. The findings will be a general comment based on rule-of-thumbs, energy best practices or the manufacturer's data.
Detailed audit
Detailed audit is carried out for the energy savings proposal recommended in walk-through or preliminary audit. It will provide technical solution options and economic analysis for the factory management to decide project implementation or priority. A feasibility study will be required to determine the viability of each option.
The audit involves carrying out various measurements and analysis covering all major energy consuming sections to realistically assess losses and potential for energy savings.
It has three phases:
Phase I --- Pre Audit phase
IJISET - International Journal of Innovative Science, Engineering & Technology, Vol. 2 Issue 6, June 2015. www.ijiset.com
ISSN 2348 – 7968
Phase II --- Audit phase Phase III --- Post Audit phase
4. Objectives and scope of work
The broad objectives of the proposed work of energy audit study are as follows:
i. To evaluate energy performance of various equipment/ process with a view to identify thrust areas for energy conservation.
ii. To recommend remedial course of action for improvement of efficiency in process/equipment to reduce the energy consumption with cost considerations.
iii. To quantify the extent of energy savings that can be achieved after analyzing the likely reasons for excess energy consumption based on the field measurements and data collection.
iv. To provide the post audit Engineering/ consultancy/ advisory support for implementation of the energy conservation opportunities identified in the cluster.
5. Audit out come
Areas identified for energy saving
Improvement in performance / Energy efficiency through energy audit covers the following areas:
i. Lighting system
ii. Power factor improvement iii. Transformers
iv. Air conditioning v. Fan Regulators vi. Operation of DG Sets vii. Miscellaneous
The annual energy saving, Annual cost saving, Project Cost, Payback period and return on investment are calculated in each identified areas of Energy saving.
Lighting System
a.Installation of 200 watts energy efficient Induction high bay fittings in place of 400 watts HPMV roof lights at CT Assembly.
Existing system:
24 nos. of 400 watts HPMV lights are being used for roof lighting.
Average ON time per day = 12hrs. No. of working days per year = 313 Energy consumption for 24 fittings =
24 12 400 313 1000 × × ×
= 36058 units/year
Proposed system:
Installation of 200 watts energy efficient induction light fittings in place of 400 watts HPMV lights.
Benefits:
Cost of one induction lamp (200W) = Rs.1045.68 Cost of 24 induction lamps = Rs.25, 096.50 Average ON time per day = 12 hrs.
No. of working days per year = 313 Expected Energy consumption / year =
24 12 200 313 1000 × × ×
= 18029 units/year
The net savings in units = 18029 units / year Per Unit cost is Rs.5.35
The net savings in cost/year = Rs.96, 455.00/ year
The payback period is 3 months.
b.Installation of 120 watts energy efficient induction light fitting in place of 400 watts HPMV roof lights at dust- proof assembly areas and jig boring area at tool room.
Existing system:
25 nos. of 400 watts HPMV lights are being used for roof lighting.
Average ON time per day = 14 hrs. No. of working days per year = 313 Energy consumption for 25 fittings =
25 14 400 313 1000 × × ×
= 43820 units / year
Proposed system:
light fitting in place of 400 watts HPMV roof lights
Benefits:
Cost of one induction lamp (120 watts) : Rs.491 Cost of 25 induction lamps (120 watts): Rs.12275 Expected Energy consumption / year =
25 14 120 313 1000 × × ×
= 13146 units / year
The net savings / year = 30674 units Per Unit cost is Rs.5.35
The net savings= Rs.1, 64, 106 per year The payback period is less than 1 month.
Power Factor Improvements
Findings:
The average power factor of industry is 0.93.
Recommendations:
It is recommended to improve the power factor to an average value of 0.98. The best method to achieve this is to implement Automatic Power Factor Controller (APFC). So that constant power factor is maintained and also requirement of additional capacitor banks can be reduced.
kW PF
KVA =
By improving power factor, KVA consumption can be reduced, thus energy saving can be achieved.
Benefits:
Maximum demand= 8000 KVA KW @ 0.93 PF= 7440 KW If PF is increased to 0.98
The maximum demand can be reduced from 8000 KVA to 7591.83 KVA.
We can achieve a KVA saving of 408 per month and annual KVA saving: 4896
Cost of one KVA = Rs.180
Therefore cost saving for 408 KVA = Rs.73, 440 per month
Annual saving is = Rs.8, 81, 280
Project cost:
Project cost for design of APFC indigenously / locally is working out to be Rs.1.6 lakhs. APFC designed and implemented in one of the manufacturing units achieved a saving of 259 KVA
to all 13 sub-stations which work-out to: 13× Rs.160000 = Rs.20, 80, 000
The payback period is 28 months.
Return on investment = 1
28 = 3.5% per month
Transformer
If the capacity of in-service transformer is very high than the maximum demand, few under loaded transformers can be disconnected and shall be maintained without energizing and a few can be kept as standby. Thus average losses in transformer which is added to energy consumption even when the recorded energy consumption is nil can be avoided.
Findings:
Transformer In-Service: 24349 KVA
For BEML Ltd, the Permitted Maximum demand is 8000 KVA, the capacity of In-Service transformer is 24349 KVA is very high. The total connected load at working condition i.e. with diversity factor 0.4 and at power factor 0.9 with an additional 25% as safety is considered the required transformer capacity is estimated to be 15739 KVA.
Recommendations:
Disconnect few transformers equal to 10000 KVA from the service where they are under loaded with the written permission of State Electricity Board (BESCOM). In case of future expansion if any the disconnected transformer will be put back in service, until then the disconnected transformer shall be maintained without energizing.
Benefits:
As per State Electricity Board, the metering of the high tension service connection is on the low tension side i.e. on the secondary side of the transformer of capacity above 50 KVA.
i. Average losses in the transformer will be
calculated as 720 1.0 C 100 × ×
KWh per month
where C is the KVA rating of the transformer and added to the energy consumption indicated by the
IJISET - International Journal of Innovative Science, Engineering & Technology, Vol. 2 Issue 6, June 2015. www.ijiset.com
ISSN 2348 – 7968
meter. The transformer loss arrived shall be added to the energy consumption, even when the recorded energy consumption is nil.
ii. 1% of the transformer capacity for transformer of 50 KVA will be added to the recorded maximum demand on the low tension side to arrive at the equivalent high tension demand. The transformer loss arrived shall be added to demand even when the recorded demand is nil.
iii. Monthly saving due to disconnected transformer loss
@ Rs.5.35/kWh = 5.35 720 1.0 10000 100
× × ×
=Rs.385200
Monthly reduction in demand charges = 180 1.0 10000
100 × ×
= Rs.18000
Total monthly savings due to transformer disconnection equals Rs.403200 and hence annual savings of Rs.4838400.
Total expenditure (or investment) for disconnection and line annual maintenance of the transformer found to be Rs.662500
Hence payback period =662500 12 4838400
×
= 1.6 months
Return on investment = 1
1.6 = 62% per month.
Air conditioner (AC)
Findings and Recommendations:
There are around 40 ACs assuming it generally it operated at 24P
o
P
C at any change in season, but if, for computer it can be operated at 30P
o
P
C and approximately 1P
o
P
C increase in AC temperature also saves much energy
28P
o
P
C if set result in 3% energy saving and blowing of air from bottom instead of top of AC. Similarly sucking of warm air should be done through top instead of bottom, both will result in 15% energy saving.
Benefits:
For room temperature of 24P
o
P
C energy consumed = 3.85 kWh
Assuming 2400 hours/year of working and for 40 No. of Air conditioners, Energy consumed = 3.85 ∗ 2400 ∗ 40 = 369600 KWh.
If the temperature is set for 28P
o
P
C
Energy consumed/ hour/Air conditioner with modified air flow = 2.9 KWh
For 40 No. of Air conditioners:
Energy consumed = 2.9×2400×40 = 278400 KWh
Cost saving per year = 91200×5.35 = Rs.4, 87, 920
Material and labor cost for doing modifications = Rs.135000 approx.
Payback period = 3.3 months
Return on investment = 1
3.3 = 30% per month.
Replacement of ceiling fan regulators
Findings:
The industry has 834 no. of ceiling fans At present all existing ceiling fans are having conventional type fan regulators.
Recommendations:
The conventional types of fan regulators are to be replaced with electronic type of regulator.
Benefits:
Energy can be reduced up to 61% between minimum to maximum speed by using an electronic type regulator. Reduction in speed of ceiling fan can save energy up to 60%. An average of 27% is reduced in energy consumption if the existing resistor type regulators are replaced with electronic type regulators.
Energy reduction up to 32% between minimum to maximum speed can be achieved also with resistive type of regulators.
Though the initial cost of electronic regulator is high, the higher savings will pay back the investor in less than 10 months. There will be an average reduction in energy consumption by 27% with an electronic type regulator as against a conventional type regulator. Assuming that a ceiling fan is operated for 12 hrs. /day, 313 days per year, the energy cost saving for one ceiling
1000 per year
Therefore the total energy cost saving for 834 fans will be Rs.3, 32, 766.
Cost of a good quality electronic regulator is assumed as Rs.200.
The total investment =Rs.200×834 = Rs.166800 The payback period = 5 months
Operation of DG sets
DSM concept can be used to reduce peak load and diesel generator can be used only to meet the peak load demand. If the load exceeds sanction demand and if penalty charges are applicable then diesel generators may be used only to meet the peak load demand.
Miscellaneous
The other recommendations for energy savings
are
i. Formation of energy conservation cell to implement action plan.
ii. Training to all concerned for monitoring energy saving.
iii. Preventive and periodic maintenance of Equipments.
6. CONCLUSION
The energy audit at the plant resulted in identification of following energy saving opportunities. The Lighting system and power factor corrections recommendations at manufacturing unit are successfully implemented with total saving of Rs.8.2 Lakhs in the annual bill of the plant with the approximate investment of Rs.1.97 Lakhs, which has a pay back of around 3 months.
The annual energy saving, Annual cost saving, Project Cost, Payback period and return on investment are calculated in other identified areas of Energy saving. In future this can be implemented.
The benefits of implementing the energy efficiency measures are substantial both in terms of energy saving and cost economics.
References
lj.si/magister/bora134-B.pdf.
2. Chandran.K.R & Muthukumaraswamy.P: Sitra EnergyAudit-implementation strategy in textile mills, South India Textile Research Association, Coimbatore.
3. Niina Aranto, Tero Ahonen & Juha viholainen: Energy Audits :University Approach with ABB. In : www1.cetim.fr/eemods09/pages/programme/012- Aranto-final.pdf.
4. Ravindra M Datar: Energy Audit- Senergy consultants PVT. Ltd., Mumbai. In: www.senergy- india.com/downloads/senergy-energy-audit.pdf. 5. Saidur.R, Jahirul.M.I: Energy Audit and Consumption
Study of Malaysian Industrial Sector. In: Industrial applications of energy systems (IAES 2008) proceedings.
6. A guidebook for performing walk-through energy audits of Industrial facilities. In: www.oregon.gov/ENERGY/CONS/industry/OCS/Au ditGuide.pdf.www.energy.wsu.edu/industry/research.h tml.
7. Energy Efficiency in Small to Medium Sized Enterprises.-Tata Energy Research Institute. www.teriin.org.