ISSN (Print) : 2320 – 3765 ISSN (Online): 2278 – 8875
I
nternational
J
ournal of
A
dvanced
R
esearch in
E
lectrical,
E
lectronics and
I
nstrumentation
E
ngineering
(An ISO 3297: 2007 Certified Organization)
Vol. 3, Issue 10, October 2014
10.15662/ijareeie.2014.0310026
Throughput Optimization in Cooperative
Communications using Evolutionary
Algorithms
Abhishek Singh
1, Ashish Raman
2, Deepti kakkar
3M.tech Student, Department of ECE, N.I.T Jalandhar, Punjab, India1
Assistant Professor, Department of ECE, N.I.T Jalandhar, Punjab, India2
Assistant Professor, Department of ECE, N.I.T Jalandhar, Punjab, India3
ABSTRACT: This paper illustrates the results of the throughput of Secondary User (SU) in cognitive radios under cooperative scenario with the use of evolutionary algorithms in the presence of additive white Gaussian (AWGN) noise. In this work, the performance of half-voting and OR fusion rule is studied in terms of Pd Vs Pf curves. OR fusion rule is found to be most suitable in cooperative scenario. Then, Particle Swarm Optimization (PSO) and Biogeography Based Optimization (BBO) algorithms are implemented using OR fusion rule to enhance the throughput of cognitive users by taking in to account the protection of primary (licensed) users. The probability of detection is set to 0.9 for protection purpose. Simulations results in terms of co-operations shows that PSO performs better initially but as numbers of co-operations increases PSO performance degrades.
KEYWORDS:Throughput, Evolutionary Algorithms, Fusion rules, Optimization
I.INTRODUCTION
Inrecent years, cognitive radio (CR) has emerged as a promising paradigm for exploiting the spectrum opportunity, which is restricted by the current rigid spectrum allocation scheme, to solve the spectrum scarcity problem [1-2]. Different spectrum sensing techniques are available for sensing primary users (PUs) signals. They can be broadly classified in to three categories: matched filter detection, cyclostationary detection and energy detection [19]. Energy detection is widely adopted because of lower complexity than other two schemes and priori knowledge of signal is also not required. Spectrum sensing depends upon two probabilities namely detection probability (Pd) and false alarm probability (Pf) [5]. Detection probability is related to probability of correctly detecting the presence of PUs, whereas false alarm probability is related to incorrect detection of PUs when it is absent [4]. Many research works are proposed to improve the performance metrics of detection probability and false alarm probability. However, PSO is addressed for sensing-throughput trade-offs problem under cooperative scenarios using various hard combination fusion schemes [3]. Optimization performance of cooperative sensing in terms of number of cooperative users is performed using constant detection rate (CDR) and constant false alarm rate [4]. But, there is no consideration for throughput of CUs. The work in [5] focuses on the optimization of sensing-throughput tradeoffs using iterative algorithms. In this paper, PSO and BBO algorithms are implemented to achieve the same objective. Both the algorithms are performed over OR fusion schemes.
The Paper is organized as follows: Section-II denotes the system model and other performance metrics. A BBO and PSO algorithms are discussed in section III and IV respectively. Section 5 covers the methodology used by proposed work. However, the section VI and section VII include results and conclusions respectively.
II.SYSTEM MODEL
ISSN (Print) : 2320 – 3765 ISSN (Online): 2278 – 8875
I
nternational
J
ournal of
A
dvanced
R
esearch in
E
lectrical,
E
lectronics and
I
nstrumentation
E
ngineering
(An ISO 3297: 2007 Certified Organization)
Vol. 3, Issue 10, October 2014
Fig..1 Energy Detection
The output signal is compared against a particular threshold to decide whether the signal is present or not. Threshold is decided depending upon statistical properties of Output(O/p). In the cooperative detection, secondary users receive the transmitted signals and calculate signal/energy power. After performing detection, individual hard decisions are sent to a fusion centre for decision combining using some fusion rules. The Pf is related to Pd, number of observation samples (N) and SNR (𝛾) as follows [5];
Pf= Q (Q¯¹ Pd ) 1 + 2γ + γ N (1)
The number of observation samples for sensing is related to Pd and Pf [5] under energy detection by:
N= 1
γ2 {Q¯¹ (Pf) - (Q¯¹ (Pd)) 1 + 2γ } ² (2)
The cooperative model taken into consideration is shown in Fig.2 [18];
Fig. 2 Cooperative Environment
In fig.2, CU1, CU2, ……. CUN are cognitive users providing individual sensing decisions which are then combined at the fusion centre using various fusion rules such as OR, AND, and Half-voting.
A.Hard decision fusion rules
The fusion centre implements n-out-of-M rule if at least n local decisions indicate the presence of PUs. The probability of detection at fusion centre assuming uncorrelated decisions is given by [6-7]
Pd= Mn Mk Pd,ik(1 − Pd,i)M−k (3)
1) Logical and-rule
ISSN (Print) : 2320 – 3765 ISSN (Online): 2278 – 8875
I
nternational
J
ournal of
A
dvanced
R
esearch in
E
lectrical,
E
lectronics and
I
nstrumentation
E
ngineering
(An ISO 3297: 2007 Certified Organization)
Vol. 3, Issue 10, October 2014
10.15662/ijareeie.2014.0310026
Pd,and = Pd,iM (4)
2) Logical or-rule
The final decision made by the fusion centre is one if any one of the decision is one. The performance evaluation using this fusion rule is computed by setting n=1 in above equation as [7];
Pd,or= 1 − (1 − Pd,i)M (5)
3) Logical majority rule
If half or more of the local decisions at the fusion centre is one, then the final decision made by the combiner is one and obtained by setting n=M/2 in above equation as [6];
Pd,h.v.= MM/2 Mk Pd,ik(1 − Pd,i)M−k (6)
where Pd,i is the detection probability of 𝑖𝑡ℎ branch of the cooperation and M is the number of cooperative users
B.Throughput-Sensing problem criteria
The CUs first sense the PUs signal and transmits the data if later is absent. The CUs are allocated time frames for both sensing and transmission period. In the end on detecting PUs signal, CUs need to vacate the channel for primary user protection.
The frame structure for CUs is as follows [3]
Fig.3 Frame Structure
where Tf: Frame duration Ts: Sensing time
Td: Data transmission time
Fig.3 describes that a frame duration is divided in to two phases: Sensing phase and transmission phase. The transmission phase contributes to the throughput of cognitive users.
The throughput of the CUs is generated under two conditions, as reported in [8]: First scenario indicates the absence of PU signal and no false alarm is generated by CU. The throughput in this case is given by [3];
R0(Ts) = Tf−Ts
Tf (1 − Pf)C0 (7)
Second scenario states that PU is not detected by CU even if it is present. The throughput for this case is as follows [3];
R1 Ts = Tf−Ts
ISSN (Print) : 2320 – 3765 ISSN (Online): 2278 – 8875
I
nternational
J
ournal of
A
dvanced
R
esearch in
E
lectrical,
E
lectronics and
I
nstrumentation
E
ngineering
(An ISO 3297: 2007 Certified Organization)
Vol. 3, Issue 10, October 2014
C0 ∶denotes throughput of CU in PU absence C1:denotes throughput of CU operating in the presence of PU
The net achievable throughput of the system is represented as [9];
R(Ts)=P H0 R0(Ts)+P(H1)R1(Ts) (9)
Where P(H1) is the probability of PU being active and P H0 = 1 − P(H1)
The problem criterion can be fixed as follows: To maximize the value R(Ts) above such that Pd never goes below 0.9 for PU protection, numerically it can be shown as;
max R(Ts) such that Pd>0.9 wrt FCC guidelines
Assuming P(H1) considerably small<0.2 [9] and C0> C1, eqn. (9) simplifies to
max R Ts =P H0 R0(Ts)=P(H0) Tf−Ts
Tf (1 − Pf)C0 (10) III.BIO-GEOGRAPHY BASED OPTIMIZATION
Biogeography-Based Optimization (BBO) is a global optimization algorithm developed by Dan Simon in 2008 and is inspired by mathematical models of biogeography by Robert MacArthur and Edward Wilson. Biogeography is the study of distribution of species in nature over time and space; that is the immigration and emigration of species between habitats [16]. Each possible solution is an island and their features that characterize habitability are called suitability index variables (SIV) [21]. The fitness of each solution is called its habitat suitability index (HSI) and depends on many features of the habitat. High-HSI solutions tend to share their features with low-HSI solutions by emigrating solution features to other habitats. Low-HSI solutions accept a lot of new features from high-HSI solutions by immigration from other habitats [20].
A. BBO operators
Migration: The BBO migration strategy in which we decide whether to migrate from one region to other or not [22]. The migration rates of each solution are used to probabilistically share features between solutions. BBO migration is used to change existing habitat. Migration in BBO is an adaptive process [16].
Mutation: Mutation is a probabilistic operator the randomly modifies a solution feature. The purpose of mutation is to increase habitat among the population [21]. For low value solutions, mutation gives them a chance of enhancing the quality of solutions, and for high fitness value solutions, mutation try to improve the value as compared to the previous value [20].
B. Limitations of GA over BBO:
1) Genetic algorithms cannot ensure finding a global optimum; they usually give a good approximation [13]. 2) Genetic algorithms can take a long time to converge and are also not easy to implement [17].
3) Genetic algorithms do not scale well with complexity [15]. That is, where the number of elements which are exposed to mutation is large there is often an exponential increase in search space size.
IV.PARTICLE SWARM OPTIMIZATION
ISSN (Print) : 2320 – 3765 ISSN (Online): 2278 – 8875
I
nternational
J
ournal of
A
dvanced
R
esearch in
E
lectrical,
E
lectronics and
I
nstrumentation
E
ngineering
(An ISO 3297: 2007 Certified Organization)
Vol. 3, Issue 10, October 2014
10.15662/ijareeie.2014.0310026
Two fundamental equations which are the essence of PSO representing position and velocity of the particle at any instant t+1 are [10]
V t + 1 = WV t + C1 Pl− X t + C2 Pg− X t (11)
X t + 1 = X t + V(t + 1) (12)
where 𝑃𝑙 and 𝑃𝑔 are local best of particle and global best of the swarm respectively.
For a particle with n-dimensions, vector X and vector V can be represented as X=(x1, x2, . , xn), V=(v1, v2, … , vn) and P=(p1, p2, … . . , pn). V(t) ensures that all the particles are in the right direction without any sudden change whereas 2nd and 3rd terms in eqn. (11) measures the performance of particle relative to its past performance and neighbor performance
V. METHODOLOGY
The basic optimization flow using BBO and PSO algorithm is as follows: Firstly, the performances of decision fusion rules such as OR and Half-Voting are compared in terms of their Pd Vs Pf plots. The rule with better system performance i.e. smaller value of Pf and larger value of Pd is then used in the optimization environment to optimize the throughput (T) of SUs. The optimization parameters for both PSO and BBO such as swarm size, mutation probability, weight factors, and learning factors are defined. Then solutions are randomly initialized for BBO with random positions and zero initial velocities in case of PSO. Based on the migration rate, the features of solutions are updated and mutation if desired is applied in BBO. The positions of particles are updated in terms of velocity vectors in PSO. This process continues until the desired output or termination condition is achieved. Finally, the results are compared to conclude the performances of both evolutionary algorithms.
Table. 2 Parameters of PSO
Parameters Values
Number of particles 75
Number of iterations 75
Learning factors C1 and C2 0.8
Wmax 0.44
Wmin 0.4
Target Pd 0.9
Min. samples(Nmin) 5
Max. samples(Nmax) 320
Parameters Values
Emax 1
Imax 1
Population size 75
Mutation probability 0.04
No. of iterations 75
Target Pd 0.9
Pf <=0.3
Elite solutions 2
Min. samples(Nmin) 5
Max. samples(Nmax) 320
ISSN (Print) : 2320 – 3765 ISSN (Online): 2278 – 8875
I
nternational
J
ournal of
A
dvanced
R
esearch in
E
lectrical,
E
lectronics and
I
nstrumentation
E
ngineering
(An ISO 3297: 2007 Certified Organization)
Vol. 3, Issue 10, October 2014
The value of parameters used for BBO and PSO algorithm are indicated in table 1 and table 2 respectively. These values are used for designing the framework of optimization process.
VI.RESULTS AND DISCUSSIONS
Based on the boundary condition given in table 1 and 2, all the simulation has been performed on MATLAB under nakagami-m fading environment with AWGN, with Pf<=0.3 and Pd=0.9. Using the formula for OR fusion rule as given in equation (5), simulation is carried out.
Fig.5. shows the Pd Vs Pf curve for AWGN channel with half voting Fusion rule for different number of co-operations (2, 3 and 4).
ISSN (Print) : 2320 – 3765 ISSN (Online): 2278 – 8875
I
nternational
J
ournal of
A
dvanced
R
esearch in
E
lectrical,
E
lectronics and
I
nstrumentation
E
ngineering
(An ISO 3297: 2007 Certified Organization)
Vol. 3, Issue 10, October 2014
10.15662/ijareeie.2014.0310026
Fig.5 Pd Vs Pf curve for AWGN channel with Fig.6. Pd Vs Pf curves for AWGN channel with OR fusion rule Half voting fusion rule
From fig.5 and fig.6, it is seen that ROC curves for both fusion rules shift toward left side with increase in number of cooperation indicating an improvement in system performance. But the shift in case of OR fusion rule is more as compared to half-voting rule. For 4 cooperation case, targeted detection probability (Pd) of 0.9 is achieved at Pf=0.2 in case of OR fusion rule and at Pf=0.45 in case of half-voting rule. A smaller value of Pf denotes that OR fusion rule is more suitable as compared to Half-Voting rule. The table.3 is formed using eqn. (2) and (10). The value of throughput for OR fusion rule with different number of cooperation is shown in table 3.
Number of cooperations (C)
Number of samples (Nmin)
Avg snr(in dB) Detection
probability (Pd)
False alarm probability (Pf)
Throughput
(T)
2 4 2 0.9 0.32 0.6715
3 5 2 0.9 0.20 0.7875
4 6 2 0.9 0.15 0.8340
5 7 2 0.9 0.07 0.9096
ISSN (Print) : 2320 – 3765 ISSN (Online): 2278 – 8875
I
nternational
J
ournal of
A
dvanced
R
esearch in
E
lectrical,
E
lectronics and
I
nstrumentation
E
ngineering
(An ISO 3297: 2007 Certified Organization)
Vol. 3, Issue 10, October 2014
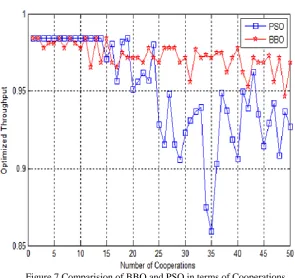
Figure.7 Comparision of BBO and PSO in terms of Cooperations .
Fig.7 shows the throughput of the SUs with respect to cooperation for both PSO and BBO. Simulation results shows that both optimization algorithms provides better results as compared to non-optimized throughput values as given in table 3. There is an improvement of 8% in SU throughput for 4 cooperations. Among BBO and PSO, PSO is dominant initially but its performance deteriorates as the number of cooperations increases.
VII.CONCLUSION
With the help of this paper, we study the performance of the BBO and PSO algorithms for throughput optimization of the cognitive users in cooperative scenario case using OR fusion rule and comes at the conclusion that these evolutionary algorithms perform better than non-optimized (normal) case and results in higher achievable throughput. The performance of the PSO algorithm in terms of number of co-operations is dominant initially but as the number of co-operations increases, BBO performance remains steady whereas PSO performance degrades.
REFRENCES
[1] S. Haykin, “Cognitive radio: brain-empowered wireless communications,” IEEE Journal on Selected Areas in Communications, vol. 23, pp. 201-220, 2005.
[2] Q. Zhao and B. M. Sadler, “A survey of dynamic spectrum access: signal processing, networking, and regulatory policy,” IEEE Signal Processing Magazine, vol. 24, pp. 79-89, May 2007.
[3] Rozeha A. Rashid, A. Hadi Fikri A. Hamid, N. Fisal, M. Adib Sarijari, Rozaini A. Rahim, Alias Mohd“Optimal User Selection for Decision Making in Cooperative Sensing IEEE symposium on wireless and technology application”sept 2012
[4] Edward Peh and Ying-Chang Liang,” Optimization for Cooperative Sensing in Cognitive Radio Network”, WCNC , Hong Kong, vol. 58, no. 9, pp. 11-15, 2007
[5] E.C.Y. Peh, Y.C. Liang, Y. L. Guan and Y. Zeng, “Optimization of Cooperative Sensing in Cognitive Radio Networks: A Sensing-Throughput Tradeoff View”, IEEE Trans. On Vehicular Technology, vol. 58, no. 9, 2009
[6] Md. Shamim Hossain , Md. Mahabubur Rahman, Md. Ibrahim Abdullah and Mohammad Alamgir HossainHard ,”Combination Data Fusion for Cooperative Spectrum Sensing in CognitiveRadio“vol.2,pp. 811-818, 2012
ISSN (Print) : 2320 – 3765 ISSN (Online): 2278 – 8875
I
nternational
J
ournal of
A
dvanced
R
esearch in
E
lectrical,
E
lectronics and
I
nstrumentation
E
ngineering
(An ISO 3297: 2007 Certified Organization)
Vol. 3, Issue 10, October 2014
10.15662/ijareeie.2014.0310026
[8] Yiyang Pei, Anh Tuan Hoang, Ying-Chang Liang,” Sensing-Throughput Tradeoff in Cognitive Radio Networks: How Frequently Should Spectrum Sensing be Carried Out?,” IEEE 18th International Symposium on Personal, Indoor and Mobile Radio Communications,PIMRC , pp. 1-5, Athens. 3-7 Sept. 2007.
[9] Y.-C. Liang, Y. Zeng, E. C. Y. Peh, and A. T. Hoang, “Sensingthroughput tradeoff for cognitive radio networks”, IEEE Trans. Wireless Commun., vol. 7, no. 4, pp. 1326-1337, 2008.
[10] J. Kennedy, and R. C. Eberhart, “Particle swarm optimization”, Proc. IEEE International Conference on Neural Networks, Australia, vol. 4, pp. 1942-1948, 1995.
[11] J. Kennedy and R. C. Eberhart, Swarm Intelligence, Morgan Kauffman Publishers, California, 2001.
[12] C. Mendis, S. M. Guru, S. Halgamuge, and S. Fernando, "Optimized Sink node Path using Particle Swarm Optimization", 20th International Conference on Advanced Information Networking and Applications, IEEE computer society, vol.2, pp. 5, 2006
[13] Prasanna A. Lohe and D.D.Patil , “Enhancement of Digital X-Ray Image by Combining the Genetic Optimization and Watershed Transformation Technique” , IJESIT, vol. 2, no. 1, 2013
[14] Khaled Ben Letaief and Wei Zhang, “Cooperative Communications for Cognitive Radio Networks”, IEEE Trans. Wireless Commun.,vol. 97, no. 5, 2009
[15] en.wikipedia.org/wiki/Genetic_algorithm
[16] Dan Simon, “Biogeography-Based Optimization”, IEEE Trans. on Evolutionary Computation, vol. 12, no. 6, 2008
[17] Mittu Mittal and Gagandeep, “Comparison between BBO and Genetic Algorithm”, IJSETR ,vol. 2, no. 2, pp. 284-293, 2013
[18] Lu Lu*, Xiangwei Zhou, Uzoma Onunkwo and Geoffrey Ye Li,“Ten years of research in spectrum sensing and sharing in cognitive radio”,
EURASIP Journal on Wireless Communications and Networking2012, 2012:28 doi:10.1186/1687-1499-2012-28
[19] Nan Zhao, Fei Richard Yu, Hongjian sun, Arumugam Nallanathan, “Energy-efficient cooperative spectrum sensing schemes for cognitive radio networks”, EURASIP Journal on Wireless Communications and Networking 2013, 2013:120 doi:10.1186/1687-1499-2013-120
[20] H. Ma, D. Simon, Biogeography-based optimization with blended migration for constrained optimization problems, in: Genetic and Evolutionary Computation Conference, Portland, OR, pp. 417–418, July 2010.
[21] V. Panchal, P. Singh, N. Kaur, H. Kundra, “Biogeography based satellite image classification”, International Journal of Computer Science and Information Security vol. 6 , no. 2 ,pp. 269–274, 2009.
[22] R. Rarick, D. Simon, F.E. Villaseca, B. Vyakaranam, “Biogeography-based optimization and the solution of the power flow problem”, in: IEEE Conference on Systems, Man, and Cybernetics, San Antonio, Texas, pp. 1029–1034, 2009.