Page 1 of 11 Original Article
Association between genetic risk scores and risk of narcolepsy: a
case-control study
Hui Ouyang1, Fang Han2, Zechen Zhou3, Qiwen Zheng3, Yangyang Wang1, Jun Zhang1
1Department of Neuromedicine, 2Department of Pulmonary Medicine, Peking University People’s Hospital, Beijing 100044, China; 3Department of Epidemiology and Biostatistics, School of Public Health, Peking University Health Science Center, Beijing 100191, China
Contributions: (I) Conception and design: H Ouyang, J Zhang; (II) Administrative support: J Zhang; (III) Provision of study materials or patients: F Han; (IV) Collection and assembly of data: H Ouyang, Y Wang, F Han; (V) Data analysis and interpretation: H Ouyang, Z Zhou, Q Zheng; (VI) Manuscript writing: All authors; (VII) Final approval of manuscript: All authors.
Correspondence to: Jun Zhang. Department of Neuromedicine, Peking University People’s Hospital, 11 Xizhimen South Street, Beijing 100044, China. Email: zhangjun@pkuph.edu.cn.
Background: Genome-wide association studies (GWASs) have identified a large number of single-nucleotide polymorphisms (SNPs) associated with narcolepsy. However, the sum impact of these SNPs on defining the genomic risk of narcolepsy remains unknown. In the present study, we investigated the associations between genetic risk scores (GRSs) and narcolepsy along with their predictive power
Methods: A case-control study consisting of 903 narcolepsy patients and 1,981 healthy control subjects was performed. Thirty-two SNPs previously reported to confer susceptibility to narcolepsy were assessed for their association with narcolepsy risk. Subsequently, we constructed four GRS groups comprising reported narcolepsy susceptibility SNPs located in different genomic regions, and tested their association with narcolepsy risk using a regression model. Receiver operating characteristic (ROC) curves were used to examine the discriminatory power of the GRSs for predicting narcolepsy.
Results: Nine individual SNPs were significantly associated with narcolepsy after Bonferroni correction. All four GRSs were strongly associated with narcolepsy risk even when GRSs were constructed using SNPs located outside the previously implicated human leukocyte antigen (HLA) region on chromosome 6. The odds ratio (OR) for narcolepsy risk increased with the number of genetic loci implicated, ranging from an OR of 2.016 (95% CI, 1.657–2.456) to an OR of 4.298 (95% CI, 3.378–5.481). GRS4, constructed using the narcolepsy-associated SNPs identified in the Chinese population, was most closely associated with narcolepsy risk.
Conclusions: The results suggest that the GRS method for combining common genetic variations can significantly associate GRS scores with narcolepsy risk and may facilitate narcolepsy risk stratification for prevention trials, both for HLA-DQB1*06:02-positive and -negative individuals.
Keywords: Case-control study; genetic risk score (GRS); single-nucleotide polymorphisms (SNPs)
Submitted Nov 27, 2019. Accepted for publication Dec 12, 2019. doi: 10.21037/atm.2019.12.95
View this article at: http://dx.doi.org/10.21037/atm.2019.12.95
Introduction
Narcolepsy is a life-long neurological disorder characterized by excessive daytime sleepiness, cataplexy, sleep paralysis, hallucinations, and disrupted nocturnal sleep (1). While narcolepsy can manifest at any age, symptoms typically
(SNPs) (2-9). Recently, the genetic risk of narcolepsy has been evaluated based on the HLA-DQB1*06:02 marker, because 10–40% of healthy individuals are also carriers, it represents an important but seemingly imperfect predictor of narcolepsy (10-12). In addition to HLA-DQB1*06:02, many other genes have been implicated in narcolepsy risk in international SNP-based genome-wide association studies (GWASs), including carnitine palmitoyltransferase 1B (CPT1B), choline kinase-β (CHKB), T cell receptor alpha(TCRA),purinergic receptor P2Y, G-protein coupled 11 (P2RY11), tumor necrosis factor superfamily member 4 (TNSF4), cathepsin H (CTSH), T cell receptor beta (TCRB), zinc finger protein 365(ZNF365), chemokine receptor1 (CCR1), chemokine receptor3(CCR3),eukaryotic initiation factors 3G (EIF3G), and interleukin 10 receptor, beta (IL10RB) (2-9,13). SNPs conferring narcolepsy susceptibility in the human leukocyte antigen (HLA) and other regions have also been identified (4,14,15).
The studies referenced above have provided a rich compendium of genetic variations potentially underlying narcolepsy and prepared the grounds for building new risk prediction tools. However, the effects of common SNPs identified by GWASs are usually minor and of unclear clinical significance. In order to complement GWASs and uncover potential instances of “missing heritability”, several studies investigated the benefits of conflating genomic risk estimates obtained from SNP genotyping into a genetic risk score (GRS) to predict the risk of diseases such as cancer (16), diabetes (17), schizophrenia (18), coronary artery disease (19), Alzheimer’s disease (20), and leukemia (21). These studies have repeatedly demonstrated significant associations between GRSs and disease risk. As for narcolepsy, although GWASs have been performed, few studies have investigated the aggregate effects of genetic variants on narcolepsy risk in large study samples. We therefore selected SNPs discovered in recently reported narcolepsy susceptibility loci (including variants in European and Asian ancestry reported in previous case-control studies) and investigated the association of these SNPs, along with their related GRSs, with narcolepsy risk in a Chinese population.
Methods
Study site and population
We performed a case-control study comprising 1,062 narcolepsy patients and 1,997 healthy control subjects. The patients were recruited from the sleep laboratory of Peking
University People’s Hospital, a unit that receives referrals from all over China. The narcolepsy patients had either hypocretin deficiency (CSF hypocretin-1 ≤110 pg/mL) or clear-cut cataplexy and HLA-DQB1*06:02 (3). Subjects were all Chinese, mostly of Han descent (95%). The majority of study patients were male (68%). The controls were Chinese university employees and students (41% male), and were free of narcolepsy as determined by clinical examination and medical history. Trained interviewers used structured questionnaires to collect information on demographic variables, medical history, and medication. Informed consent (in accordance with governing institutions) was obtained from all subjects. The research protocols were approved by the Institutional Review Board on Medical Human Subjects Research at the Peking University People’s Hospital.
Genotyping and quality control
SNP genotyping and quality control have been described in detail elsewhere (4). In brief, samples were genotyped and analyzed using the Affymetrix Axiom CHB array and the Affymetrix Genotyping Console. All samples used in the current study achieved a call rate of >99%. In total, 903 narcolepsy cases and 1,981 healthy controls were included for further analysis.
Genetic loci selection
We selected 40 previously discovered narcolepsy risk loci from GWAS studies published before September, 2018 (2,4-6,8,9,14,15,22,23). The narcolepsy susceptibility loci identified in both the Chinese population and European population were selected. The final candidate SNPs were in approximate linkage equilibrium with all pairwise r2
Table 1 SNPs selected for the study
Chromosome Gene SNP Tag SNP r2 LD† Allele Risk allele Missing (%) MAF‡ P for HWE§
1 TNFSF4 rs7553711 rs4090391 0.999 1 C/T T 0.5 0.08 0.057
1 MIR-552 rs10915020 rs12026171 0.928 1 A/G G 0.2 0.06 0.681
3 CCR1/CCR3 rs3181077 – – – C/T C 0.1 0.11 0.246
4 BTBD9 rs3923809 – – – A/G G 0.5 0.40 0.999
7 TRB rs2854536 – – – T/C T 0.3 0.24 0.48
8 UBXN2B rs2859998 rs6993992 0.999 1 T/C T 0.3 0.47 0.999
10 ZNF365 rs10995245 – – – G/A A 0.2 0.31 0.507
10 A1CF rs4290173 rs16911668 0.956 1 A/G A 0.1 0.12 0.172
12 TEAD4 rs12425451 rs12322530 0.947 1 G/A G 0.3 0.09 0.283
14 TRA rs1154155 – – – T/G T 0.8 0.45 0.682
14 rs12587781 rs1154153 0.999 1 T/C T 0.2 0.36 0.264
14 rs1263646 rs1263647 0.981 1 A/G A 0.2 0.46 0.470
15 CTSH rs12148472 – – – T/C C 0.1 0.05 1.000
15 rs3825932 – – – T/C T 0.1 0.11 0.745
19 DNMT1 rs2290684 rs2114724 0.999 1 C/T T 0.0 0.29 0.406
19 rs6511570 rs7253062 0.999 1 G/A G 0.2 0.25 0.999
20 NFATC2 rs8119787 – – – A/G G 0.1 0.37 0.841
21
IL10RB-IFNAR1
rs2834118 rs2834113 0.934 0.966 T/G G 0.6 0.16 0.176
21 rs2252931 rs2834188 0.999 1 A/G A 0.3 0.28 0.625
22 CPT1B-CHKB rs5770917 rs5770911 0.999 1 C/T C 0.2 0.23 0.237
1 DHS
HLA
rs213038 rs213026 0.961 1 C/T T 0.0 0.39 0.847
6 rs1338829 rs9444828 0.869 0.979 C/T T 0.2 0.48 0.927
6 rs473267 – – – C/T T 0.2 0.34 0.919
11 rs290183 rs7122887 0.959 1 C/T C 0.1 0.36 0.924
18 rs1786783 rs524513 0.821 0.935 C/T T 0.1 0.08 0.644
20 rs4810966 rs169160 0.896 1 T/C T 0.5 0.36 0.698
6 rs9274477 – – – A/G A 0.14 0.30 0.243
6 rs9271117 – – – T/C C 0.42 0.34 0.899
6 rs2858884 rs2859090 0.999 1 G/A G 0.10 0.06 0.209
6 rs3117242 rs3117221 0.999 1 C/T T 0.24 0.46 0.237
6 rs2523882 rs2517455 0.962 1 C/T C 0.21 0.44 0.164
6 rs3129907 rs3129932 0.999 1 C/G G 0.76 0.14 0.093
Statistical analyses
We used the χ2 test to assess whether the SNPs were in HWE and to determine the differences in genotype frequencies between narcolepsy patients and controls. Statistical significance was set to a two-sidedP value of less than 0.05. The experiment-wide significance level was derived via Bonferroni correction for the number of lead SNPs.
For the construction of individual GRSs, a genetic score was calculated based on a personal genotype of the SNPs that are associated with narcolepsy, and unweighted GRSs were calculated by adding the number of risk alleles across each SNP. We constructed four different GRSs (the SNPs included in GRSs were shown in Table 2):
(I) GRS1 excluded the SNPs in the HLA region; (II) GRS2 was limited to the SNPs from the HLA region; (III) GRS3 included all selected SNPs; and (IV) GRS4 only included the SNPs reported in the Chinese population. We considered the GRSs as continuous variables and as tertiles defining low risk, intermediate risk, and high risk classes. Categorical variables were shown in proportions. The associations of the GRSs with narcolepsy risk were evaluated using the logistic regression model adjusted by gender. Odds ratios, 95% CI, and Pvalues were calculated.
We further examined the ability of the four GRSs to discriminate between patients and controls by using receiver-operating characteristics (ROC) curves adjusted for gender. We used Haploview (version 4.2) to calculate the linkage disequilibrium of selected SNPs. The subsequent statistical analyses were performed by using R (version 3.5.0).
Results
The demographic and clinical data of the narcolepsy patients are presented in Table 3. Among these patients, 860
(95.2%) were of Chinese Han ethnicity, 285 (31.6%) were women, 618 (68.4%) were men, and 18 (2.0%) had a family history of narcolepsy. Among the healthy controls, 678 (34.2%) were men, and 1,303 (65.8%) were women. The flow chart of the inclusion process is shown in Figure 1.
Association between individual SNP and narcolepsy risk
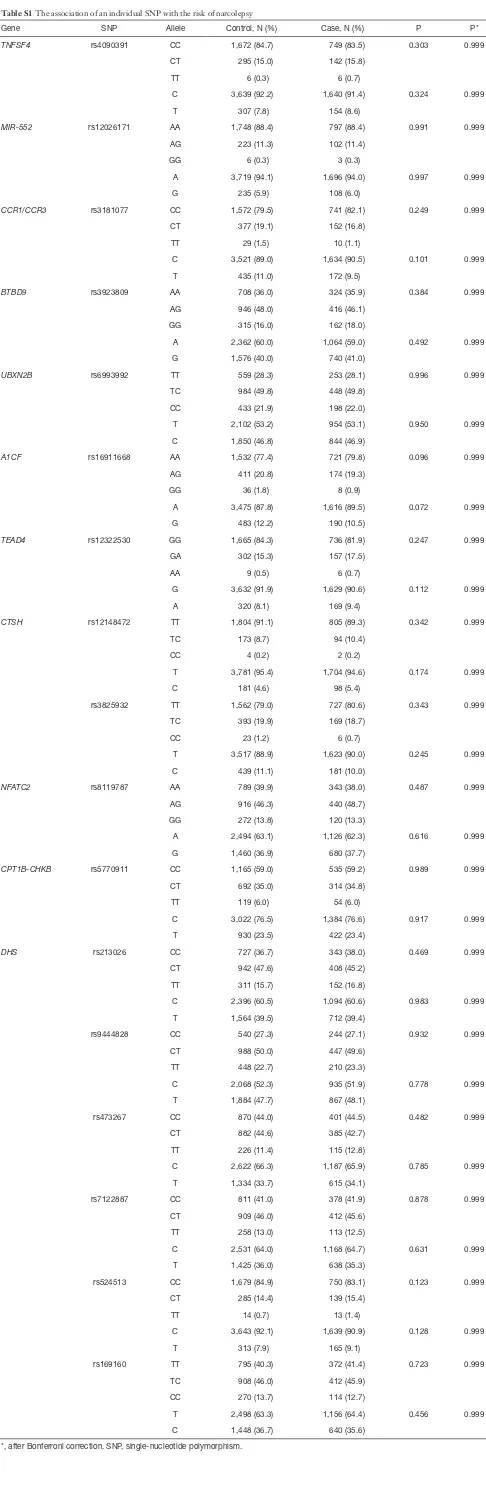
We examined the association between the individual genetic variant and narcolepsy risk. Fourteen loci, including TRB (rs2854536), ZNF365 (rs10995245), DNMT1 (rs2114724, rs7253062), IL10RB-IFNAR1 (rs2834113, rs2834188), TRA (rs1154155, rs1154153, rs1263647), and HLA region (rs9274477, rs9271117, rs2859090, rs3129932, rs2517455) showed significant associations with incident narcolepsy, with P values ranging from <0.001 to 0.005. After the Bonferroni correction, TRB (rs2854536), ZNF365 (rs10995245), TRA (rs1154155, rs1154153, rs1263647), and HLA region (rs9274477, rs9271117, rs2859090, rs3129932) remained statistically significant. The association of each individual SNP with narcolepsy risk is summarized in Tables 4 and S1.
Combined genetic effects on narcolepsy risk
We examined the association between the GRSs and narcolepsy risk and observed that the GRSs were significantly associated with narcolepsy risk. Table 5 shows the odds ratios (ORs) for the association between incident narcolepsy and GRSs, comparing the narcolepsy risk of individuals in the low polygenic load categories with the narcolepsy risk of individuals in the intermediate and high polygenic load category. Individuals who carry a higher polygenic load have higher odds of narcolepsy compared with patients carrying a low polygenic load. The OR of
Table 2 SNPs included in the GRSs
GRS category SNPs involved in the GRS
GRS1 rs4090391, rs12026171, rs3181077, rs3923809, rs2854536, rs6993992, rs10995245, rs16911668, rs12322530, rs1154155, rs12148472, rs7253062, rs8119787, rs2834113, rs2834188, rs5770911
GRS2 rs9274477, rs3117221, rs2517455, rs3129932
GRS3 rs4090391, rs12026171, rs3181077, rs3923809, rs2854536, rs6993992, rs10995245, rs16911668, rs12322530, rs1154155, rs12148472, rs7253062, rs8119787, rs2834113, rs2834188, rs5770911, rs213026, rs9444828, rs473267, rs2859090, rs7122887, rs524513, rs169160, rs9274477, rs3117221, rs2517455, rs3129932
narcolepsy risk increased as the genetic load for narcolepsy increased, ranging from an OR of 2.016 (95% CI, 1.657– 2.456) to an OR of 4.298 (95% CI, 3.378–5.481). Among the four GRSs, GRS4 (constructed from the narcolepsy susceptibility SNPs identified in the Chinese population) was most closely associated with narcolepsy risk with an OR of 4.298 (95% CI, 3.378–5.481) followed by GRS3 constructed using all narcolepsy-associated SNPs.
The discriminatory power of GRS
To further refine these results, we examined the discriminatory power of the GRSs for individuals at high risk of narcolepsy by using the ROC curve. The discriminatory ability of the model using GRS1, measured as area under the curve (AUC), was 0.709. The other models using GRS2, GRS3, and GRS4 showed modestly improved discrimination with AUCs of 0.715, 0.723, and 0.736, respectively (Figure 2). These results showed that the GRS constructed from the narcolepsy susceptibility SNPs reported in the Chinese population provided greater discrimination than other GRSs. At a cutoff of 0.335, which was determined according to the maximum of the Youden Index, GRS4 had a sensitivity of 70.9% and a specificity of 65.1% in discriminating narcolepsy patients from healthy controls.
Discussion
The present study reports two main findings: first, we
Table 3 Demographic and clinical variables of the narcolepsy
patients and controls
Variables Cases Controls
Male, n (%) 618 (68.4) 678 (34.2)
Chinese, n (%) 903 (100.0) 1,981 (100.0)
Diagnostic delay (years), median [Q1, Q3]
2 [0–8] NA
Age of onset (years), median [Q1, Q3]
9 [7–13] NA
Inflammation before onset, n (%) 39 (4.3) NA
Cataplexy, n (%) 903 (100.0) 0 (0.0)
Sleep paralysis, n (%) 331 (36.7) 0 (0.0)
Hypnagogic hallucinations, n (%) 525 (58.1) 0 (0.0)
Number of symptoms, n (%)
1 284 (31.5) 0 (0.0)
2 356 (39.4) 0 (0.0)
3 242 (26.8) 0 (0.0)
Familial history, n (%) 18 (2.0) 0 (0.0)
The self-report impairment of life quality, n (%)
No impairment 99 (11.0) 1,981 (100.0)
Small impairment 244 (27.0) 0 (0.0)
Great impairment 254 (28.1) 0 (0.0)
CSF hypocretin (pg/mL), median (Q1, Q3)
17.8 (12.7–30.5)
NA
REM, rapid eye movement; CSF, cerebral spinal fluid.
Healthy controls (n=1,997)
Healthy controls (n=1,981) Excluded (n=16)
Call rate <99% or have relatives
Excluded (n=159)
Abnormal value of clinical measures (n=57) Age <2 or >60 (n=13)
Call rate <99% or have relatives (n=89) Narcoleptic patients (n=1,062)
Narcoleptic patients (n=903)
Analysis
Table 4 Association of individual SNPs with narcolepsy risk
Gene SNP Allele Control, N (%) Case, N (%) P P†
TRB rs2854536 TT 1,087 (55.1) 554 (61.6) <0.001 0.005
TC 764 (38.7) 317 (35.2)
CC 123 (6.2) 29 (3.2)
T 2,938 (74.4) 1,425 (79.2) <0.001 0.003
C 1,010 (25.6) 375 (20.8)
ZNF365 rs10995245 GG 998 (50.5) 375 (41.5) <0.001 <0.001
GA 821 (41.5) 427 (47.3)
AA 157 (7.9) 101 (11.2)
G 2,817 (71.3) 1,177 (65.2) <0.001 <0.001
A 1,135 (28.7) 629 (34.8)
TRA rs1154155 TT 518 (26.3) 317 (35.5) <0.001 <0.001
TG 975 (49.5) 479 (53.7)
GG 476 (24.2) 96 (10.8)
T 2,011 (51.1) 1,113 (62.4) <0.001 <0.001
G 1,927 (48.9) 671 (37.6)
rs1154153 TT 760 (38.5) 430 (47.6) <0.001 <0.001
TC 912 (46.2) 403 (44.6)
CC 304 (15.4) 70 (7.8)
T 2,432 (61.5) 1,263 (69.9) <0.001 <0.001
C 1,520 (38.5) 543 (30.1)
rs1263647 AA 505 (25.6) 310 (34.3) <0.001 <0.001
AG 1,003 (50.8) 469 (51.9)
GG 468 (23.7) 124 (13.7)
A 2,013 (50.9) 1,089 (60.3) <0.001 <0.001
G 1,939 (49.1) 717 (39.7)
DNMT1 rs2114724 CC 1,003 (50.7) 426 (47.2) 0.072 1
CT 823 (41.6) 387 (42.9)
TT 154 (7.8) 90 (10.0)
C 2,829 (71.4) 1,239 (68.6) 0.031 1
T 1,131 (28.6) 567 (31.4)
rs7253062 GG 1,085 (54.9) 539 (59.8) 0.025 0.825
GA 759 (38.4) 317 (35.2)
AA 133 (6.7) 45 (5.0)
G 2,929 (74.1) 1,395 (77.4) 0.007 0.231
A 1,025 (25.9) 407 (22.6)
Table 4 (Contiuned)
Gene SNP Allele Control, N (%) Case, N (%) P P†
IL10RB-IFNAR1
rs2834113 TT 1,386 (70.3) 627 (70.0) 0.021 0.693
TG 543 (27.5) 234 (26.1)
GG 42 (2.1) 35 (3.9)
T 3,315 (84.1) 1,488 (83.0) 0.333 1
G 627 (15.9) 304 (17.0)
rs2834188 AA 983 (49.8) 496 (54.9) 0.006 0.198
AG 812 (41.2) 352 (39.0)
GG 177 (9.0) 55 (6.1)
A 2,778 (70.4) 1,344 (74.4) 0.002 0.066
G 1,166 (29.6) 462 (25.6)
HLA rs9274477 AA 876 (44.3) 512 (56.7) <0.001 <0.001
AG 862 (43.6) 391 (43.3)
GG 239 (12.1) 0 (0)
A 2,614 (66.1) 1,415 (78.3) <0.001 <0.001
G 1,340 (33.9) 391 (21.7)
rs9271117 TT 1,190 (60.3) 37 (24.5) <0.001 <0.001
TC 683 (34.6) 642 (71.4)
CC 100 (5.1) 220 (4.1)
T 3,063 (77.6) 716 (39.8) <0.001 <0.001
C 883 (22.4) 1,082 (60.2)
rs2859090 GG 1,689 (85.3) 835 (92.6) <0.001 <0.001
GA 274 (13.8) 67 (7.4)
AA 16 (0.8) 0 (0)
G 3,652 (92.3) 1,767 (96.3) <0.001 <0.001
A 306 (7.7) 67 (3.7)
rs3117221 CC 581 (29.4) 254 (28.2) 0.367 1
CT 1,006 (50.9) 448 (49.8)
TT 390 (19.7) 198 (22.0)
C 2,168 (54.8) 956 (53.1) 0.236 1
T 1,786 (45.2) 844 (46.9)
rs2517455 CC 607 (30.7) 300 (33.2) 0.037 1
CT 947 (47.9) 447 (49.5)
TT 421 (21.3) 156 (17.3)
C 2,161 (54.7) 1,047 (58.0) 0.022 0.726
T 1,789 (45.3) 759 (42.0)
rs3129932 CC 1,547 (78.7) 595 (66.4) <0.001 <0.001
CG 385 (19.6) 270 (30.1)
GG 34 (1.7) 31 (3.5)
C 3,479 (88.5) 1,460 (81.5) <0.001 <0.001
G 453 (11.5) 332 (18.5)
confirmed the significant associations between reported individual SNPs and narcolepsy risk. Second, we found that the GRSs constructed from SNPs that were located
in different regions showed significant associations with narcolepsy. Together, these findings buttress the feasibility of discovering genetic biomarkers for disease risk prediction or prognosis.
To the best of our knowledge, the present study is the first detailed and large-scale genetic study of narcolepsy in the Chinese population and the largest study applying the GRS approach to evaluate the polygenic risk of narcolepsy. Major strengths of the present study include the following: (I) we constructed several GRSs from SNPs from different regions and compared their discriminate power; (II) we created GRSs using common narcolepsy susceptibility variants from both Asian and European populations. It is thus likely that our findings apply to multiple ethnicities.
We assessed the association of the reported narcolepsy-related variants at 32 loci in the Chinese ethnic group. The trends observed with 14 narcolepsy-associated loci were consistent with previous studies (2-4,25-27). In particular, nine loci, including TRB, ZNF365, TRA, and SNPs within the HLA region, showed significant
Table 5 Association of GRSs with the risk of narcolepsy
Risk group Control,
N=1,981 (%)
Case, N=903 (%)
Crude model Adjusted model 1¶
Odds ratio (95% CI) P Odds ratio (95% CI) P
GRS1† 1.151 (1.111–1.193) <0.001 1.150 (1.108–1.194) <0.001
Low risk (GRS1 <16) 774 (39.1) 249 (27.6) 1 1
Intermediate risk (16≤ GRS1 <18) 672 (33.9) 307 (34.0) 1.420 (1.167–1.729) 0.002 1.431 (1.164–1.760) <0.001
High risk (GRS1 ≥18) 535 (27.0) 347 (38.4) 2.016 (1.657–2.456) <0.001 2.027 (1.648–2.495) <0.001
GRS2‡ 1.357 (1.274–1.447) <0.001 1.343 (1.256–1.437) <0.001
Low risk (GRS2 <4) 998 (50.4) 307 (34.0) 1 1
Intermediate risk (4≤ GRS2 <5) 544 (27.5) 285 (31.6) 1.703 (1.405–2.064) <0.001 1.717 (1.403–2.102) <0.001
High risk (GRS2 ≥5) 439 (22.2) 311 (34.4) 2.303 (1.898–2.796) <0.001 2.222 (1.813–2.727) <0.001
GRS3§ 1.149 (1.119–1.181) <0.001 1.152 (1.120–1.185) <0.001
Low risk (GRS3 <25) 925 (46.7) 279 (30.9) 1 1
Intermediate risk (25≤ GRS3 <28) 688 (34.7) 337 (37.3) 1.623 (1.348–1.958) <0.001 1.620 (1.332–1.973) <0.001
High risk (GRS3 ≥28) 368 (18.6) 287 (31.8) 2.586 (2.109–3.173) <0.001 2.602 (2.097–3.232) <0.001
GRS4|| 1.449 (1.367–1.536) <0.001 1.442 (1.357–1.534) <0.001
Low risk (GRS4 <6) 818 (41.3) 192 (21.3) 1 1
Intermediate risk (6≤ GRS4 <8) 937 (47.3) 483 (53.5) 2.196 (1.816–2.664) <0.001 2.174 (1.782–2.661) <0.001
High risk (GRS4 ≥8) 226 (11.4) 228 (25.2) 4.298 (3.378–5.481) <0.001 4.157 (3.224–5.371) <0.001
†, SNPs outside the HLA region; ‡, SNPs within the HLA region; §, all 32 SNPs selected; ||, SNPs reported in the Chinese population;
¶, adjusted for gender. GRSs, genetic risk scores; HLA, human leukocyte antigen.
Figure 2 ROC curve of the GRS models for discriminating
narcoleptic patients. ROC, receiver operating characteristic; GRS, genetic risk score.
100
80
60
40
20
0
100 80 60 40 20 0 Specificity (%)
Sensitivity (%)
GRS1 (the GRS excluding the SNPs in the HLA region) AUC: 0.709 GRS2 (the GRS only including the SNPs ofHLA region) AUC: 0.715 GRS3 (all the selected SNPs) AUC: 0.723
association with narcolepsy risk after Bonferroni correction. While these variants were mostly identified in European populations, they each showed association with broader global populations, including groups of Asian ancestry (4,9). On the other hand, we were unable to confirm, in our Chinese sample, the individual associations for several genetic variants previously reported to be associated with narcolepsy risk. This could be due to insufficient statistical power to identify variants with small individual effects or to the diverse genetic backgrounds of a variety of ethnicities.
GRSs have been previously employed to increase statistical power when investigating the association with disease-related phenotypes. Our results confirmed the slight increase in narcolepsy risk carried by genetic variants identified by GWAS and justify the use of GRSs to increase the statistical power to identify these associations. The results were consistent with previous studies indicating that the combined effects of these genetic loci had a more sizable influence on narcolepsy risk (28,29). The significant association between GRSs with narcolepsy indicated that disease risk is not only associated with the variants in the HLA region but that SNPs outside the HLA region also play an important role. Our results did not entirely replicate previous studies that emphasized the importance of HLA genes in narcolepsy (10,12,30). This indicates contribution of genetic factors besides those implicated in the dysfunction of the immune system (9,31-33). GRSs constructed without HLA-DQB1*06:02 could be a promising tool for the risk stratification of HLA-DQB1*06:02-negative populations. Among the four GRSs assembled in our study, GRS4 had the best predictive power for narcolepsy risk, followed by GRS3. Since all SNPs included in GRS4 were identified in the Chinese population, the genetic variation underlying narcolepsy may differ across different ethnicities.
The high predictive power of GRS3 constructed from all narcolepsy-associated SNPs indicates that narcolepsy is a polygenic disease involving many common genetic variants of small effect rather than being driven by rare monogenic mutations (34-36). This finding adds further credence to the concept that GRSs are superior to individual variants in identifying those subgroups at a higher risk of narcolepsy that might require earlier intervention and monitoring.
Our study encountered several limitations. First, larger sample sizes will be needed to identify additional narcoleptic genetic factors that remain unknown. As a second limitation, GRSs were validated only in the Chinese population, although narcolepsy-associated loci are deemed similar across ethnicities, informative SNPs for these loci
could vary across ethnicities. In future studies, we will focus on increasing sample sizes to identify additional genetic factors of narcolepsy and on validating GRSs across populations. Moreover, non-genetic factors may contribute to the onset of narcolepsy, and we will thus also explore gene-environment interactions in future studies.
Acknowledgments
We would like to thank all the individuals who provided materials and consent to participate in this study. We thank Prof. Yiqun Wu for advice, Shiying Wang for help with statistics, and all the colleagues who assisted with sample collection.
Funding: National Science Foundation of China (Grant No. 81870996), Research project of central health care special fund (Grant No. W2017BJ52).
Footnote
Conflicts of Interest: The authors have no conflicts of interest to declare.
Ethical Statement: The authors are accountable for all aspects of the work in ensuring that questions related to the accuracy or integrity of any part of the work are appropriately investigated and resolved. Informed consent (in accordance with governing institutions) was obtained from all subjects. The research protocols were approved by the Institutional Review Board on Medical Human Subjects Research at the Peking University People’s Hospital.
References
1. Dauvilliers Y, Arnulf I, Mignot E. Narcolepsy with cataplexy. Lancet 2007;369:499-511.
2. Faraco J, Lin L, Kornum BR, et al. ImmunoChip study implicates antigen presentation to T cells in narcolepsy. PLoS Genet 2013;9:e1003270.
3. Hallmayer J, Faraco J, Lin L, et al. Narcolepsy is strongly associated with the T-cell receptor alpha locus. Nat Genet 2009;41:708-11.
4. Han F, Faraco J, Dong XS, et al. Genome wide analysis of narcolepsy in China implicates novel immune loci and reveals changes in association prior to versus after the 2009
H1N1 influenza pandemic. PLoS Genet 2013;9:e1003880.
6. Toyoda H, Miyagawa T, Koike A, et al. A polymorphism in CCR1/CCR3 is associated with narcolepsy. Brain Behav Immun 2015;49:148-55.
7. Luca G, Haba-Rubio J, Dauvilliers Y, et al. Clinical, polysomnographic and genome-wide association analyses of narcolepsy with cataplexy: a European Narcolepsy Network study. J Sleep Res 2013;22:482-95.
8. Holm A, Lin L, Faraco J, et al. EIF3G is associated with narcolepsy across ethnicities. Eur J Hum Genet 2015;23:1573-80.
9. Miyagawa T, Kawashima M, Nishida N, et al. Variant between CPT1B and CHKB associated with susceptibility to narcolepsy. Nat Genet 2008;40:1324-8.
10. Mignot E, Lin L, Rogers W, et al. Complex HLA-DR and -DQ interactions confer risk of narcolepsy-cataplexy in three ethnic groups. Am J Hum Genet 2001;68:686-99.
11. Han F, Lin L, Schormair B, et al. HLA DQB1*06:02
negative narcolepsy with hypocretin/orexin deficiency.
Sleep 2014;37:1601-8.
12. Yamasaki M, Miyagawa T, Toyoda H, et al. Evaluation of polygenic risks for narcolepsy and essential hypersomnia. J Hum Genet 2016;61:873-8.
13. Bernardini C, Lattanzi W, Bosco P, et al. Genome-wide
gene expression profiling of human narcolepsy. Gene Expr
2012;15:171-81.
14. Tafti M, Hor H, Dauvilliers Y, et al. DQB1 locus alone explains most of the risk and protection in narcolepsy with cataplexy in Europe. Sleep 2014;37:19-25.
15. Hor H, Kutalik Z, Dauvilliers Y, et al. Genome-wide
association study identifies new HLA class II haplotypes
strongly protective against narcolepsy. Nat Genet 2010;42:786-9.
16. Allman R, Dite GS, Hopper JL, et al. SNPs and breast cancer risk prediction for African American and Hispanic women. Breast Cancer Res Treat 2015;154:583-9. 17. Dauriz M, Porneala BC, Guo X, et al. Association of a
62 Variants Type 2 Diabetes Genetic Risk Score With Markers of Subclinical Atherosclerosis: A Transethnic, Multicenter Study. Circ Cardiovasc Genet
2015;8:507-15.
18. French L, Gray C, Leonard G, et al. Early Cannabis Use, Polygenic Risk Score for Schizophrenia and Brain Maturation in Adolescence. JAMA Psychiatry 2015;72:1002-11.
19. Gui L, Wu F, Han X, et al. A multilocus genetic risk score predicts coronary heart disease risk in a Chinese Han
population. Atherosclerosis 2014;237:480-5.
20. Escott-Price V, Shoai M, Pither R, et al. Polygenic score prediction captures nearly all common genetic risk for Alzheimer's disease. Neurobiol Aging 2017;49:214.e7-11. 21. Abelson S, Collord G, Ng SWK, et al. Prediction of acute
myeloid leukaemia risk in healthy individuals. Nature 2018;559:400-4.
22. Han F, Lin L, Li J, et al. TCRA, P2RY11, and CPT1B/ CHKB associations in Chinese narcolepsy. Sleep Med 2012;13:269-72.
23. Shimada M, Miyagawa T, Kawashima M, et al. An approach based on a genome-wide association study reveals candidate loci for narcolepsy. Hum Genet 2010;128:433-41.
24. Johnson AD, Handsaker RE, Pulit SL, et al. SNAP: a
web-based tool for identification and annotation of proxy SNPs
using HapMap. Bioinformatics 2008;24:2938-9.
25. Thebault S, Vincent A, Gringras P. Narcolepsy and H1N1 vaccination: a link? Curr Opin Pulm Med 2013;19:587-93.
26. Liblau RS, Vassalli A, Seifinejad A, et al. Hypocretin
(orexin) biology and the pathophysiology of narcolepsy with cataplexy. Lancet Neurol 2015;14:318-28. 27. Lecendreux M. Pharmacological management of
narcolepsy and cataplexy in pediatric patients. Paediatr Drugs 2014;16:363-72.
28. Kraft P, Hunter DJ. Genetic risk prediction--are we there yet? N Engl J Med 2009;360:1701-3.
29. Qi L, Parast L, Cai T, et al. Genetic susceptibility to coronary heart disease in type 2 diabetes: 3 independent studies. J Am Coll Cardiol 2011;58:2675-82.
30. Capittini C, De Silvestri A, Terzaghi M, et al. Correlation between HLA-DQB1*06:02 and narcolepsy with and without cataplexy: approving a safe and sensitive genetic test in four major ethnic groups. A systematic meta-analysis. Sleep Med 2018;52:150-7.
31. Dauvilliers Y, Neidhart E, Lecendreux M, et al. MAO-A and COMT polymorphisms and gene effects in narcolepsy. Mol Psychiatry 2001;6:367-72.
32. Kernohan KD, Cigana Schenkel L, Huang L, et al.
Identification of a methylation profile for
DNMT1-associated autosomal dominant cerebellar ataxia, deafness, and narcolepsy. Clin Epigenetics 2016;8:91.
33. Moghadam KK, Pizza F, Tonon C, et al.
Med 2014;15:582-5.
34. Gibson G. Rare and common variants: twenty arguments. Nat Rev Genet 2012;13:135-45.
35. Golan D, Lander ES, Rosset S. Measuring missing heritability: inferring the contribution of common variants.
Proc Natl Acad Sci U S A 2014;111:E5272-81. 36. Fuchsberger C, Flannick J, Teslovich TM, et al.
The genetic architecture of type 2 diabetes. Nature 2016;536:41-7.
Cite this article as: Ouyang H, Han F, Zhou Z, Zheng Q,
Table S1 The association of an individual SNP with the risk of narcolepsy
Gene SNP Allele Control, N (%) Case, N (%) P P*
TNFSF4 rs4090391 CC 1,672 (84.7) 749 (83.5) 0.303 0.999
CT 295 (15.0) 142 (15.8)
TT 6 (0.3) 6 (0.7)
C 3,639 (92.2) 1,640 (91.4) 0.324 0.999
T 307 (7.8) 154 (8.6)
MIR-552 rs12026171 AA 1,748 (88.4) 797 (88.4) 0.991 0.999
AG 223 (11.3) 102 (11.4)
GG 6 (0.3) 3 (0.3)
A 3,719 (94.1) 1,696 (94.0) 0.997 0.999
G 235 (5.9) 108 (6.0)
CCR1/CCR3 rs3181077 CC 1,572 (79.5) 741 (82.1) 0.249 0.999
CT 377 (19.1) 152 (16.8)
TT 29 (1.5) 10 (1.1)
C 3,521 (89.0) 1,634 (90.5) 0.101 0.999
T 435 (11.0) 172 (9.5)
BTBD9 rs3923809 AA 708 (36.0) 324 (35.9) 0.384 0.999
AG 946 (48.0) 416 (46.1)
GG 315 (16.0) 162 (18.0)
A 2,362 (60.0) 1,064 (59.0) 0.492 0.999
G 1,576 (40.0) 740 (41.0)
UBXN2B rs6993992 TT 559 (28.3) 253 (28.1) 0.996 0.999
TC 984 (49.8) 448 (49.8)
CC 433 (21.9) 198 (22.0)
T 2,102 (53.2) 954 (53.1) 0.950 0.999
C 1,850 (46.8) 844 (46.9)
A1CF rs16911668 AA 1,532 (77.4) 721 (79.8) 0.096 0.999
AG 411 (20.8) 174 (19.3)
GG 36 (1.8) 8 (0.9)
A 3,475 (87.8) 1,616 (89.5) 0.072 0.999
G 483 (12.2) 190 (10.5)
TEAD4 rs12322530 GG 1,665 (84.3) 736 (81.9) 0.247 0.999
GA 302 (15.3) 157 (17.5)
AA 9 (0.5) 6 (0.7)
G 3,632 (91.9) 1,629 (90.6) 0.112 0.999
A 320 (8.1) 169 (9.4)
CTSH rs12148472 TT 1,804 (91.1) 805 (89.3) 0.342 0.999
TC 173 (8.7) 94 (10.4)
CC 4 (0.2) 2 (0.2)
T 3,781 (95.4) 1,704 (94.6) 0.174 0.999
C 181 (4.6) 98 (5.4)
rs3825932 TT 1,562 (79.0) 727 (80.6) 0.343 0.999
TC 393 (19.9) 169 (18.7)
CC 23 (1.2) 6 (0.7)
T 3,517 (88.9) 1,623 (90.0) 0.245 0.999
C 439 (11.1) 181 (10.0)
NFATC2 rs8119787 AA 789 (39.9) 343 (38.0) 0.487 0.999
AG 916 (46.3) 440 (48.7)
GG 272 (13.8) 120 (13.3)
A 2,494 (63.1) 1,126 (62.3) 0.616 0.999
G 1,460 (36.9) 680 (37.7)
CPT1B-CHKB rs5770911 CC 1,165 (59.0) 535 (59.2) 0.989 0.999
CT 692 (35.0) 314 (34.8)
TT 119 (6.0) 54 (6.0)
C 3,022 (76.5) 1,384 (76.6) 0.917 0.999
T 930 (23.5) 422 (23.4)
DHS rs213026 CC 727 (36.7) 343 (38.0) 0.469 0.999
CT 942 (47.6) 408 (45.2)
TT 311 (15.7) 152 (16.8)
C 2,396 (60.5) 1,094 (60.6) 0.983 0.999
T 1,564 (39.5) 712 (39.4)
rs9444828 CC 540 (27.3) 244 (27.1) 0.932 0.999
CT 988 (50.0) 447 (49.6)
TT 448 (22.7) 210 (23.3)
C 2,068 (52.3) 935 (51.9) 0.778 0.999
T 1,884 (47.7) 867 (48.1)
rs473267 CC 870 (44.0) 401 (44.5) 0.482 0.999
CT 882 (44.6) 385 (42.7)
TT 226 (11.4) 115 (12.8)
C 2,622 (66.3) 1,187 (65.9) 0.785 0.999
T 1,334 (33.7) 615 (34.1)
rs7122887 CC 811 (41.0) 378 (41.9) 0.878 0.999
CT 909 (46.0) 412 (45.6)
TT 258 (13.0) 113 (12.5)
C 2,531 (64.0) 1,168 (64.7) 0.631 0.999
T 1,425 (36.0) 638 (35.3)
rs524513 CC 1,679 (84.9) 750 (83.1) 0.123 0.999
CT 285 (14.4) 139 (15.4)
TT 14 (0.7) 13 (1.4)
C 3,643 (92.1) 1,639 (90.9) 0.128 0.999
T 313 (7.9) 165 (9.1)
rs169160 TT 795 (40.3) 372 (41.4) 0.723 0.999
TC 908 (46.0) 412 (45.9)
CC 270 (13.7) 114 (12.7)
T 2,498 (63.3) 1,156 (64.4) 0.456 0.999
C 1,448 (36.7) 640 (35.6)