DOI: http://dx.doi.org/10.26483/ijarcs.v8i8.4638
Volume 8, No. 8, September-October 2017
International Journal of Advanced Research in Computer Science
RESEARCH PAPER
Available Online at www.ijarcs.info
ISSN No. 0976-5697
AN ENERGY EFFICIENT WIRELESS BODY AREA NETWORK USING GENETIC
ALGORITHM
Harpreet Kaur
Student M. Tech (E.C.E)Himachal Pradesh,India
Abstract: In the proposed work, the main concern is to reduce the energy consumption while the node is in their working condition that is when the actual data transmission will take place. Other factor that we have considered is duty cycle. It is the time taken by the sensor nodes that operates irregularly rather than continuously. When the transmission distance is very small as compared to the threshold distance, duty cycle is very high and thus, there is no ideal time to recover charge for battery and hence, battery recovery effect is not considered. With the help of WBAN, the patient can be observed from remote station and the collected information by the bio sensor nodes attached to the patient will be transferred by using any wireless mean like LAN, WAN, Bluetooth, radio signal or electromagnetic waves. Also the collected information will be saved in the data base for future use. In the proposed work, we are designing a network area having length and width of size 1000×1000 along with 50 numbers of sensor nodes for different transmission distance changes from 50 -7500 for different bit rate. All the simulation process will be carried out in MATLAB environment and the performance parameters like Duty cycle, Energy consumption with baseline, offline and recovery algorithm will be measured along with optimization algorithm named as Genetic algorithm.
Keywords: Wireless body area network (WBAN), genetic algorithm, Duty cycle, Energy efficiency and MATLAB
1. INTRODUCTION
WBAN is a wireless network which is used in wearable computing devices. It can be either embedded inside the body or can be surface mounted on fixed position wearable technology. One can carry these devices along with them like in bags, in pockets, By hand etc [1].
A Wireless Body Area Network (WBAN) links the independent nodes (e.g. sensors and actuators) that are placed in the clothes, on the body or under the skin of a person. The network becomes more extensible over the
human body and each node is connected by using a wireless communication channel [2].
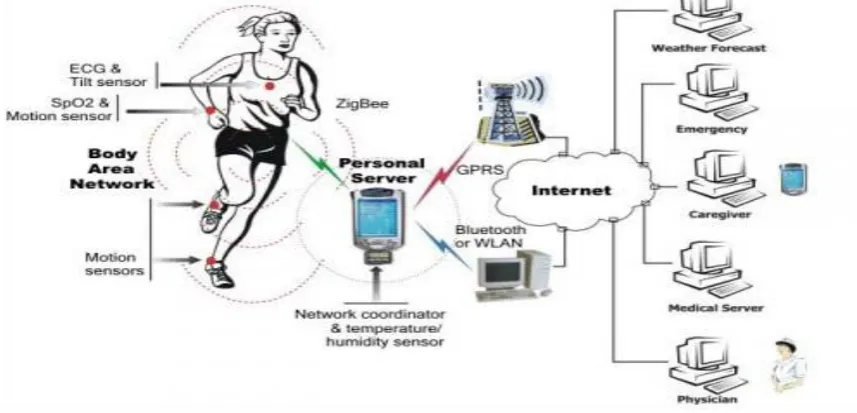
[image:1.595.83.512.492.698.2]To measure different kinds of physiological parameters like Electrocardiogram (ECG), pulse rate, blood pressure and body temperature etc. biosensors are implanted or positioned on the human body surface [3]. The network formed by these bio sensors is known as wireless body area network (WBAN). The bio sensors collect the data from the human body and send that data to remote place with the help of radio signal [3]. The architecture of WBAN is shown in figure below:
Figure 1: WBAN Architecture
As the nodes implanted on the body makes direct contact to the network. Therefore the effect of energy consumption of human body on system should be analyzed differently.The wireless body area networks promise to revolutionize health monitoring. However, designers of such systems face a
number of challenging tasks, as they need to address often quite conflicting requirements for size, operating time, precision, and reliability[4].
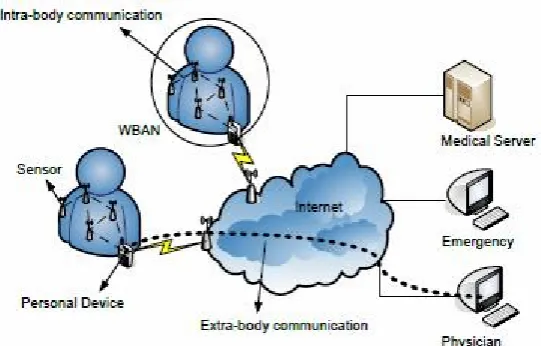
The communication in WBAN is divided into two types named as [5]:
i. Intra-body communication ii. Extra-body communication
In Intra-body communication, the information handling on the body of the patient is control between the sensors or actuators and personal devices [5].
[image:2.595.174.445.126.299.2]In Extra-body communication, the communication between the personal devices like cell phone, laptop etc. and an external network is possible.
Figure 2: Intra-body and Extra body communication
It has been seen that the performance of the system depends on the distance as well as the energy not only the distance between node and the other node and the residual energy but also on the packet size or number of packets that can be transferred to the to the sink this can be added with the existing algorithm to enhance the performance of the system.Since almost in all sensor networks data are routed towards a single sink (gateway), hops close to that sink become heavily involved in packet forwarding and thus their batteries get depleted rather quickly [6].So there is need to update the existing systems.Therefore, in this research, novel threshold distance using genetic algorithm to enhance energy efficient WBAN has been developed.Genetic Algorithm (GA) was chosen to perform the optimization since it has proven to work well with non-linear objectives [7].The performance of the proposed technique is evaluated by using energy consumption, transmission time and duty cycle.
2. RELATED WORK
Chenfu Yi [16] has defined Energy efficiency is a key concern for wireless sensor nodes, especially for wireless body area network (WBAN) in which sensors operate in close vicinity to, on or even inside a human body. In the paper, they first presented a system-level energy consumption model associated with transmission distance d and transmission data rate over on-body wireless communication link. S. Ahmed [17] has defined the role of the wireless body network (WBN) and its growth in health service facilities. WBN also helps to improve the human health. By conducting a comprehensive survey, it is estimated that Virtual Doctor Server is existed in WBAN architecture.LamiaChaariFourati [18]proposed Body Area Network (BAN) being used in medical health care systems. Base of the various applications that are developed in BAN is WSN (Wireless Sensor Network) technology.Ramli, S.N. [19]has described wireless communication technologies and sensors that are developing gradually and empowering development of Wireless Body Area Network
(WBAN). The reason behind using wireless technologies are new, practical and inventive ideas offers by variety of sensors that helps to improve health monitoring and other health care applications system. C Li [20] has described wireless body area network with great impact on our daily life. As the time passes, it has become a vital part of our life. WBAN also gives the solution to the chronic illness as well as the patients that are suffering from constant and long term pain. Emmanuel Davies [21]has focused on the most emerging technology of today that is Wireless Body Area Networks with its applications in various fields. WBANs are applicable in various healthcare services and providing medicine to reduce the requirement of caregivers. WBAN’s helps the elder and ill people to live their life independently.SapnaSingla et al [22]has explained the concept of wireless body area network as the most trending area of research. Due to its benefits, it has been used in several applications. Medical and non-therapeutic applications have developed the interest of using WBAN.
Pervez Khan et al [23]has used wireless sensor network IEEE 802.15.6 for short range and extremely low power communication. It is a new standard for wireless body area network with high data rates which can access the data in vicinity of, or inside a human body.Xin Qi et al [24] has discussed wireless body area network as an emerging field these days which provides solution to the mobile health i.e. m-health. Basically, WBAN is used to collect data from in-body or around in-body sensors nodes.
3. SIMULATION MODEL
In this research, we have presented wireless body area network using genetic algorithm to minimize the energy consumption. The most important advantage of the GA is their ability to use accumulative information about the initial unknown search space in order to move the next searches in to useful spaces [8].
person. A WBAN offers many promising, new applications in home/health care, medicine, sports, multimedia, and many other areas [9].
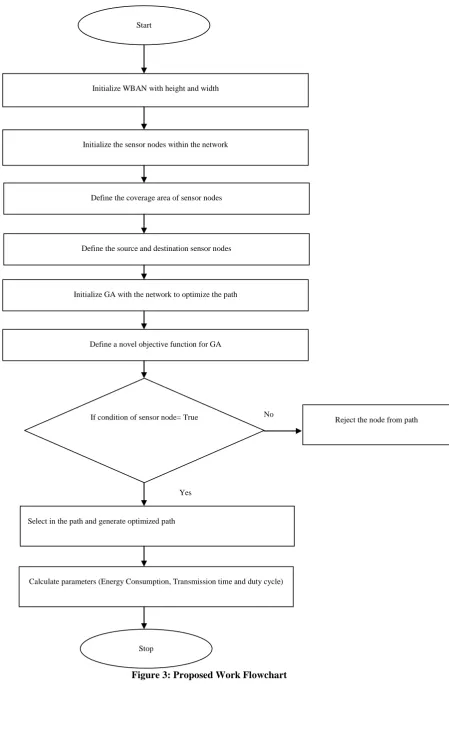
To design and develop the proposed work, below steps has been followed:
Step 1: Initialization of the Wireless body area network with height and width (1000*1000) is the primary step.
Step2: The initialization of sensor nodes within the simulated network is taken place afterwards.
Step 3: The coverage area of sensor nodes are defined within the simulated network.
Step 4: The nodes of source and destination are described. Step 5: Path from source and destination sensor nodes are discovered in the network.
Step 6: The optimization algorithm that is genetic is initialized within the network to optimize the path.
Step 7: Then, the novel objective function of genetic algorithm is defined.
Step 8: Optimization of path within the network is taken place using genetic algorithm
Step 9: Calculate the parameters namely, energy consumption, transmission time and duty cycle.
WBAN systems can capitalize on recent technological advances that have enabled new methods for studying human activity and motion, making extended activity analysis more feasible[10].
The performance parameters that have been measured are listed below:
i. Duty Cycle
A biosensors implanted on the human body will operate like as a duty cycle mode., duty cycle is the main parameter for energy consumption comparison of the different MAC protocols, since it is minimally dependent on the transceiver used [11].The figure is shown below:
Here, the active mode will be observed before the collected ata have been transmitted to the remote station And is denoted as Tac that is known as active mode and Tsc is know as sleep mode.Since,the main aim of MAC protocol design is to reduce energy consumption, while supporting good scalability and collision avoidance. This protocol tries to reduce energy consumption from all the sources that we have identified to cause energy waste, i.e., idle listening, collision, overhearing and control overhead [12]. In the active mode of the biosensors, the raw information is passed to the filteration and amplification process. After that the signal is modelated using some modulation techniques and then transmitted to eCPU through the wireless network.
After the transmission of the information the biosensors would go to its SLEEP mode having duration Tsl. In the duty cycles mainly three steps are considered named as Active mode, Sleep mode and Transient mode.
The overall magnitude of the transient mode is smaller than the Active mode.
This is the time occupied by the cycle of operation of a simulator.The sensor node influences the system’s power consumption by changing its duty cycle [13]. Particularly, it is defined in the form of percentage time or in the form of ratio. It is the proportion of time by which a transmission is done.
ii. Energy Consumption
Energy consumption is the defined as the total amount of energy being consumed by each node in WBAN at different network layers. It is obtained by energy consumed summation in every operation mode during simulation time. It is defined mathematically as below:
It is the count of total energy which is elapsed during the transmission of packet data from one sensor to another sensor node. The unit of energy consumption is Joule (J)/Kilojoules (KJ).It is defined as the capacity of simulator to perform packet transmission from source sensor node to destination sensor node.The energy consumption model characterizes the sources of energy consumption in the network[14].In simulation work, energy exists in different forms like transmission energy, receiving energy and operating energy. So, it can be said that in the proposed work, the energy consumption is the summation of all energies.
iii.Transmission Time
Figure 3: Proposed Work Flowchart
Start
Initialize WBAN with height and width
Initialize the sensor nodes within the network
Define the coverage area of sensor nodes
Define the source and destination sensor nodes
Initialize GA with the network to optimize the path
Define a novel objective function for GA
If condition of sensor node= True Reject the node from path
Select in the path and generate optimized path
Calculate parameters (Energy Consumption, Transmission time and duty cycle)
Stop
No
4. SIMULATION RESULTS
This section describes the simulation of the proposed work. Following results are defining the designing and
[image:5.595.121.486.121.287.2]development of the simulator, evaluation of the performance of three different schemes and implementation of duty cycle for different transmission distance.
Figure 4: Simulator
A network has been designed and developed for the simulation of proposed work for wireless body area network using genetic algorithm. X-axis is defining the width of the network and Y-axis is defining the height of the network. In
the above figure, 50 sensor nodes are deployed. Within the 50 sensor nodes, the source and destination are defined and the path is generated from source and destination node using genetic algorithm.
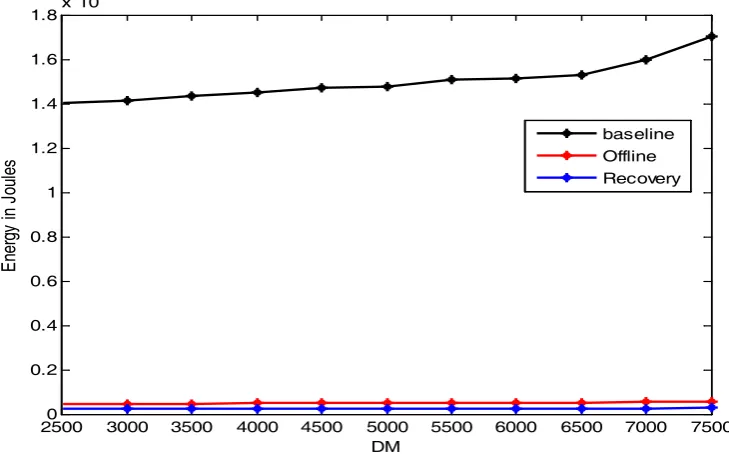
Figure 5: Performance of energy consumption for three transmission schemes
Above figure is describing the graph of energy comparison for three schemes, namely, baseline method, local offline algorithm and recovery related to battery awareness for energy efficiency that shows the performance of the proposed work. Offline is defining the simulated results by utilizing the local offline algorithm, baseline is for the transmission of the data packets that are transmitted after the arrival, whereas, recovery is used for defining the battery characteristics. In the above figure, the energy consumption
in the baseline scheme is more as compare to recovery and offline schemes. The recovery scheme has less consumption than the two other mentioned schemes. In the figure above black line represent the consumed energy value in case of baseline method. Red line and blue line represent the energy consumed values in case of offline and recovery schemes respectively. The values obtained are shown in tabular form below:
0 100 200 300 400 500 600 700 800 900 1000
0 100 200 300 400 500 600 700 800 900 1000
N1A N2A N3S
N4A N5A N6A N7A N8A N9A N10A N11S N12A N13A N14A N15S N16A N17A N18A N19A N20A N21A N22A N23S N24A N25S N26A N27S N28A N29A N30A N31A N32A N33S N34A N35A N36A N37S N38A N39S N40A N41S N42A N43A N44A N45A N46A N47A N48A N49S N50A
25000 3000 3500 4000 4500 5000 5500 6000 6500 7000 7500
0.2 0.4 0.6 0.8 1 1.2 1.4 1.6 1.8x 10
[image:5.595.111.476.371.598.2]Table 1: Energy consumed for three different schemes
Distance (m) Energy
consumption in Baseline Scheme
Energy consumption in Offline Scheme
Energy consumption in Recovery Scheme
Average values (J)
2500 1.4 .05 .04
1.52,.09, .072
3000 1.45 .05 .04
3500 1.46 .06 .06
4000 1.47 .07 .06
4500 1.49 .08 .07
5000 1.5 .09 .08
5500 1.57 .1 .09
6000 1.58 .11 .1
6500 1.59 .12 .11
7000 1.6 .13 .012
7500 1.7 .14 .13
Figure 6: Duty cycle over the different transmission distance
Above figure represents the duty cycle with respect to DM (Different transmission distance).The X-axis donates the different transmission distance and Y-axis is defining duty cycle. The average value of duty cycle w.r.t DM (Different transmission distance) is near about 0.48.As shown in the
[image:6.595.55.540.600.753.2]figure above as the transmission distance increases the duty cycle also increases that represents that the ideal time become shorter . This indicates that the total energy consumption by the sensor nodes is smaller or we can say that energy consumption become constant.
Table 2: Duty cycle values over the transmission distance
Transmission distance Duty cycle Average duty cycle
2500 0.45
0.48
3000 0.456
3500 0.5
4000 0.52
4500 0.49
5000 0.48
5500 0.45
6000 0.49
6500 0.48
7000 0.5
7500 0.55
2500 3000 3500 4000 4500 5000 5500 6000 6500 7000 7500 0
0.1 0.2 0.3 0.4 0.5 0.6 0.7
DM
Du
ty
C
yc
Figure 7: Energy consumption with r and d.
In the figure above r represent the transmission data rate in bits per second and ‘d’ represent the transmission distance. The above graph will represent the energy consumed by the nodes during different transmission distance ‘d’ w.r.t transmission data rate ‘r’. In the figure above, we concluded that as the transmission distance increases the energy consumed by each node also get increase. For distance d=50, energy consumption is very small which is near about
0 whereas for distance d=2500 the maximum energy consumed is 4.25×10⁻⁸ J when the bit rate is 10×10-7bps. When we compare it with the base paper for d=2500mm the maximum energy consumed is 8×10⁻⁸ J for bit data rate 10×10-7bps. For distance d=50mm the maximum energy consumed by the node is 4.25×10⁻⁸ J for bit data rate of 6.5×10⁻⁷bps.Hence it is concluded that the proposed result is better that the existing work.
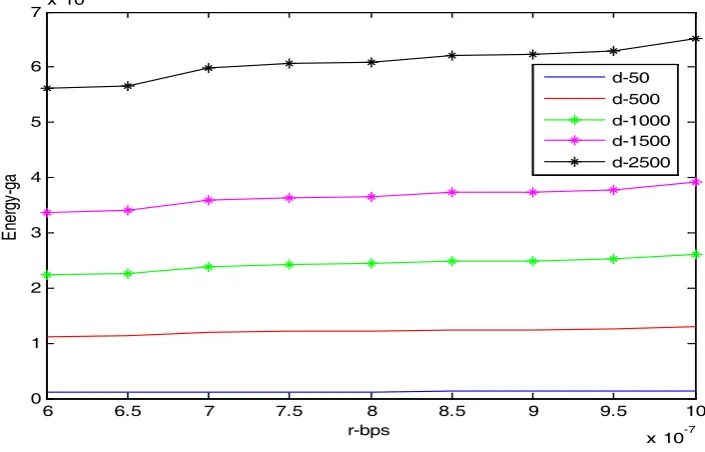
Figure 8: Energy consumption along with GA with respect to r and d
The reduction to the energy consumption by the sensor nodes is decreased by applying optimization algorithm known as Genetic algorithm. The above graph obtained when we apply GA to the proposed work. The energy consumed will be increase as the transmission distance of
the travelling data get increased. For distance d=50 the energy consumption is approximately equal to 0. For distance d=2500 the maximum energy consumption is 6.5 ×10⁻⁹J.which less as compared to the value obtained without any optimization algorithm.
6 6.5 7 7.5 8 8.5 9 9.5 10
x 10-7 0
0.5 1 1.5 2 2.5 3 3.5 4
4.5x 10
-8
r-bps
Ener
gy
d-50 d-500 d-1000 d-1500 d-2500
6 6.5 7 7.5 8 8.5 9 9.5 10
x 10-7 0
1 2 3 4 5 6 7x 10
-9
r-bps
Ener
gy
-ga
[image:7.595.119.472.402.628.2]Figure 9: Energy Comparison with modulation level
Above figure shows the comparison of energy with respect to the modulation level. In the above figure, modulation level is b for d = 50mm and the there are three lines which represent the energy. The blue colorline graph represents the
energy of circuit, cyan color line graph denote the transmission energy and the red color line graph represents the total energy of simulation for modulation level b.
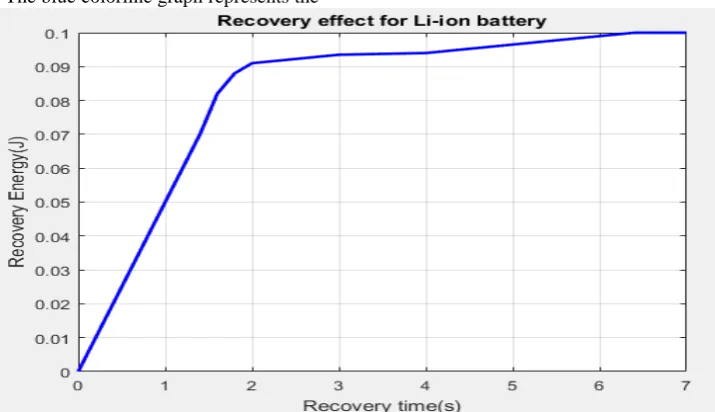
Figure 10: Recovery effect for Li-on battery
Above figure shows the recovery effect for the Li-ion battery and in the graph the x axis denotes the recovery time in seconds and y axis denotes the recovery energy in Joule. From the above graph, we have observed that the recovery energy is directly proportional to the recovery time and varies according to the recovery time.
5. CONCLUSION
In this research work, we have proposed a scheme along with a energy consumption model with different transmission distance and transmission data rate in bps. The whole system has been designed for a wireless body area network that finds application in health care. WBAN is a network in which sensors are powered by limited energy batteries and thus, energy consumption becomes an important factor. In the proposed work, we have considered three different schemes named as baseline, offline and recovery schemes and then find the energy consumption for every scheme. It is being concluded that for recovery scheme, the energy consumption is less than the offline and
baseline. The maximum energy is being consumed for the baseline method this is because in this scheme no optimization algorithm has been used and the collected data is being transmitted immediately as it arrives to the node and delay is zero. Thus, the simulated value has shown that the energy consumption is reduced by77.4% which is batter as compare to the existing work. In existing work, the reduction in energy consumption is done by using optimization scheme that is come out to be 59.77%. Here, for optimization Genetic algorithm has been used. The simulation is carried out in MATLAB simulator having a WBAN of size length and breadth=1000×1000 for 50 number of nodes.
REFERENCES
[1] Yick, Jennifer, Biswanath Mukherjee, and DipakGhosal,, “Wireless sensor network survey”, Computer networks, Vol.52, No. 12, pp. 2292-2330,2008.
[image:8.595.120.478.310.516.2][3] Bulusu, Nirupama, and Sanjay Jha, “Wireless Sensor Network Systems: A Systems Perspective (Artech House Mems and Sensors Library)”, Artech House, Norwood, MA , 2005. [4] Otto, Chris, et al. "System architecture of a wireless body area
sensor network for ubiquitous health monitoring." Journal of mobile multimedia 1.4 (2006): 307-326.
[5] Latré, Benoît, et al. "A survey on wireless body area networks." Wireless Networks 17.1 (2011): 1-18.
[6] Akkaya, Kemal, Mohamed Younis, and MeenakshiBangad. "Sink repositioning for enhanced performance in wireless sensor networks." Computer Networks 49.4 (2005): 512-534. [7] Jourdan, Damien B., and Olivier L. de Weck. "Layout
optimization for a wireless sensor network using a multi-objective genetic algorithm." Vehicular technology conference, 2004. VTC 2004-Spring. 2004 IEEE 59th. Vol. 5. IEEE, 2004.
[8] Azadeh, Ali, et al. "Integration of artificial neural networks and genetic algorithm to predict electrical energy consumption." Applied Mathematics and Computation 186.2 (2007): 1731-1741.
[9] Reusens, Elisabeth, et al. "Characterization of on-body communication channel and energy efficient topology design for wireless body area networks." IEEE Transactions on Information Technology in Biomedicine 13.6 (2009): 933-945.
[10] Jovanov, Emil, et al. "A wireless body area network of intelligent motion sensors for computer assisted physical rehabilitation." Journal of NeuroEngineering and rehabilitation 2.1 (2005): 6.
[11] Marinkovic, StevanJovica, et al. "Energy-efficient low duty cycle MAC protocol for wireless body area networks." IEEE Transactions on Information Technology in Biomedicine 13.6 (2009): 915-925.
[12] Ye, Wei, John Heidemann, and Deborah Estrin. "An energy-efficient MAC protocol for wireless sensor networks." INFOCOM 2002. Twenty-First Annual Joint Conference of the IEEE Computer and Communications Societies. Proceedings. IEEE. Vol. 3. IEEE, 2002.
[13] Jiang, Xiaofan, Joseph Polastre, and David Culler. "Perpetual environmentally powered sensor networks." Proceedings of
the 4th international symposium on Information processing in sensor networks. IEEE Press, 2005.
[14] Chen, Yunxia, and Qing Zhao. "On the lifetime of wireless sensor networks." IEEE Communications letters 9.11 (2005): 976-978.
[15] Montestruque, Luis Antonio, and PanosAntsaklis. "Stability of model-based networked control systems with time-varying transmission times." IEEE Transactions on Automatic Control 49.9 (2004): 1562-1572.
[16] Chenfu Yi et. Al, “Energy Efficient Transmission Approach for WBAN Based on Threshold Distance”, IEEE sensors journal, Vol. 15, No. 9, pp 5133-5141, Sep 2015
[17] S.Ahmed et al.,”LAEEBA: Link Aware and Energy Efficient Scheme for Body Area Networks”, IEEE, pp.435-440, May 2014.
[18] LamiaChaariFourati , “Wireless Body Area Network and Healthcare Monitoring System”,
[19] Ramli, S.N, “Surveying the Wireless Body Area Network in the realm of wireless communication”, IEEE, pp.58 – 61, 2011
[20] C. Li et al, “Performance Evaluation of IEEE 802.15.4 for Wireless Body Area Network (WBAN)”, IEEE, pp.1 – 5, 2009.
[21] Emmanuel Davies, “A Survey on Wireless Body Area Network”, International Journal of Scientific and Research Publications, Vol 4, Issue 3,Pp 1-7, 2014
[22] SapnaSingla et al, “A Review Paper on Wireless Body Area Network for Health Care Applications”, IJCSMC, Vol. 5, Issue. 10, pp.1 – 11, October 2016,
[23] Pervez Khan et al, “Performance Analysis of WBAN MAC Protocol under Different Access Periods”, International Journal of Distributed Sensor Networks, Vol. 11, no. 10,2015 .