Volume 3, No. 2, March-April 2012
International Journal of Advanced Research in Computer Science
RESEARCH PAPER
Available Online at www.ijarcs.info
ISSN No. 0976-5697
Developing an Association Rule Based Method to Support Medical Image Diagnosis
with Efficiency
V.Umarani Assistant Professor,
Sri Ramakrishna College of Arts and Science for women, Coimbatore, India.
S.Pavithra* Research scholar,
Sri Ramakrishna College of Arts and Science for women, Coimbatore, India.
Abstract: Data mining in brain imaging is an emerging field of high importance for providing prognosis, treatment, and a deeper understanding of how the brain functions. The discovery of associations between human brain structures and functions (i.e. human brain mapping) has been recognized as the main goal of the Human Brain Project. The field of data mining addresses the question of how best to use the data to discover new knowledge and improve the process of decision making. The extensive amounts of knowledge and data stored in medical databases require the development of specialized tools for storing and accessing of data, data analysis and effective use of stored knowledge of data. Association Rules Technique help in analyzing and retrieving hidden patterns for a large volume of data collected in a medical database for a large hospital. This paper proposes a method based on association rule-mining to enhance the diagnosis of medical images (brain). It combines low level features automatically extracted from images and high-level knowledge from specialists to search for patterns. The method proposed makes use of association rule mining technique to classify the CT scan brain images into three categories namely normal, benign and malign. The experimental result on prediagnosed database of brain images showed 97% sensitivity and 95% accuracy respectively. The physicians can make use of this accurate result in order to classify the brain images into normal, benign and malignant for effective medical diagnosis.
Keywords: Data Mining; Association Rule Mining; Histogram Equalization; Classification.
I. INTRODUCTION
Modern hospitals are well equipped with monitoring and other data collection devices, which provide relatively inexpensive means to collect and store the data in hospital information systems. Extensive amounts of data gathered in medical databases require specialized tools for storing and accessing data, data analysis, and effective use of data [1]. The increase in data volume causes great difficulties in extracting useful information for decision. In health care centers and hospitals, millions of medical images have been generated daily and the analyses have been done manually with an increasing number of images, after analyzing a minimal number of images the radiologist becomes more tiresome.
Medical Imaging is the technique and process used to create images of the human body for clinical purpose [2]. The increasing use of image exams in the last 25 years has greatly contributed to improve the diagnosing of diseases as well as to enhance the health care of patients. However, the volume of images has grown at a fast pace and the specialists have been unable to keep up with diagnosing. Brian Images are the most difficult medical images to be read due to their contrast and differences in the type of tissues. Brain Tumor is one of the major causes leading to higher incidence of death in human [3]. Physicians have faced a challenging task in extracting the features and decision making. Cancer begins in cells, normally cells grow and divide to form new cells as the body needs them when cells grow old they die and new cells take their place, sometimes this orderly process goes wrong that is the old cell do not die and it does not allow the new cell to take place in such cases tumor may be formed.
The famous method used recently for the screening procedure from the patients includes CT-Scan (Computerized Tomography Scan) brain images [4]. From
the CT-Scan brain images the radiologist will be able to diagnose the abnormalities in the tissues. The Computerized Tomography (CT) has been found to be the most reliable method for early detection of tumors because this modality is the most used in radiotherapy planning for two main reasons. The first reason is that scanner images contain anatomical information which offers the possibility to plan the direction and the entry points of the radiotherapy rays which have to target the tumor and to avoid some risk organs. The second reason is that CT scan images are obtained using rays, which is the same physical principle as radiotherapy. This is very important because the radiotherapy rays intensity can be computed from the scanner image intensities. Due to the high volume of CT [5] images to be used by the physicians; the accuracy of decision making tends to decrease.
A. Association Rule Mining:
Data mining commonly encompasses a variety of algorithms namely clustering, classification, association rule mining and more. Among these algorithms, Association Rule Mining (ARM) is one of the most important and well researched data mining techniques [6]. Since it’s introduced in 1993 by Agrawal et al, the task of association rule mining has received a great deal of attention.
The method proposed in this paper classifies the brain CT scan images into three categories: normal, benign and malignant. Normal ones are those characterizing a healthy patient, Benign cases represents CT scan brain images showing a tumor that are not formed by cancerous cells, and Malign cases are those brain images that are taken from patients with cancerous tumors.
a. Background Study:
The problem of mining association rules, as it was first stated, involves finding rules that satisfy the restrictions of minimum support and minimum confidence specified by the user. Mining image content demands extraction of the main image features regarding a specific criterion. Image processing algorithms are used to extract such relevant features from the images, organizing them in feature vectors. The feature vectors [9] are then employed in place of the images to model them as transactions, which are then used in the mining process. Features quantify intrinsic visual characteristics of the images, such as color, shape and texture, leading to vectors with hundreds or even thousands of elements. Contrary to what one would think, having a large number of features can be a problem. An increasing number of features (and consequently the dimensionality of the data) leads to losing the significance of each feature. Thus, to avoid decreasing the discrimination accuracy, keeping the number of features as low as possible is important, and this establishes a tradeoff between the discrimination power and the feature vector size.
The most representative features vary according to the image domain. The histogram is a feature that is generally used to represent the color distribution of an image, but it gives a very poor identification of breast lesions. Features of shape are usually employed to differentiate malignant and benign lesions. However, most shape features demand a previous step of tissue segmentation, and this increases the computational effort to a great extent. Indeed, an efficient and automatic process of segmentation is still a challenging issue.
Brian Images are the most difficult medical images to be read due to their contrast and differences in the type of tissues [10]. Brain Tumor is one of the major causes leading to higher incidence of death in human. Physicians have faced a challenging task in extracting the features and decision making. CT scan brain images are among the most difficult medical images to be read due to their low contrast and differences in the type of tissues. However, the volume of images has grown at a fast pace and the specialists have been unable to keep up with diagnosing. Texture describes properties of smoothness, roughness and regularity. Texture information is characterized by the spatial arrangement of pixel intensities [11].
b. Related Works:
M.Madheswaran et al [12], reviews and proposed health care centers and hospitals, millions of medical images have been generated daily. Analyses have been done manually with an increasing number of images. Even after analyzing a minimal number of images, radiologist becomes more tiresome. Nowadays, physicians are providing with computational techniques in assisting the diagnosis process.
S.R. Daniela et al [5], proposed Computerized Tomography (CT) has been found to be the most reliable method for early detection of tumors because this modality
is the most used in radiotherapy planning for two main reasons. The first reason is that scanner images contain anatomical information which offers the possibility to plan the direction and the entry points of the radiotherapy rays which have to target the tumor and to avoid some risk organs. The second reason is that CT scan images are obtained using rays, which is the same physical principle as radiotherapy. Due to the high volume of CT images to be used by the physicians, the accuracy of decision making tends to decrease.
C. Ordonez et al [13], proposed image mining concepts it mainly deals with the implicit knowledge extraction, image data relationship and other patterns which are not explicitly stored in the images. This technique is an extension of data mining to image domain. It is an inter disciplinary field that combines techniques like computer vision, image processing, data mining, machine learning, data base and artificial intelligence. Mining has been done based on the combined collections of images and it is associated data. The essential component in image mining is the identification of similar objects in different images.
J.B.W. Pluim et al [1] reviews and proposed prime objective of the preprocessing is to improve the image data quality by suppressing undesired distortions (or) enhancing the required image features for further processing. The irrelevant data present in the image has been eliminated using the pre-processing technique. The pre-processing technique eliminates the incomplete, noisy and inconsistent data from the image in the training and test phase. In order to improve the quality of images taken from the CT-scan brain images and to make the feature extraction phase more reliable, pre-processing is necessary.
R. Abraham et al [14] proposed Feature Extraction it is a part of image processing, and it is a special form of dimensionality reduction. As the tissues present in brain are difficult to classify using shape or intensity level of information, the texture feature extraction is found to be very important for further classification. Feature Vector is an n-dimensional vector of numerical features that specifies of the numerical representation of objects. From the co-occurrence matrices the feature vectors can be calculated and stored in the transaction database.
X.R. Marcela et al [15] proposed Pre-processing Solution for Association rule Generation is a novel supervised algorithm that performs discretization of the continuous values of the features. The PreSAGe algorithm combines, in a single step, feature selection and discretization, and reduces the mining complexity. Experiments performed on PreSAGe show that this algorithm is highly suitable to perform feature selection and discretization in medical images.
II. PROBLEM DESCRIPTION
The proposed system consists of, two phases they are: 1. Training Phase and 2. Testing Phase [12]. In the training phase the images from the CT scan are pre processed. In the training phase the images from the CT scan are pre processed and feature has been extracted from the images and the Apriori algorithm and MARI algorithm has been applied to find the support and confidence. The transaction representations of all the images in the training set are submitted to Apriori algorithm, limiting the minimum confidence to high values.
In the test phase, the feature vector obtained from the test images are submitted to the classifier which makes use of the association rules to generate keywords to compose the diagnosis of the test image. These keywords have been used to classify the three categories of CT scan brain images as normal image, benign (tumor without cancerous tissues) image and malignant (tumor with cancerous tissues) image.
A. Histogram Equalization:
The prime objective of the Histogram Equalization is to improve the image data quality by suppressing undesired distortions (or) enhancing the required image features for further processing. The irrelevant data present in the image has been eliminated using the histogram equalization technique [17]. The Histogram Equalization technique eliminates the incomplete, noisy and inconsistent data from the image in the training and test phase. In order to improve the quality of images taken from the CT-scan brain images and to make the feature extraction phase more reliable, histogram equalization is necessary. In general, most of the soft tissues have overlapping gray-levels and the condition of illumination at that time of CT scan taken is also different. The histogram equalization can be used to enhance the contrast within the soft tissue of the brain images and
also hybrid median filtering technique can be used to improve the image quality. Good texture feature extraction can be done by increasing the dynamic range of gray-levels using the above mentioned technique [18].
B. Feature Extraction & Feature Vector:
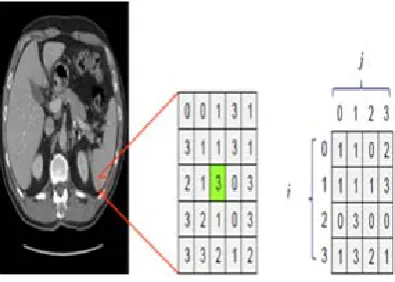
Feature Extraction is a part of image processing, and it is a special form of dimensionality reduction. After preprocessing, feature extraction has been done to remove the irrelevant and redundant content of the information present in the input image [9]. Haralick Co-occurrence method has been used to determine the discrimination of the tissue level variations. As the tissues present in brain are difficult to classify using shape or intensity level of information, the texture feature extraction is found to be very important for further classification. The features extracted from images and organized into feature vectors. To perform the extraction, a co-occurrence matrix of the analyzed image is generated. Co-occurrence matrices can be calculated for the directions 0º, 45º, 90º, 135º and their respective pixels are denoted as 1, 2, 3, 4 and 5. Twenty matrices of 16*16 integer elements per image are produced.
As a statistical method for texture extraction [18], co-occurrence matrices focus on the distribution and the relationships among the gray levels in an image. The general idea of a co-occurrence matrix is to represent an image's texture characteristics by counting pixel intensity pairs, using a matrix that keeps track of all the pixel-pair counts. The normalized co-occurrence matrix is denoted by Pij(d,θ) where dis the displacement vector, θ is the angle, and i and j
represent the gray-levels in the vertical direction (along the rows) and horizontal direction (along the columns), respectively.
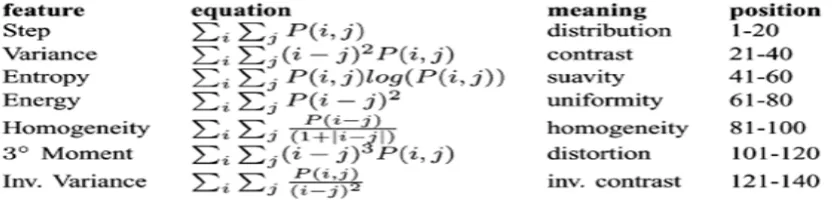
Once the co-occurrence matrices are calculated, seven Haralick texture descriptors (step, variance, entropy, energy, homogeneity, 3º moment and inverse variance) are
computed. For each matrix, the seven features presented in Table I are calculated, producing a feature vector of 140 elements to represent each image. Robert Haralick has made a series of contributions in the field of computer vision [9]. In the high-level vision area, he has worked on inferring 3D geometry from one or more perspective projection views. Haralick has worked in image texture analysis using spatial gray tone co-occurrence texture features. These features have been used with success on biological cell images, x-ray images, satellite images, aerial images and many other kinds of images taken at small and large scales. Brief definitions for each texture descriptor are provided in Table 1.1.
Table 1.1 Gray-Level Texture Features And Their Positions In The Feature Vector
C. PreSAGe(Pre-processing Solution for Association
rule Generation):
Pre-processing Solution for Association rule Generation is a novel supervised algorithm that performs discretization of the continuous values of the features. The PreSAGe algorithm combines, in a single step, feature selection and discretization, and reduces the mining complexity. Experiments performed on PreSAGe show that this algorithm is highly suitable to perform feature selection and discretization in medical images.
KEYWORDS: Class, Cut Points, Majority Class
THRESHOLD: Minperint, Mintofuse
i. KEYWORDS:
a) CLASS b) CUT POINTS c) MAJORITY CLASS
a) CLASS: Class is the most important keyword of a
diagnosis given by a specialist.
b) CUT POINTS: Cut points are the limits of an interval
of values.
c) MAJORITY CLASS: Majority Class is the most
frequent class of an interval.
ii. THRESHOLD:
a)MINPERINT b)MINTOFUSE
a) MINPERINT:
Minperint restricts the minimal number of occurrences of the majority class allowed in an interval.
b) MINTOFUSE:
Restricts the minimum occupancy of the majority class in an interval.
iii. CONDITIONS:
a) Condition1 b) Condition 2 c) Condition 3
a) CONDITION 1:
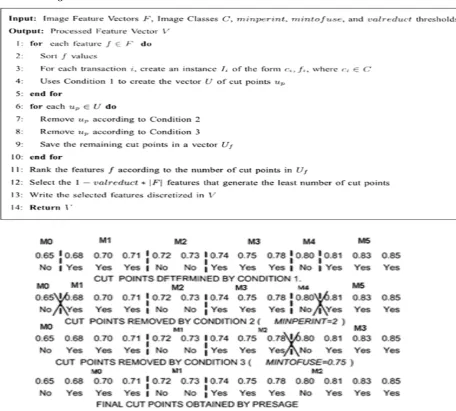
Condition 1 generates too many cut points, especially when working with noisy data. The larger the number of cut points the larger the number of intervals. Each interval represents an item in the process of mining association rules. The next two conditions are used to remove unnecessary cut points.
b) CONDITION 2:
The number of occurrences of the majority class in an interval must be equal or greater than the minperint threshold, i.e., |Mk| ≥ minperi nt. If the occurrence of the majority class is less than the minperint means the cut points will be restricted. In the above example minperint=2, the support of the Majority Class (M0, M4) are less than value 2 hence it has been restricted and the support of the Majority Class (M1, M2, M3, M5) are equal and greater than the value 2 hence it has not been restricted.
c) CONDITION 3:
If Condition 2 is not satisfied, mintofuse will be applied it mainly restricts the minimum occupancy of the majority class in an interval, i.e., |Mk| ≥ mintofuse threshold. Since condition 3 restricts the cut points based on the values of the majority class. In the above example mintofuse =0.75 has been given and after 0.75 there is no cut-point, after 0.78 only cut-point has been given hence it has been restricted.
d) VALREDUCT:
iv. PreSAGe Algorithm:
Figure 1.3 Example of PreSAGe Algorithm
v)
i) Extract the Feature Vector F from the Training Image.
STEPS:
ii) Sort the Feature Vector F.
iii) Create a Keyword as Image Class C, and Threshold values minperint, mintofuse and valreduct.
iv) Apply Condition 1 ( determine Cut Points) in between the features extracted from the image. v) Apply Condition 2 (minperint which restricts the occurrences of the features) to remove the Cut Points.
vi) Apply Condition 3 (mintofuse which
restricts the occupancy i.e., value of the features) to remove and obtain the final Cut Points.
vii) Save the remaining Cut Points.
viii) Rank the Features according to the number of Cut Points.
ix) Generate the least number of Cut Points by selecting the formula 1-valreduct*|F| .
x) Obtain the selected and discretized Feature Vectors.
D. Existing Algorithm:
i) Apriori Algorithm
In data mining, association rule is a popular and well researched method for discovering interesting relations
between variables in large databases. Piatetsky-Shapiro describes analyzing and presenting strong rules discovered in databases using different measures of interestingness (Piatetsky-Shapiro, 1991). Based on the concept of strong rules, Agrawal et al. introduced association rules for discovering regularities between products in large scale transaction data recorded by point-of-sale (POS) systems in supermarkets [6]. Association rule mining finds interesting associations and/or correlation relationships among large set of data items [13]. Association rules shows attributed value conditions that occur frequently together in a given dataset. Mining association rules on large data sets has received considerable attention in recent years. Association rules are useful for determining correlations between attributes of a relation and have applications in marketing, financial, and retail sectors. Furthermore, optimized association rules are an effective way to focus on the most interesting characteristics involving certain attributes. Optimized association rules are permitted to contain uninstantiated attributes and the problem is to determine instantiations such that either the support or confidence of the rule is maximized [19].
retail data of customer transactions at your store. The knowledge that customers who purchase IBM Laptop also tend to buy HP Epson Color Printer at the same time is represented in the association rule below.
Support = Sup(XuY) / R Confidence=Sup(XuY) / Sup(X) IBM Laptop → Epson Color Printer
[support = 2%, confidence = 60%]
Support and confidence are two measures of rule interestingness. In the above association rule, the support of 2% means that 2% of all the transactions under analysis show that IBM Laptop and HP Epson Color Printer are purchased together. The confidence of 60% means that 60% of the customers who purchase IBM Laptop also buy HP Epson Color Printer. In a nutshell, support represents the percentage of data samples that the given rule satisfies and confidence assesses the degree of certainty of the detected association. Support and confidence are usually set by users or domain experts.
Figure 1.4 Classifier For All Categories Using Apriori
ii) Apriori Pseudo code:
iii)
i. Extract the features from the Image
STEPS:
ii. Perform discretization using PreSAGe algorithm
iii. Obtain the features inorder to generate rules iv. Generate Rules for each features
v. If the value of the features is low means it belongs to normal
vi. If the value of the features is high means it belongs to malignant
vii. If the value of the features between normal and malignant means it belongs to benign
viii. Find the Support of all features using the formula Support = Sup (XuY) / R
ix. Find the Confidence of all the features using the formula
Confidence=Sup(XuY) / Sup(X)
x. Compare the Confidence value to the keyword that has been found using the HiCARe algorithm xi. Display the result 0 means normal, 1 means benign,
2 means malignant
E. Proposed Algorithm:
i) MARI:
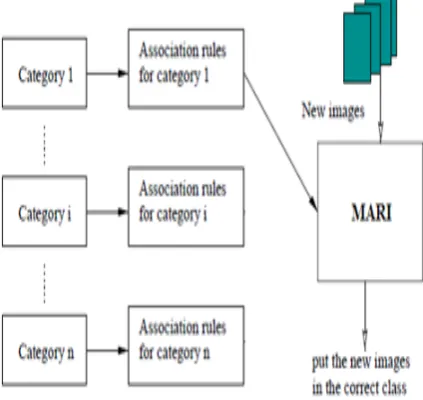
MARI (Mining Association Rule in Image database) algorithm for association rule mining, which finally produces a pruned set of rules representing the actual classifier [2]. MARI Find association on the training set of the transactional database. The rules generated in the mining phase are expected to be very large. This could be a problem in applications where fast responses are required. Hence, the pruning techniques become necessary to eliminate the specific rules and which are conflicting with the same characteristics pointing different categories. The rules generated in the mining phase are expected to be very large. This could be a problem in applications where fast responses are required. In the Training Phase after discretize the features from image it has been divided into categories for better diagnosing, such that
a. Category 1- Normal b. Category 2- Benign c. Category 3- Malign
The main use of MARI (Mining Association Rule in Image database) algorithm is that after finding the values using PreSAGe algorithm, the user will generate rules using MARI algorithm according to the seven haralick texture features (step, variance, entropy, energy, homogeneity, 3º moment and inverse variance) and for each features three category will be defined normal, benign, malignant i.e., category 1 means normal and category 2 means benign and category 3 means malignant and according to that rules will be generated. Hence 21 rules will be generated using this MARI algorithm where as the rules generated using Apriori algorithm is more hence the time and memory saved using MARI algorithm.
ii) MARI PSEUDOCODE:
iii) STEPS:
i. Extract the features from the Image
ii. Perform discretization using PreSAGe algorithm iii. Obtain the features inorder to generate rules iv. For the seven haralick features generate rules
v. For each features three categories will be defined normal, benign, and malignant
vi. If category 1 means normal, category 2 means benign, category 3 means malignant
vii. Find the Support of all features using the formula Support = Sup (XuY) / R
viii. Find the Confidence of all the features using the formula
Confidence=Sup (XuY) / Sup(X)
ix. Compare the Confidence value to the keyword that has been found using the HiCARe algorithm
x. Display the result 0 means normal, 1 means benign, 2 means malignant
F. HiCARe (Classifier based on High Confidence
Association Rule Agreements):
HiCARe (Classifier based on High Confidence Association Rule Agreements) is a new special classifier able to return multiple classes (keywords) when processing a test image [20]. The extracted features of the test image and the feature vector generated can be submitted to the classifier, which uses the association rules and generates set of keywords to compose the diagnosis of a test image. The classifier returns the multiple classes when processing a test image [14]. The algorithm developed has been employed to generate suggestions for diagnosis. This algorithm stores all item sets (i.e. Set of keywords) belonging to the head of the rules in a data structure. An item set h is returned in the suggested diagnosis if the condition is satisfied as the given equation
Where nM(h) is the number of matches of the itemset h and nN(h) is the number of not matches of the itemset h. Threshold ß is employed to limit the minimal number of matches required to return an item set in the suggested diagnosis. A match occurs when the image features satisfy the body part of the rule.
i) HiCARe Algorithm:
ii) STEPS:
i)Extract the Feature Vector F from the Test Image ii) Check the condition, if body matches to head or not iii)If the body and head matches, increment nM(h) ++ iv) If the body and head does not matches, increment nN(h) ++
v) Set ß as Threshold Value vi) Apply the condition
where nM(h) is the number of matches of the itemset h and nN(h) is the number of not-matches inorder to find the keyword
vii) If the condition is satisfied the keyword is returned
III. RESULTS AND DISCUSSION
An experiment has been conducted on a CT scan brain image data set based on the proposed flow diagram as shown in Figure 1.1. The pre-diagnosed databases prepared by the physicians are considered for decision making. Figure 1.6 represents the original input image and Figure 1.7 shows the result of histogram equalization is used to reduce the different illumination conditions and noises at the scanning phase.
matrix for zero degree and Figure 1.11 shows the Co-occurrences matrix for distance one and degree zero.
Figure 1.6 Input CT scan brain image
Figure 1.7 Histogram Equalization
Figure 1.8 Matrix representation for center pixel and all around pixels
Figure 1.9 Preprocessed CT scan brain image merged with angle representation
Figure 1.10 Pixel representation matrix for Zero Degree
Figure 1.11 Co-occurrence matrix for distance one and degree zero
The effectiveness of the proposed method has been estimated using the following measures:
a. Accuracy=(TP+TN)/(TP+TN+FP+FN) [12] b. Sensitivity= TP/ (TP+FN) [12]
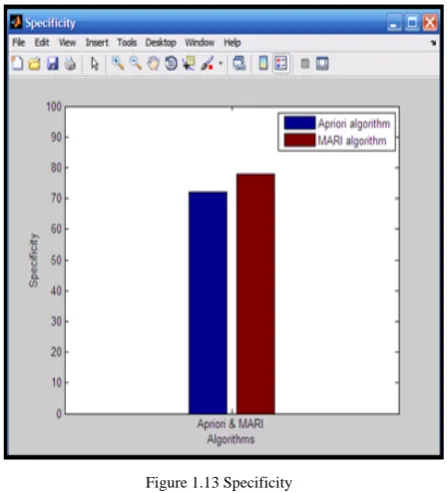
c. Specificity= TN/ (TN+FP) [12]
where, TP, TN, FP, and FN are the number of True Positive cases (abnormal cases correctly classified), the number of True Negatives (normal cases correctly classified), the number of False Positives (normal cases classified as abnormal), and the number of False Negatives (abnormal cases classified as normal) respectively. Accuracy is the proportion of correctly diagnosed cases from the total number of cases. Sensitivity measures the ability of the proposed method to identify abnormal cases. Specificity measures the ability of the method to identify normal cases.
Figure 1.14 ROC Curve Graph Figure 1.12 Sensitivity
Specificity measures the ability of the method to identify normal cases. Specificity is defined as the proportion of people without disease who have a negative test result. The specificity of a test refers to how accurately it diagnoses a particular disease without giving false-positive results. A numerical value can be calculated for a test's specificity that represents the probability of it returning a "false" value for samples (i.e., patients) from the population of interest (i.e., samples from patients who are in fact healthy); this is often described as a test's "negativity in health." Numerically, specificity is the number of true negative results (TN) divided by the sum of true negative and false positive (FP) results, i.e., specificity = TN/ (TN + FP).
Figure 1.13 Specificity
The Receiver Operating Characteristic (ROC) curves are plotted with respect to sensitivity and specificity. The area under the ROC plays a vital role since it has been used to determine the overall classification accuracy. Fig 1.14
shows the comparison of the ROC curve for various classifiers. It clearly shows that the proposed mining based classification with pruned rules has higher value of accuracy as compared to other methods. Table 1.2 represents the results of the classifiers, here 150 images are taken for training and 95 images are taken for the testing in both benign and malignant categories, which are classified using different classifiers. The results show that the proposed system gives better percentage of correct classification as compared to Apriori.
Table 1.2 Results of the Classifier
Approach Sensitivity Specificity Accuracy Time
EXISTING 86 72 89 1.1069
PROPOSED 94 78 95 1.0460
IV. SOFTWARE
The experiments were performed on a Dual-Core Intel Processor (CPU 2.4 GHz) and 1 GB RAM. The algorithms were implemented in MATLAB and were run under Windows XP. MATLABis a high-level technical computing language and interactive environment for algorithm development, data visualization, data analysis, and numerical computation. Using MATLAB, you can solve technical computing problems faster than with traditional programming languages, such as C, C++, and FORTRAN. MATLAB used in a wide range of applications, including signal and image processing, communications, control design, test and measurement, financial modeling and analysis, and computational biology. MATLAB has powerful graphic tools and can produce nice pictures in both 2D and 3D. It is also a programming language (similar to C) and is one of the easiest programming languages for writing mathematical programs. The other software which has not give accurate result while applying in image dataset where as the MATLAB software can be applied in any kind of images and also the user can get accurate result.
V. DATASET
CT scan take cross-section views of the brain, or other anatomy, to show soft tissue and anomalies that may suggest lesions, tumors or other problems. After a CT scan is completed, the images are transferred to X-ray film with select cross-sections shown to give doctors and patients a clearer picture of any potential problem. The most frequently used test to detect brain tumor is a CT scan (computerized tomography). The total number of CT scan brain images used for my research is 150 and the whole 150 images used in the training phase and 75 CT scan brain images used in the testing phase to find the image belongs to normal, benign, or malignant. The CT Scan Brain Images dataset have been used for the research in order to find the image which belongs to normal, benign, or malignant.
VI. CONCLUSION
An improved image mining technique for brain tumor classification using pruned association rule has been developed and the performance is evaluated. The accuracy of 95% and sensitivity of 93% were found in classification of brain tumors. The proposed algorithm has been found to be performing well compared to the existing classifiers. The accurate accuracy and sensitivity were found in classification of brain tumors. The developed brain tumor classification system is expected to provide valuable diagnosis techniques for the physicians. Future work includes improving the feature extraction step to obtain more representative features and also hybrid image mining technique for brain tumor classification using association rule with decision tree method has been developed and performances evaluated. The median filtering techniques have efficiently reduces the speckle noises present in the CT scan brain images. The extracted objects using canny edge detection technique provides better results as compared to conventional method.
VII. REFERENCES
[1]. J.B.W. Pluim, J.B.A. Maintz, and M.A. Viergever, “Mutual information based registration of medical images,” A survey. IEEE Transactions on Medical Imaging, 22(8):2003, pp. 986-1004.
[2]. P. Haiwei, J. Li, and Z. Wei, “Medical image clustering for intelligent decision support,” in Proc. 2005 27th Annu. Int. Conf. IEEE Eng. Medicine Biol. Soc., Shanghai, China, 2005, pp. 3308–3311.
[3]. P. Stanchev , M. Flint, “Using Image Mining For Image Retrieval,” In. Proc: IASTED conf. Computer Science and Technology, 2003, pp. 214- 218.
[4]. E. Laila, A.A. Walid, “Mining Medical Databases using Proposed Incremental Association Rules Algorithm (PIA),” In Proc: IEEE Second International Conference on the Digital Society, 2008, pp 88-92.
[5]. S.R. Daniela, “Mining Knowledge in Computer Tomography Image Databases,” Multimedia Data Mining and Knowledge Discovery, Springer London, 2007. [6]. R. Agrawal, T. Imielinski, And A.N. Swami, “Mining
association rules between sets of items in large databases,” In Proc: ACMSIGMOD Int. Conf. Manage, Washington, DC, 1993, pp. 207-216.
[7]. S. Kotsiantis, D.Kanellopoulos, “Association Rules Mining: A Recent Overview,” GESTS International Transactions on Computer Science and Engineering, 32 (1):2006, pp. 71-82.
[8]. M. Klemettinen, H. Mannila, P. Ronkainen, H. Toivonen, and A. Verkamo, “Finding interesting rules from large sets of discovered association rules,” in Proc. 3rd Int. Conf. Inf. Knowledge Manage. - CIKM 94 CIKM 94, Gaithersburg, MD, 1994, pp. 401–407.
[9]. P.G. Foschi, D.Kolippakkam, H. Liu, and A. Mandvikar , “Feature extraction for image mining,” In Proc: 8th Int. Workshop Multimedia Inf. Syst, Tempe, AZ, 2002, pp. 103-109.
[10]. V. Megalooikonomou, J. For ,F. Makedon , “Data Mining in Brain Imaging,” Statistical Methods in Medical Research, 2000, pp. 359-394.
[11]. B.A. Dogu, H. Markus, A.Tuukka, D. Prasun, and H. Jari , “Texture Based Classification and Segmentation of Tissues Using DT-CWT Feature Extraction Methods,” In Proc: 21st IEEE International Symposium on Computer-Based Medical Systems, 2008, pp.614-619.
[12]. P. Rajendran , M.Madheswaran, “An Improved Image Mining Technique For Brain Tumour Classification Using Efficient classifier,” (IJCSIS) International Journal of Computer Science and Information Security, Vol. 6, No. 3, 2009.
[13]. C. Ordonez, E. Omiecinski , “Image mining: A new approach for data mining,” Technical Report GITCC-98-12, Georgia Institute of Technology, College of Computing, 1998, pp 1-21.
[14]. R. Abraham, J.B. Simha,and S.S Iyengar, “Medical datamining with a new algorithm for Feature Selection and Naive Bayesian classifier,” In Proc: 10th International Conference on Information Technology (ICIT), 2007, pp. 44-49.
[15]. X.R. Marcela, H.B. Pedro, T.J. Caetano, M.A.M. Paulo, A.R. Natalia, and J.M Agma, “Supporting Content-Based Image Retrieval and Computer-Aided Diagnosis Systems with Association Rule-Based Techniques,” Data & Knowledge Engineering, in press.
[17]. R. S. Kazemzadeh and K. Sartipi, “Incorporating data mining applications into clinical guidelines,” in Proc. 19th IEEE Int. Symp. Computer- Based Med. Syst., Salt Lake City, UT, 2006, pp. 321–328.
[18]. P. Dollar, T. Zhuowen, T. Hai, and S. Belongie, “Feature Mining for Image Classification,” In Proc: IEEE Conference on Computer Vision and Pattern Recognition, 2007, pp. 1-6.
[19]. Bronnimann. H, Chen B, Dash M, Hass,. P, Scheuermann. P, “Efficient Data Reduction with EASE,” In.proc.9th International Conference on KDD(2003).